Florida State University; 3. Nanyang. Technological University School of Art, Design, and Media; 4. .... Such systems will inevitably entail new forms of expertise: a surgeon can read ... Dr. Manu Kapur is an Assistant Professor in the Learning.
Assessment of Group and Individual Learning through Intelligent Visualization (AGILeViz) AIED07 Workshop Proposal Eric Hamilton1, Amy Baylor2, Mark Chavez3 Ron Cole4, Chris DiGiano5, Andy Hurford1, Michael Jacobson6, Manu Kapur6, Leo Lee7, Richard Lesh8, Manuel Lima9, Philip Vahey5 1. Center for Research on Learning and Teaching, Institute for Information Technology Application, US Air Force Academy; 2. Florida State University; 3. Nanyang Technological University School of Art, Design, and Media; 4. Center for Spoken Language Research, University of Colorado at Boulder; 5. SRI International; 6. Learning Sciences Laboratory (LSL) at the National Institute of Education (NIE) of Singapore; 7. Sparkpoint Consulting; 8. University of Indiana; 9. Parsons School of Design Purpose of the Workshop The purpose of this workshop is to discuss how to provide educators with sophisticated, computer-generated visualizations of learning by groups and individuals to improve their teaching. The organizers of the workshop are motivated by the convergence of several factors that bear directly on the AIED07 vision to build technology-rich learning contexts that work: • Developers of intelligent tools for learning, and educational innovators more broadly, are using technology to understand and to propel learning in ways that dwarf the limited paradigms of assessment tools that dominate educational practice. • Such assessment tools not only are highly constrained in the constructs that they measure, but the representational systems used to communicate student progress on such assessments are very limited. The representational systems used, such as single value test and subtest score report, pie or bar charts charts, and linear summaries of mastery estimates, are inadequate for representing progress in the kinds of learning and problem-solving behavior that will be increasingly important to assure in the future. • Interactive information visualization techniques for large quantities of heterogeneous data have now reached a state of maturity that make them ripe for application to the domain of data-drive decision making in education. • Advances in graphics capabilities of personal computers mean that responsive 3D interfaces are now affordable to many educators. Our goal is to nurture the nascent area of applying complex graphical systems for assessment of complex individual and group learning. This area is ripe to become a “hot topic,” we believe that this workshop will likely lead to ground-breaking subsequent literature that will prove crucial to educational innovation and the implementation of new tools for assessment. We have caucused colleagues internationally and believe that AIED is the most appropriate venue for such a workshop. The lead organizer is a former division director at NSF and another member of the program committee (Amy Baylor, participating in an independent researcher capacity only) is a current rotator at NSF. We are confident, based on our experience, that this is just the sort of promising area that can lead research agencies in the US or other countries to create new programs or other opportunities for research funding.
1
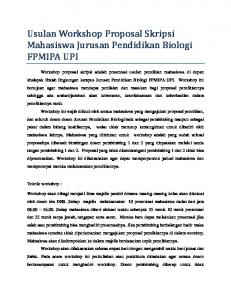
We will recruit papers from a cross-section of disciplines. The team is experienced in engaging multidisciplinary teams for collaborative research, and we are confident that we will attract not only investigators who will come to AIED as a matter of course but those who would not likely otherwise consider attending the conference. The benefits for bringing newcomers to AIED are extensive, affecting both the newcomers and the AIED community. Rationale Some of the most intractable challenges in education policy and practice involve effective design and use of tools to assess learner progress. Assessment tools produce small amounts of one dimensional information (i.e., test or mastery scores) from which large and important inferences are drawn about the complex phenomenon of human learning. While there have been innovative attempts at improving assessment, for instance through the use of portfolios, there are significant weaknesses in the time it takes to assemble, organize and then process them to create a comprehensive or rounded judgement about a student’s learning. Societal pressure to measure student progress is understandable, especially in an era of failing or unsatisfactory schools. This pressure, though, exacerbates the phenomenon by which teachers and school systems more generally are compelled to emphasize activities and ways of thinking about instruction that directly address the limited dimensions of their assessment systems. As the AIED research community continues to articulate cognitive and affective processes in learning and develops intelligent tools to elicit and nurture those processes, the contrast between what is known and possible in education and what is constrained by limited-dimension assessment systems, is stark and growing. Research on ontologies, models for learning, self-regulatory and scaffolding mechanisms, intelligent tutors, interactivity in virtual worlds or with avatars, for example, are among activities that map out, probe, and propel fundamentally different types of learning than can be readily assessed with off-the-shelf assessment systems. This workshop is based on a conjecture that complex visualization systems may be applied to learner assessments to create a new class of instruments that more effectively highlight complex phenomena in learning. Examples of what might be involved include uses of sophisticated graphics for understanding the dynamics of weather, sports, or game settings. Weather maps display vast amounts of information in ways that highlight relationships between storm or frontal subsystems and their animation depicts dynamic processes. Major League Baseball employs a website for play-by-play information as a game unfolds. Figure 1 provides the display for one batter from the 2006 World Series. Hundreds of discrete pieces of information appear in the display. Several features are at play: Observers from novice to the sophisticated expert can use the display to understand to flow of action in the game. The information is intuitive yet organizes complex information. It highlights relationships between data, situating the
Figure 1: “Enhanced GameDay” on mlb.com This display is the kind of data-rich and intuitive display that illustrates the workshop vision for displaying large amounts of information that model learner and classroom dynamics.
2
current event (pitch, ball in play, etc.) in the context of previous at-bats, previous pitches, the overall game, and the other current conditions in the game. The data that is displayed is heterogeneous. Multiple timeframes (speed of a ball; inning of the game) appear. What might be most salient about the display is how much rich information can be displayed and processed in a short period of time. Such sophisticated graphics convey complex and nuanced relationships and information. What might be involved in displaying information about an individual’s or a classroom’s learning progress? Heterogenous data sets can include data produced by intelligent tools, progress in a virtual world or other simulation, such as frequency of help-seeking behavior or other self-regulatory behaviors, iterations along an ontology, text messaging in peer tutoring relationships, queries, and engagement data. These disparate types of data can be combined with historical data from traditional tests or other assessments, and include qualitative data. The goal is to produce graphics systems that can process such data and display it in a structured way that is intuitive, rich, nuanced, and understandable. It should highlight relationships and furnish the basis for authentic data-driven instructional or other intervention decisions. Yet the use of such tools for conveying complex information about student learners is virtually non-existent. Websites such as http://www.visualcomplexity.com/vc/ (Figure 6, organized by Program Committee member and information architect Manuel Lima) or the University of Maryland’s HCIL Laboratory http://www.cs.umd.edu/hcil/research/visualization.shtml are popular for taxonomizing or summarizing graphical modeling systems; they give examples of a broad cross-section of social, economic and behavioral processes but none from education or the assessment of learning. Richard Lesh introduced the construct of “Learning Progress Maps” when he was the senior scientist at ETS [1]. Learning Progress Maps, or LPMs, can be defined as graphic, n-dimensional, interactive displays that both portray student achievements and simultaneously trace their evolution. The LPMs shown in Figures 2-5 are computer-generated interpretations of early examples of what one group of teachers produced. Lesh described the design activity [2]: “During the process of designing useful LPMs, one distinguishing characteristic of the most effective teachers was the clarity with which they recognized the small number of ‘big ideas’ in their courses. In these maps, these ‘big ideas’ were referred to as ‘mountains’ with related basic skills residing in adjacent valleys (Figure 3) or in two dimensional rendering (Figure 4). In this case, a given student’s progress was described using gestures and graphics similar to those used in historical atlases – which describe phenomena such as the spread of a culture throughout some geographic region (Figure 5).” As the maps show, some portions were mastered (shaded regions); others could be visited but were not yet mastered; and, still others were unfamiliar. Under
3
support from NSF’s Human and Social Dynamics Program (HSD) we are holding a series of virtual research seminars with partners in England to refine the notion of LPMs and will use those seminars to recruit papers for the AIED workshop [2, 3]. LPMs are just one example of potentially intuitive but information-rich displays that facilitate nuanced instructional judgements in short time frames. It is our expectation that visualization systems will help create new real-time sightlines into learner cognition and provide far more information than teachers or learners are currently accustomed to processing in learning contexts, but not more than can be managed. The workshop is focused on finding ways to organize large information sets about learning progress in efficient visual systems. Such systems will inevitably entail new forms of expertise: a surgeon can read complex medical images and make rapid and accurate judgements about a medical condition because s/he has developed a systems-level expertise. A fighter pilot makes split second decisions based on dozens of instrument readings and sightlines from the cockpit. In these instances, the professional does not and cannot use every piece of information, but his or her expertise knows what information to process and what system relationships create the unique context that requires a decision. The enconium, “Experts not only do things differently, they see things differently [4]” is especially appropriate. In each of these situations, sophisticated representational systems scaffold the formation of decision-making expertise. Such systems do not exist for educators, despite the plethora of potential data sources that can be combined. The type of data educators use in real-time is meager, non-relational, and fragmented. Type of papers: The papers we seek will be exploratory in the service of building an initial research agenda. We will recruit papers in areas such as: • Converting concept and progress maps to digital inputs • Graphics design for data-driven instructional decision-making • Data-driven instructional decisionmaking • Scrutable [5, 6] learner modeling • Group process maps • Dynamical flow representation in learning • ePortfolio representational systems • Visual interfaces tht require only intermittent attention • Balancing macro and micro views of the classroom Program committee The planning committee include several individuals currently involved in an effort funded by NSF to develop a collaborative network platform that blends artificial agents, remote peer tutoring relationships, digital objects, and tablet interfaces [7]. Eric Hamilton, Director for the Center for Research on Learning and Teaching and on the mathematics faculty at the US Air Force
Figure 6: VisualComplexity.com This website displays and categorizes different approaches to the use of visual systems in different social, economic and research spheres. It is organized by information architect Manual Lima, who is participating in the workshop proposal.
4
Academy, Chris DiGiano, Sr. Scientist at SRI International, and Ron Cole, Director of the Center for Spoken Language Research at Colorado-Boulder, are co-Pis on this project. DiGiano and Cole are both computer scientists. Philip Vahey, research scientist in learning technologies from SRI and Leo Lee, software engineer, are members of the project team. Andy Hurford is a physicist and learning science postdoc at the Air Force Academy. Dick Lesh is Rudy Distinguished Professor of Mathematics Education at Indiana University and is an assessment expert and mathematician who developed the original construct of learning progress maps. Michael Jacobson is a science educator and complexity theorist at the Learning Sciences Laboratory at the National Institute for Education (NIE) of Singapore. Mark Chavez, MFA, is an Assistant Professor in the Nanyang Technological University School of Art, Design, and Media. He has over twenty years of experience in the computer graphics industryand has been involved design research involving the creation of 3D characters backed with artificial intelligence and real-time automated animation techniques. Dr. Manu Kapur is an Assistant Professor in the Learning Sciences Laboratory at the National Institute of Education (NIE) of Singapore. His research applies the laws of self-organization and complexity to study the ontology of individual and collective cognition. Manuel Lima is an information architect, interaction designer, researcher and founder of the previously cited VisualComplexity.com, a comprehensive repository of complex network visualizations. Amy Baylor is an Associate Professor at Florida State University, well known for research on peer agents. She is currently on leave from Florida State to the National Science Foundation. Of these twelve individuals involved in reviewing papers and planning the program, we expect at least eight to attend the conference and likely more.
References 1.
2. 3.
4. 5. 6. 7.
Lesh, R., et al., Using learning progress maps to improve educational decision making, in Assessment of authentic performance in school mathematics, R. Lesh and S.J. Lamon, Editors. 1992, American Association for the Advancement of Science Washington DC. Hamilton, E., et al., Model-Eliciting Activities (MEAs) and Their Assessment as a Bridge Between Engineering Education Research and Mathematics Education Research. Journal for Engineering Education, in review. Hamilton, E., et al., Enhancing and Assessing Complex Reasoning through Models and Modeling: UK-US Collaborative Research. 2007 (recommended), NSF: Supplement to NSF 0433373 (Assessing and Enhancing Complex Reasoning, Hamilton PI). Lesh, R., E. Hamilton, and J. Kaput, Directions for Future Research, in Models and Modeling as Foundations for the Future in Mathematics Curriculum, R. Lesh, et al., Editors. 2007, Erlbaum. : Mahweh, NJ. Bull, S., et al., eds. Some Unusual Open Learner Models. Frontiers in Artificial Intelligence and Applications: Artificial Intelligence in Education, ed. C.-K. Looi, et al. Vol. 125. 2005, IOS Press: Amsterdam. Kay, J.A., Accretion Representation for Scrutable Student Modelling, in Proceedings of the 5th International Conference on Intelligent Tutoring Systems. 2000, Lecture Notes in Computer Science. p. 514-523. Hamilton, E., et al., Agent and Library Augmented Shared Knowledge Areas (ALASKA). 2004: National Science Award 0420310.
5