Chin. Geogra. Sci. 2012 Vol. 22 No. 3 pp. 264–277 doi: 10.1007/s11769-012-0535-z www.springerlink.com/content/1002-0063
Agriculture Development-induced Surface Albedo Changes and Climatic Implications Across Northeastern China ZHANG Xuezhen1, 2, 3, WANG Wei-Chyung3, FANG Xiuqi2, YE Yu2, ZHENG Jingyun1 (1. Institute of Geographic Sciences and Natural Resources Research, Chinese Academy of Sciences, Beijing 100101, China; 2. School of Geography, Beijing Normal University, Beijing 100875, China; 3. Atmospheric Sciences Research Center, State University of New York, Albany, NY 12202, USA) Abstract: To improve the understandings on regional climatic effects of past human-induced land cover changes, the surface albedo changes caused by conversions from natural vegetation to cropland were estimated across northeastern China over the last 300 years, and its climatic effects were simulated by using the Weather Research and Forecasting (WRF) model. Essential natural vegetation records compiled from historical documents and regional optimal surface albedo dataset were used. The results show that the surface albedo decreased by 0.01–0.03 due to conversions from grassland to cropland in the Northeast China Plain and it increased by 0.005–0.015 due to conversions from forests to cropland in the surrounding mountains. As a consequence, in the Northeast China Plain, the surface net radiation increased by 4–8 W/m2, 2–5 W/m2, and 1–3 W/m2, and the climate was therefore warmed by 0.1℃–0.2℃、0.1℃–0.2℃、 0.1℃–0.3℃ in the spring, autumn and winter, respectively. In the surrounding mountain area, the net radiation decreased by less than 1.5 W/m2, and the climate was therefore cooled too slight to be detected. In summer, effects of surface albedo changes on climate were closely associated with moisture dynamics, such as evapotranspiration and cloud, instead of being merely determined by surface radiation budget. The simulated summer climatic effects have large uncertainties. These findings demonstrate that surface albedo changes resulted in warming climate effects in the non-rainy seasons in Northeast China Plain through surface radiation processes while the climatic effects in summer could hardly be concluded so far. Keywords: surface albedo; land cover change; climatic effects; last 300 years; northeastern China Citation: Zhang Xuezhen, Wang Wei-Chyung, Fang Xiuqi, Ye Yu, Zheng Jingyun, 2012. Agriculture development-induced surface albedo changes and climatic implications across northeastern China. Chinese Geographical Science, 22(3): 264–277. doi: 10.1007/s11769-012-0535-z
1
Introduction
Land surface properties, such as albedo, fractional vegetation coverage, moisture content, roughness, determine the energy, radiation, moisture flux to atmosphere and thus have important climatic implications (Pielke et al, 2002; Fu, 2003; Foley et al., 2005; Mahmood et al., 2010). Human-induced land cover conversions from natural vegetation to anthropogenic cropland for the food and fiber have been hence considered as an important way in which human activities impact climate,
in addition to emit greenhouse gas to change atmosphere components (Forster et al., 2007; IGBP, 2009). It is well known that albedo determines surface absorption capability for the solar radiation and thus impacts the surface radiation balance. Surface albedo changes and associated changes in surface energy budget were studied broadly (Forster et al., 2007). IPCC AR4 (Forster et al., 2007) reported that conversions from forest to cropland resulted in an enhanced surface albedo and decreased surface net radiation in the last 300 years in the mid-high latitude range of the Northern Hemisphere;
Received date: 2011-04-27; accepted date: 2011-12-23 Foundation item: Under the auspices of National Natural Science Foundation of China (No. 41001122), China Global Change Research Program (No. 2010CB950102, 2010CB950903), State-Sponsored Study Abroad Programs from China Scholarship Council (No. 2007U21061) Corresponding author: ZHANG Xuezhen. E-mail:
[email protected] © Science Press, Northeast Institute of Geography and Agroecology, CAS and Springer-Verlag Berlin Heidelberg 2012
ZHANG Xuezhen et al. Agriculture Development-induced Surface Albedo Changes and Climatic Implications Across …
consequently, a cooling climatic effect occurred. It is distinguished that such climatic effect is different from green house gas-induced climatic effects which could distribute global evenly. The changes in surface albedo and its climatic effects had large spatial variability. For instance, the radiative forcing (RF) in agricultural areas in North America and Asia-Europe was estimated to reach up to –5 W/m2, which is much higher than global mean of –2 ± 2 W/m2 (Forster et al., 2007). The spatial variability was mainly derived from spatial heterogeneity of natural vegetation which was cleared. Therefore, it is as well as valuable to study land cover changes and its climatic effects at regional scale (Forster et al., 2007; Mahmood et al., 2010). Northeast China, a key cultivated area in China, has undergone tremendous surface conversions from natural vegetation to cropland in the last 300 years. Historical records indicate that the cropland area was approximately zero in the 17th century (Jing, 1987; Yi, 1994; Ye et al., 2009), whereas it increased to 9.8% of Northeast China area in 1908 (Ye et al., 2009) and up to 29.6% in 2000 estimated from the China/GLC2000 dataset retrieved from VEGETATION/SPOT4 satellite data (Fritz et al., 2003). Such rapid cropland extension suggests an intense clearance of natural vegetation. However, the surface albedo changes and its climatic implications resulting from such conversions from natural vegetation to cropland are poorly known so far. As mentioned above, to understand regional land cover conversions induced by agriculture development, the knowledge on regional natural vegetation which had been cleared is of primary importance. Previously, the Potential Natural Vegetation (PNV) data was used extensively as the historical natural vegetation prior to cropland (Forster et al., 2007). As we know, the PNV was defined as natural vegetation under present climate conditions in the absence of human perturbations (Küchler, 1964). The PNV is usually obtained through numerical simulation with biogeography models, such as the BIOM3 model, under present climate conditions or by assuming that small-scale vegetation, undisturbed by human, is representative of large-scale PNV (Forster et al., 2007). Thereby, the present PNV may be different from the vegetation which essentially existed in the historical climate conditions. The comparison of historical natural vegetation records with the present PNV from the BIOM3 model (Ramankutty and Foley, 1999) illus-
265
trate that the present PNV overestimated the historical mixed forest area and grassland area and omitted the historical wetland in Northeast China (Zhang et al., 2011). Therefore, to improve our understanding on agriculture development-induced land cover conversions, this study used the historical records-based natural vegetation data from Zhang et al. (2011). In addition to the knowledge on the historical natural vegetation, the surface albedo value is another key factor causing uncertainties in understanding the climatic effects of land cover changes (Forster et al., 2007). For each type of land cover, previous studies broadly used the uniform surface albedo which is generally a global mean value of the same type of land cover. However, analysis based on the Moderate Resolution Imaging Spectroradiometer (MODIS) albedo data demonstrated that there are large differences among the same type of land covers from different regions of the world (Myhre et al., 2005). Thus, using the uniform surface albedo may result in uncertainties in our understandings of regional surface albedo changes associated with land cover conversions. To cut down such uncertainties, it is necessary to calculate regional optimal surface albedo values for each type of land cover using present remote sensing datasets (Myhre et al., 2005). This paper aims to estimate surface albedo changes and simulate their effects on regional climate associated with agriculture-induced land cover conversions across the northeastern China. In this study, the historical records-based reconstruction of pre-agricultural natural vegetation data were used to analysis the land cover conversions due to agriculture development, and the regional optimal surface albedo dataset from MODISbased datasets were calculated to estimate the surface albedo changes induced by land cover conversions and to simulate their climatic effects using the Weather Research and Forecasting (WRF) model. It is expected to be able to improve our understandings on the land cover conversions induced by agriculture development in the northeastern China in the last 300 years and its effects on regional climate.
2
Data and Methods
2.1 Study area The study area was the northeastern China (38°42'– 53°36'N, 115°24'–135°12'E), covering Heilongjiang
266
Chinese Geographical Science 2012 Vol. 22 No. 3
Province, Jilin Province, Liaoning Province and the eastern part of Inner Mongolia Autonomous Region (Fig. 1). It has an area of 1.23 × 10⁶ km2, accounting for 12.8% of the whole China. The topography is characterised by the central plain and surrounding mountains. The study area is dominated by the East Asia Monsoon. The regional climate is characterised by a hot-wet summer and a cold-dry winter (Zhou, 1991). The mean January (July) temperature ranges from –30℃ (18℃) in the north to –5℃ (24℃) in the south. The annual precipitation ranges from 1000 mm in the southeastern Changbai Mountains to 300 mm in the Inner Mongolia Plateau. More than two thirds of the annual precipitation occurs in summer and it is normally dry in the beginning stages of plant growth in spring (Zhou, 1991). In the latter half of the 17th century, the entire study area was mostly covered by natural vegetation. Zhang et al. (2011) compiled historical records from local gazettes, governmental archives, private reading notes, private travel notes, compilation of historical documents and current research results on historical geography to reconstruct the natural vegetation distribution. As shown in Fig. 2a, except for mosaics of wetland in the Sanjiang
Fig. 1
Plain and in the central Songnen Plain, the study area was mainly covered by grasslands and woodlands. Grasslands spread across the central plain and the western Inner Mongolia Plateau and woodlands occupied the mountains around the central plain. In detail, deciduous needleleaf forests occupied the north of the Da Hinggan Mountains, deciduous broadleaf forests occupied Yanshan Mountains and the south of the Changbai Mountains, and all the other mountainous areas were covered by needleleaf-broadleaf mixed forests. It is noted that historical records were sparse in the Inner Mongolia area. However, it may be inferred that this area possibly was covered by grasslands because precipitation in this area was lower than that in the central plain, where grasslands were dominant. 2.2 Data and processing 2.2.1 Gridding process of scattered historical natural vegetation data As shown by Fig. 2a, the primary records on historical natural vegetation scattered across the northeastern China. However, the numerical simulation needs geographically explicit grid cell-based vegetation data.
Map of northeastern China and administrative distribution
ZHANG Xuezhen et al. Agriculture Development-induced Surface Albedo Changes and Climatic Implications Across …
Therefore, the scattered historical records were converted into grid cell-based nature vegetation distribution, as shown by Fig. 2b. Firstly, the cell size was defined as 60 km by 60 km because one historical record generally represents the domain of a county, which has an average area of 4200 km2 in the study area. Then, the mean elevation of each grid cell was calculated using the 1-km resolution GTOPO30 DEM data (http://edc.usgs.gov/ products/elevation/gtopo30.html) and the dominant soil type within each grid cell was obtained by referring to the Sino Soil Type Map (Institute of Soil Science, Chinese Academy of Sciences, 1978). Next, the spatial distribution information directly from the scattered historical records were used to determine the cell-based domains of grassland and woodland. In the case of missing historical records, the spatial interpolation method was applied to estimate the boundaries of grassland and woodland. The interpolation used the grid elevation as the co-variable, since the woodland or grassland distribution was associated with the elevation in this area (Fig. 2a) (Zhang et al., 2011). Moreover, scattered historical
Fig. 2
267
records on wetland were used to determine the wetland cells within the grassland area. Furthermore, the spatial domains of podzolic soil, dark brown soil and brown soil were used to identify the domains of deciduous needle leaf forest, mixed needle leaf and broadleaf forest and deciduous broadleaf forest, because natural forest type and soil type generally correspond with each other (Li et al., 2004). 2.2.2 Cropland data The present cropland data used in this research were from the Chinese regional products of the Global Land Cover 2000 dataset (GLC2000/China, hereafter) (Fritz et al., 2003). The GLC2000/China has a spatial resolution of 1 km and represents land cover in the year of 2000. The original data that were used to produce GLC2000/China were from the VEGETATION sensor onboard the SPOT4 satellite. The GLC2000/China dataset was created through the active participations of experts from more than 30 national, regional and international organizations of the world. Participations of local and regional experts brought critical local knowl-
Records on historical natural vegetation from historical documents (a) and grid cell-based historical natural vegetation distribution at cell size of 60 km by 60 km and present cropland (b)
268
Chinese Geographical Science 2012 Vol. 22 No. 3
edge and experience of their respective regions. This knowledge is valuable for improving the accuracy of land cover products (Giri et al., 2005). From the GLC2000/China dataset, the study region had a cropland area of 3.6 × 10⁵ km2, which accounted for 29.7% of the entire study area. The government reported a total cropland area of 2.6 × 10⁵ km2. Some studies have found that the local government used to underreport the cropland area to escape from taxes (Bi and Zheng, 2000; Frolking et al., 2002). For the three provinces (Heilongjiang Province, Jilin Province and Liaoning Province) in Northeastern China, the cropland area from governmental reports was estimated to be approximately 24% less than the actual area (Ye et al., 2006). Relying on the governmental reports and its bias of 24%, the actual cropland area might be 3.3 × 10⁵ km2 in 2002. This estimate was similar to that of the cropland area from the GLC2000/China dataset. Therefore, the GLC2000/China dataset has the ability to reveal the actual cropland area. 2.2.3 Surface albedo data The surface albedo dataset was from MCD43C1 and MCD43C3 (http://ladsweb.nascom.nasa.gov/data/search. html), both of which are components of the BRDF/ Albedo datasets from MODIS land products. MCD43C1 contains kernel weights needed by ′Kernel-derived model′ (Lucht et al., 2000; Schaaf et al., 2002), which are used to calculate black-sky albedo (BSA). The BSA is surface albedo for direct solar radiation and varies with solar zenith angle. There are three categories of weights for Isotropic kernel, RossThick kernel and LiSparse-R kernel, respectively. In addition to 30 kernel weights, there are four types of metadata which are the quality flag of the kernel weights, the zenith angle at local solar noon, the percentage of processed finer resolution data which contributed to this coarse grid box, and the percentage of underlying data flagged as snow. MCD43C3 contains two categories of albedo, which are white-sky albedo (WSA) and local noon black-sky albedo. The WSA is surface albedo for diffusion solar radiation and is independent on solar zenith angel. MCD43C3 also contains four types of metadata, same with MCD43C1. The two datasets were verified extensively by comparing them with field observations and were considered to have high accuracy (Liang et al., 2002; Wang et al., 2004; Salomon et al., 2006). They are designed for climate modelling and have a spatial resolution of 0.05
degree by 0.05 degree (latitude/longitude) (Gao et al., 2005). The temporal resolution is eight days. This study used the datasets from January 1st, 2002, to December 31st, 2008. There are totally 318 time slices in each dataset (the data on January 1st, 2007 was missing). 2.2.4 Surface spectrum albedo data processing It is well known that surface reflectance properties vary from the visible band (0.3–0.7 µm) to the infrared band (0.7–5.0 µm) and from direct solar radiation to diffusion solar radiation and has large seasonal variations. Therefore, this study mentioned four categories of monthly spectrum albedos: black-sky albedo for the visible band (BSA-Vis), black-sky albedo for the infrared band (BSAInf), white-sky albedo for the visible band (WSA-Vis) and white-sky albedo for the infrared band (WSA-Inf). As mentioned above, BSAs are calculated using three kernel weights and solar zenith angle through the ′Kernel-derived model′ (Lucht et al., 2000; Schaaf et al., 2002). Monthly kernel weights rather than BSA-Vis or BSA-Inf were prepared in this study. As a result, it is necessary to prepare monthly values of eight parameters (WSA-Vis, WSA-Inf, three kernel weights for BSA-Vis and three kernel weights for BSA-Inf) in both conditions of present cropland coverage and historical natural vegetation respectively. For the present land cover condition, we used MCD43C3 to calculate the climatology snow-free monthly mean of WSA-Vis and WSA-Inf and used MCD43C1 to calculate the climatology snow-free monthly mean of kernel weights associated with BSA. In detail, for any one parameter, we firstly removed the low quality (having a quality flag of three or four) pixels and snow cover pixels from original images; then, month by month, we calculated the mean values of all 8-day resolution images from the same month. Due to missing valid sample pixels, some pixels are missing data in a monthly mean image. To fill in such missing data pixels, linear interpolations using the previous and following monthly values at the same pixel location were carried out. As a result, we obtained present climatology monthly mean images of snow-free WSA-Vis, WSA-Inf, and kernel weights associated with BSA-Vis and BSA-Inf. For the historical conditions having entirely natural vegetation, the climatology snow-free monthly images of these parameters were created on the basis of the present images. In detail, for any one parameter, we firstly removed cropland pixels from present monthly images; then, we filled these pixels with the parameter
ZHANG Xuezhen et al. Agriculture Development-induced Surface Albedo Changes and Climatic Implications Across …
values of natural vegetation prior to cropland. The cropland pixels were identified using the GLC2000/China dataset which was combined into 0.05 deg by 0.05 deg with the dominance rule to have same spatial resolution with MCD43C1 and MCD43C3 datasets. The natural vegetation types in these pixels were identified using historical natural vegetation as shown by Section 2.2.1. The monthly parameter values of nature vegetation were obtained by calculating the mean value of pixels occupied by the same natural vegetation within present monthly image. As a result, we obtained historical climatology monthly mean images of snow-free WSA-Vis, WSA-Inf and kernel weights associated with BSA-Vis and BSA-Inf. For the numerical simulations, parameters with 0.05 degree by 0.05 degree resolution as mentioned above were combined into a 60 km by 60 km resolution of parameters by calculating the mean value of all the pixels within the 60 km by 60 km grid cell. The entire workflow mentioned above could be summarized as the Fig. 3. 2.3 Experiments design for climatic effects simulation Two groups of experiments with the WRF model (ver-
Fig. 3
269
sion 3.0) were performed. The two groups were merely identified by surface spectrum albedo. One group (present simulation, hereafter, PT group), control experiment group, used the spectrum albedo for the existing present cropland, and the other group (historical simulation, hereafter, HS group) used spectrum albedo for the historical natural vegetation. It is well known that numerical simulations have certain uncertainties. To decrease the random uncertainties of simulations, we implemented ensample simulations. Each group experiment consisted of three runs. The three runs adopted the same surface spectrum data and were merely identified by initialisation times. They initialised on January 1st, January 8th and January 15th, 2002 (UTC time, same as follows), respectively. All the runs stopped on March 1st, 2003. The mean of three runs was used to represent the results of group. Note that simulations before March 1st, 2002 were considered as the spin-up period and thus not analyzed. Besides the surface spectrum albedos, the six runs used the same lateral boundary forcing data (U wind, V wind, specified humidity, pressure and so on), sea ice data and sea surface temperature (SST) data, all of which were derived from the NCEP/FNL analysis dataset (http://dss.ucar.edu/datasets/ds083.2/) with a spatial
Flowchart of generating present and historical surface spectrum albedo
270
Chinese Geographical Science 2012 Vol. 22 No. 3
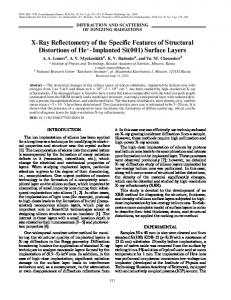
resolution of one degree and a time interval of six hours. All the runs used same domain settings (Fig. 4) and physical parameterization schemes. The domain has a central point of (46°N, 125°E), a horizontal resolution of 60 km, 64 grids in the west-east direction and 62 grids in the south-north direction. From bottom to top, there are 27 layers. The top layer has a pressure of 50 hPa. The lateral boundary uses the linear relaxation scheme having a relaxation zone of five grids. As well as, all the runs used the CAM3 radiation transfer scheme (Collins et al., 2004), WSM 3-class simple ice micro-physics scheme (Hong et al., 2004), Grell-Devenyi ensemble cumulus scheme (Grell and Devenyi, 2002), YSU boundary layer scheme (Hong and Pan, 1996) and NOAH land surface scheme (Chen and Dudhia, 2001). It is worthy noting that we added the kernel-driven model into the CAM3 radiation transfer scheme to calculate the BSA-Vis and BSA-Inf using the kernel weights and solar zenith angle.
initialised on January 1st, 2002. The simulated seasonal temperature at 2 m and summer precipitation from control experiment group, i.e. PT group simulations, were compared with contemporary observed temperature at 2 m (Xu et al., 2009) and precipitation (Xie et al., 2007) to confirm the ability of WRF model to simulate climatic characteristics across the study area. Then, for each item, the differences between the PT group and HS group were calculated. Since PT group and HS group were merely identified by surface spectrum albedo, differences between PT group and HS group indicated potential climatic effects caused by surface albedo changes associated with conversions from natural vegetation to cropland. To further test the confidence of such climatic effects, these climatic effects were compared to the WRF model′s noise range, which was represented by the maximum differences among the three runs of PT group. If the climatic effect exceeds the noise range of WRF model, the climatic effect would be considered to be significant; otherwise, it would be considered to be insignificant.
3
Fig. 4 Simulation domain (color region) and its surface elevation
Using the WRF simulated results, the seasonal mean of surface albedo, surface energy budget consisting of net radiation, sensible heat and latent heat, temperature at 2 m and precipitation were calculated. It is noted that the surface albedo which was analyzed in the following refers to blue-sky albedo for the entire shortwave band (0.3–5.0 µm) rather than the spectrum albedo (i.e. BSA-Vis, BSA-Inf, WSA-Vis and WSA-Inf). The surface albedo is the weighted mean of the above four spectrum albedos. The weights are the percentages of incoming spectrum radiation to total incoming solar radiation on the surface, which were derived from the CAM3 outputs under the clear sky in the PT experiment
Results
3.1 Land cover changes induced by agricultural development Figure 2b shows the grid cell-based historical natural vegetation distribution at the cell size of 60 km by 60 km. The total study area covers 348 grid cells, of which woodland accounts for approximately 58% (deciduous needleleaf forest: 9%; needleleaf-broadleaf mixed forest: 39%; deciduous broadleaf forest: 10%), grassland accounted for approximately 37% and wetland and water body accounted for approximately 5%. Through comparing spatial distributions of present cropland and historical natural vegetation, it is found that the grassland and wetland in the plain areas, such as the Sanjiang Plain, the Songnen Plain and the Liao River Plain, were mostly converted into cropland and woodlands in the lower mountain areas surrounding the central plain and eastern part of Yanshan Mountains were converted into cropland as well. It is estimated that approximately 60% of cropland was converted from grassland, approximately 33% was converted from woodland (deciduous broadleaf forests account for approximately 11% and needleleaf-broadleaf mixed forests account for approximately 22%) and the remaining 7% was converted
ZHANG Xuezhen et al. Agriculture Development-induced Surface Albedo Changes and Climatic Implications Across …
from wetland. 3.2 Ability of WRF model to simulate regional climate Figure 5 illustrates the simulated temperature at 2 m from PT group simulations and the observed temperature at 2 m from Xu et al. (2009) in winter (December– next February) and summer (June–August). Comparing with observations, the simulation had a Root Mean Square Error (RMSE) of 2.32℃ for the winter and 1.35℃ for the summer. As the simulations with other models, the cooling biases were dominant. However, the simulations could reproduce very well the general spatial variability of observed temperature. Quantitatively, the simulations and observations had a spatial correlation coefficient of 0.96 for winter and 0.93 for summer. For the spring (March–May) and autumn (September– November), the correlation coefficients are larger than 0.93 and smaller than 0.96. Figure 6 illustrates the simulated precipitation from PT group simulations and the observed precipitation from Xie et al. (2007) for summer, since summer is the rainy season. As the simulations with the other models, the simulated precipitation had large differences from observations. Comparing with observations, the simulated precipitation had a RMSE of 345 mm, which was equal with regional mean precipitation. The more precipitation biases were dominant. However, the simulations could reproduce the general spatial variations of observations as well. The simulations and observations
had a spatial correlation coefficient of 0.54. These comparisons demonstrate that WRF model could reproduce the seasonal cycle and spatial variation of temperature and precipitation across the northeastern China. 3.3 Changes in surface albedo and surface energy budget Figure 7 illustrates the changes in surface albedo and surface net radiation. It is found that surface albedo decreased by 0.01–0.02 in the plain areas due to conversion from grassland to cropland. The central plain mostly decreased by 0.01–0.03, with a maximum more than 0.03. In the Sanjiang Plain and the southeast area of Inner Mongolia, the decrease in surface albedo was mostly less than 0.01. The surface albedo increased in the surrounding mountain area due to conversion from woodland to cropland. The increase in surface albedo was mostly less than 0.01. As shown in Fig. 7, the absolute changes in surface albedo had little seasonal variation. However, relative changes in surface albedo varied with different seasons because absolute surface albedo had a pronounced seasonal cycle. The absolute surface albedo was higher in winter and lower in summer. Thus, the relative changes were larger in summer and less in winter. In central plain, the relative increase was approximately 11% for summer and approximately 8% for winter. Changes in surface albedo modified surface net ra-
Interval of contour lines is 2℃
Fig. 5
271
Simulation at 2 m and contemporary observtion of temperature in winter (a) and summer (b)
272
Chinese Geographical Science 2012 Vol. 22 No. 3
Interval of contour lines is 100 mm
Fig. 6
Simulated precipitation and contemporary observation in summer
diations. As shown in Fig. 7, surface net radiation changes spatially match with surface albedo changes in winter, as it is in spring and autumn. In the central plain, due to a decrease in surface albedo, the surface net radiation increased. The increases were mostly 4–8 W/m2 in spring, 1–3 W/m2 in winter and 2–5 W/m2 in autumn. In the Changbai Mountains and east part of Yanshan Mountain, due to increase in surface albedo, surface net radiation decreased. The amplitudes of decreases were mostly 1–2 W/m2 in spring and less than 1 W/m2 in
winter and autumn. In summer, the surface net radiation changes generally had similar spatial patterns with changes in surface albedo. The central plain had a decreased surface albedo and increased surface net radiation (2–5 W/m2), which was reversed for the Changbai Mountains areas. However, it is obvious that the domain where surface net radiation changes is much more extensive than the area where surface albedo changes. Further analysis indicated that such changes in surface net radiation resulted from changes in incoming solar radiation. It is suggested that the unmatched spatial patterns between the changes in surface albedo and surface net radiation is associated with cloud cover, since cloud cover uniquely determines the differences of incoming solar radiation between the two groups of simulation. Changes in surface net radiation modified the surface sensible heat flux and latent heat flux. However, the partition of changes in net radiation between both of the heat fluxes had pronounced seasonal variability (Fig. 8). In winter, sensible heat flux changes were pronounced, while the latent heat flux changes were too small to be detected. It is suggested that changes in net radiation mostly contributed to sensible heat. Although the latent heat changes were a little larger in the spring and autumn than in the winter, most of the changes in net radiation still contributed to sensible heat changes. Such features of the surface energy partition indicate a high Bowen ratio and have resulted from dry soil and thus less transpiration, since these seasons are non-rain seasons.
Interval of contour lines for surface albedo is 0.01
Fig. 7
Changes in surface albedo and in surface net radiation in winter (a) and summer (b)
ZHANG Xuezhen et al. Agriculture Development-induced Surface Albedo Changes and Climatic Implications Across …
In summer, the latent heat flux had large changes, since the summer is rainy season. It is indicated that surface has a lower Bowen ratio. However, there were complex spatial match relations between sensible heat and latent heat (Fig. 8b). Both of them increased in the Songnen Plain and decreased in the Changbai Mountains areas. Moreover, these changes in sign were consistent with surface net radiation. However, in the southern part of the central plain, the sensible heat had different changes signs from latent heat. The latent heat increased by 1–3 W/m2, while the sensible heat decreased by approximate 2 W/m2. Since latent heat is highly determined by surface moisture, the increased latent heat indicates a wetter land surface in the southern
part of the central plain. 3.4 Changes in temperature at 2 m and precipitation Figure 9 shows the changes in temperature at 2 m associated with surface albedo changes. In winter, the central plain was warmed. In spring and autumn, it was also warmed. The central plain was mostly warmed by more than 0.2℃ in winter and by 0.1℃–0.2℃ in spring and autumn. Moreover, such warming was significant because it exceeded the noise range of WRF model. Through comparing with Fig. 8, it is easily found that the warmed area spatially matched with area where sensible heat flux increased. It is suggested that the warm-
Interval of contour lines for sensible heat flux is 2 W/m2
Fig. 8
Changes in sensible heat flux and latent heat flux in winter (a) and summer (b)
Shading donates that changes are significant; interval of contour lines is 0.1℃
Fig. 9
273
Changes in daily mean temperature at 2m in winter (a) and summer (b)
274
Chinese Geographical Science 2012 Vol. 22 No. 3
ing climatic effects were directly derived from surface radiation forcing. In the Changbai Mountains, the sensible heat flux decreased, but the decrease was too minor to cause a detectable change in temperature at 2 m. In summer, there was a cooling effect in southeast of central plain and in the northeast corner of the Songnen Plain. The cooling was mostly more than 0.1℃ with the peak of about 0.3℃. However, such cooling effects did not exceed the WRF model′s noise range, because the temperatures from three simulations within PT group have large differences among with each other. Figure 10 shows the changes in summer precipitation and number of rainfall day (daily precipitation > 0.1 mm) associated with surface albedo changes. In the main body of the northeastern China, the precipitation increased averagely by approximately 10 mm; whereas, in the eastern part of the Yanshan Mountains and north of Xiao Hinggan Mountains, the precipitation decreased. The changes in number of rainfall day approximately had the similar spatial pattern with precipitation. In the main body of the northeastern China, rainfall days increased by 2–3 days. However, both of changes in precipitation and rainfall days did not exceed the WRF model′s noise range, because the simulations from the three experiments within PT group have also large differences among each other. It is suggested that these changes were insignificant.
4
Discussion
To perform numerical simulations using historical data,
it is critical to convert the scattered or political areabased data to geographically explicit grid data. According to the spatial domain information of historical records, we defined the spatial resolution of 60 km by 60 km. Such spatial resolution is a little coarse for the northeastern China and it is unrealistic to consider a grid cell to be covered by the same vegetation evenly. For instance, in the Songnen Plain, it is well known that there had been other scattered small area of wetland in addition to wetland identified by this study. However, as indicated by Zhang et al. (2011), essential historical records were too sparse to obtain higher resolution information and, in the precondition to ensure a reconstruction with lower uncertainty, the cell size of 60 km by 60 km was the highest resolution. In other words, the historical records were only able to provide the dominant vegetation types and had lower ability to identify the inner diversities of vegetation within a grid cell of 60 km by 60 km. To be adaptable with coarse spatial resolution, we adopted the coarse vegetation categories. As a result, the reconstruction could have high confidence level to express the macro pattern of historical nature vegetation distribution. Although PNV data has higher spatial resolution, it might uncertainly estimate the macro pattern of natural vegetation (Zhang et al., 2011). Therefore, we used the historical records-based reconstruction of natural vegetation, even though it has lower ability to express the differences of natural vegetation at higher spatial resolution. For such reason, this study only focused on the macro spatial pattern of land cover changes and associated surface albedo changes rather
Interval of contour lines is 10 mm and 1 day for rainfall and rainfall days respectively; shading donates that changes are significant.
Fig. 10
Changes in precipitation (a) and rainfall days (b) in summer
ZHANG Xuezhen et al. Agriculture Development-induced Surface Albedo Changes and Climatic Implications Across …
than analyzing the results at local (pixel) scale. Our simulations generally illustrated a warming climatic effect, which was different from the cooling effects of north hemisphere mean (Forster et al., 2007). Such differences were mainly derived from spatial variations of pre-agricultural natural vegetation. IPCC AR4 (Forster et al., 2007) summarized that the cropland was mainly converted from forests across the mid-high latitude of northern hemisphere and, as a result, surface albedo increased distinctly in both conditions of snow cover and snow-free. Finally, reduced surface net radiation and cooling climate effects occurred. In this study, the cropland was mainly converted from grassland. In the condition of snow cover, they have equivalent albedo which is snow cover albedo; whereas, in the freesnow condition, cropland had lower albedo than grassland. Finally, this study simulated an increased surface net radiation and a warming climate effect. Additionally, it is worthy to note that the simulated insignificant summer climatic effects have large uncertainties. National Research Council of the National Academies (2005) have pointed out that, beyond the direct radiation forcing, hydrology cycle variation triggered by surface radiation balance is another key process in which surface albedo changes impact climate. Our simulations also indicated that in the northeastern China the effects of surface albedo on summer climate are closely associated with hydrology processes, such as soil moisture, evapotranspiration, cloud condensation and rainfall. Unfortunately, it is well known that our understandings on the micro-physical process in the cloud and mechanism of rainfall are very poor and the parameterizations in the WRF model hence have large uncertainties. For this reason, the simulated rainy season climate from the three runs within the PT group had large differences among each other, which implicates a large noise range. To improve our assessment on summer climatic effects of surface albedo changes, more efforts would be needed in the future.
5
Conclusions
Through the analysis, it is concluded that surface albedo decreased and climate is warming in non-rain seasons hence occurred due to the human-induced conversion from grassland to cropland in the northeastern China over the last 300 years. The surface albedo decreased by
275
0.01–0.02, which was invariable with seasons. As a result, surface net radiation increased by 4–8 W/m2 in spring and by 1–3 W/m2 in winter and it is middle in autumn. In these non-rain seasons, due to less impact of cloud on incoming solar radiation, the increase in surface net radiation spatially matched well with surface albedo changes. Moreover, increase in surface net radiation was mostly balanced by increase in sensible heat while a little by latent heat, especially in winter. Finally, the central plain was mostly warmed by 0.1℃–0.2℃ in spring and autumn, and by 0.1℃–0.3℃ in winter. In the lower mountain areas around the central plain, there was conversion from forest to cropland and surface albedo increased by 0.005–0.015. The changes in albedo were too minor to result in a detectable climatic effect. In summer, a rainy season, surface albedo changes triggered cloud feedback which could influence incoming solar radiation. As a consequence, the changes in surface net radiation were unmatched spatially with surface albedo changes and they were not proportionate with each other. However, due to large uncertainty of parameterizations, such as micro-physical parameterization, the simulated summer climate is highly uncertain. Much more efforts would be needed to improve our understandings on summer climatic effects of surface albedo changes. These findings reconfirm the summaries from IPCC AR4 that climatic effects of changes in land surface properties vary with regions. The high spatial heterogeneity is a prominent feature which distinguishes climatic effects of land surface changes from the climatic effects of greenhouse gas. The later one has lower spatial variation. The feature of spatial variations highlights importance of regional study on climatic effects of changes in land surface. It is worthy noting that there were only two one-year simulations using historical natural vegetation and present land cover, respectively. It is hardly to express the climatic effects of dynamical cultivation during last the 300 years. So, it would be a potential direction to carry out consecutive 300-year simulation using the land cover changes due to dynamical agricultural development. Besides, only the climatic effects of surface albedo changes were analyzed in this paper. It will be as well as a potential direction to study the climatic effects of multiple geophysical parameters, such as leaf area index, fractional vegetation cover and so on.
276
Chinese Geographical Science 2012 Vol. 22 No. 3
References Bi Yuyun, Zheng Zhenya, 2000. The actual changes of cultivated area since the founding of new China. Resources Science, 22(2): 8–12. (in Chinese) Chen F, Dudhia J, 2001. Coupling an advanced land-surface/ hydrology model with the Penn State/NCAR MM5 modeling system. Part I: Model description and implementation. Monthly Weather Review, 129(4): 569–585. doi: 10.1175/1520-0493 (2001)129 2.0.CO;2 Collins W D, Rasch P J, Boville B A et al., 2004. Description of the NCAR Community Atmosphere Model (CAM 3.0). National Center for Atmospheric Research Technical Note NCAR/TN464+STR. Boulder, Colorado: National Center for Atmospheric Research. Foley J A, DeFries R, Asner G P et al., 2005. Global consequences of land use. Science, 309: 570–574. doi: 10.1126/ science.1111772 Forster P, Ramaswamy V, Artaxo P et al., 2007. Changes in atmospheric constituents and in radiative forcing. In Solomon S (eds.). Climate Change 2007: The Physical Science Basis. Cambridge: Cambridge University Press, 180–185. Fritz S, Bartholome E, Belward A et al., 2003. Harmonization, Mosaicking, and Production of the Global Land Cover 2000 Database. Ispra, Italy: Joint Research Center. Frolking S, Qiu Jianjun, Boles S, 2002. Combining remote sensing and ground census data to develop new maps of the distribution of rice agriculture in China. Global Biogeochemical Cycles, 16(4): 1091. doi: 10.1029/2001GB001425 Fu C, 2003. Potential impacts of human-induced land cover change on East Asia monsoon. Global and Planetary Change, 37(3–4): 219–229. doi: 10.1016/S0921-8181(02)00207-2 Gao F, Schaaf C B, Strahler A H et al., 2005. MODIS bidirectional reflectance distribution function and albedo Climate Modeling Grid products and the variability of albedo for major global vegetation types. Journal of Geophysical Research, 110: D01104. doi: 10.1029/2004JD005190 Giri C, Zhu Z L, Reed B, 2005. A comparative analysis of the Global Land Cover 2000 and MODIS land cover data sets. Remote Sensing of Environment, 94(1): 123–132. doi: 10.1016/ j.rse.2004.09.005 Grell G A, Devenyi D, 2002. A generalized approach to parameterizing convection combining ensemble and data assimilation techniques. Geophysical Research Letters, 29(14): 1693. doi: 10.1029/2002GL015311 Hong S Y, Dudhia J, Chen S H, 2004. A revised approach to ice microphysical processes for the bulk parameterization of clouds and precipitation. Monthly Weather Review, 132(1): 103–120. doi: 10.1175/1520-0493(2004)132 2.0.CO;2 Hong S Y, Pan H L, 1996. Nonlocal boundary layer vertical diffusion in a medium-range forecast model. Monthly Weather Review, 124(10): 2322–2339. doi: 10.1175/1520-0493(1996)124
2.0.CO;2 Institute of Soil Science, Chinese Academy of Sciences, 1978. Soil Map of China. Beijing: Sino Map Press. (in Chinese) IGBP (International Geosphere-Biosphere Programme), 2009. PAGES Science Plan and Implementation Strategy. Report 57. Stockholm: IGBP Secretariat. Jing Ai, 1987. The spatial distribution and variations of agriculture over the Northeast China in the history time. Journal of Chinese Historical Geography, (2): 95–119. (in Chinese) Küchler A W, 1964. Potential natural vegetation of the conterminous United States. In: American Geographical Society (ed.). Special Publication No. 36. New York. Li Tianjie, Zhao Ye, Zhang Keli, 2004. Soil Geography. Beijing: Higher Education Press. (in Chinese) Liang S, Fang H, Chen M et al., 2002. Validating MODIS land surface reflectance and albedo products: Methods and preliminary results. Remote Sensing of Environment, 83(1–2): 149– 162. doi: 10.1016/S0034-4257(02)00092-5 Lucht W, Schaaf C B, Strahler A H, 2000. An algorithm for the retrieval of albedo from space using semiempirical BRDF models. IEEE Transactions on Geoscience and Remote Sensing, 38(2): 977–998. doi: 10.1109/36.841980 Mahmood R, Pielke Sr. R A, Hubbard K G et al., 2010. Impacts of land use/land cover change on climate and future research priorities. Bulletin of the American Meteorological Society, 91(1): 37–46. doi: 10.1175/2009BAMS2769.1 Myhre G, Kvalevåg M M, Schaaf C B, 2005. Radiative forcing due to anthropogenic vegetation change based on MODIS surface albedo data. Geophysical Research Letters, 32: L21410. doi: 10.1029/2005GL024004 National Research Council of the National Academies, 2005. Radiative Forcing of Climate Change: Expanding the Concept and Addressing Uncertainties. Washington D.C.: The National Academies Press. Pielke Sr R A, Marland G., Betts R A et al., 2002. The influence of land-use change and landscape dynamics on the climate system: relevance to climate-change policy beyond the radiative effect of greenhouse gases. Philosophical Transactions of the Royal Society A, 360: 1705–1719. doi: 10.1098/rsta.2002. 1027 Ramankutty N, Foley J A, 1999. Estimating historical changes in global land cover: Croplands from 1700 to 1992. Global Biogeochemical Cycles. 13(4): 997–1027. doi: 10.1029/1999GB 900046 Salomon J, Schaaf C B, Strahler A H et al., 2006. Validation of the MODIS Bidirectional Reflectance Distribution Function and Albedo Retrievals using combined observations from the aqua and terra platforms. IEEE Transactions on Geoscience and Remote Sensing, 44(6): 1555−1565. doi: 10.1109/TGRS. 2006.871564 Schaaf C B, Gao F, Strahler A H et al., 2002. First operational BRDF albedo nadir reflectance products from MODIS. Remote sensing of Environment, 83(1–2): 135–148. doi: 10.1016/
ZHANG Xuezhen et al. Agriculture Development-induced Surface Albedo Changes and Climatic Implications Across … S0034-4257(02)00091-3 Wang Kaicun, Liu Jingmiao, Zhou Xiuji et al., 2004. Retrieval of the surface albedo under clear sky over China and its characteristics analysis by using MODIS satellite date. Chinese Journal of Atmospheric Sciences, 28(6): 941–952. (in Chinese) Xie P, Chen M, Yatagai A et al., 2007. A gauge based analysis of daily precipitation over East Asia. Journal of Hydrometeorology, 8(3): 607–626. doi: 10.1175/JHM583.1 Xu Y, Gao X J, Shen Y et al., 2009. A daily temperature dataset over China and its application in validating a RCM simulation. Advances in Atmospheric Sciences, 26(4): 763–772. doi: 10.1007/s00376-009-9029-z Ye Y, Fang X, Ren Y et al., 2009. Cropland cover change in Northeast China during the past 300 years. Science China
277
(Earth Sciences), 52(8): 1172–1182. doi: 10.1007/s11430-0090118-8 Ye Yu, Fang Xiuqi, Dai Yujuan et al., 2006. Calibration of cropland data and reconstruction of rate of reclamation in Northeast China during the period of Republic of China. Progress in Natural Science, 16(11): 1419–1427. (in Chinese) Yi Baozhong, 1994. Historical clues on agricultural development in the Northeast China. Chinese Agricultural History, 13(1): 66–71. (in Chinese) Zhang Xuezhen, Wang Weiqiang, Fang Xiuqi et al., 2011. Natural vegetation pattern over Northeast China in late 17th century. Scientia Geographica Sinica, 31(2): 184–189. (in Chinese) Zhou Lin, 1991. Climate in the Northeast China. Beijing: Meteorological Press. (in Chinese)