different kinds of CS over the course of successive condit- ioning trials in which the CSs were paired with an alcohol. US. The experiment was designed to model ...
Psychopharmacology (1994) 116:360-368
Psychopharmacology © Springer-Verlag 1994
Alcohol as an unconditioned stimulus in human classical conditioning Steven Glautier 1, Colin Drummond 1, Bob Remington z ~Addiction Research Unit, National Addiction Centre, Institute of Psychiatry, 4, Windsor Walk, London, SE5 8AF, UK 2Department of Psychology, University of Southampton, Highfield, Southampton, $09 5NH, UK Received: 18 October 1993 Final version: 25 January 1994
Abstract. Recent experiments with human subjects have shown that drug cues (e.g. sight of beer or needle and syringe) elicit different responses than do neutral stimuli. However, because conditioning has not been carried out in the majority of cases, it is not clear why drug cues have different response eliciting capacities; associative and nonassociative mechanisms may both play a part. In this experiment a counterbalanced differential conditioning procedure was used to isolate the role of associative processes in the development of physiological, behavioural, and subjective conditioned responses to cues for alcohol over the course of repeated conditioning sessions. Twelve healthy volunteers took part in the experiment which involved each subject attending for ten sessions. On physiological measures evidence was found for conditioning of skin conductance and cardiac inter-beat interval responses to cues for alcohol delivery. Over the course of conditioning on behavioural measures of drink consumption there were changes in the rate of consumption and number of sips taken as a function of whether or not the drinks contained alcohol. Finally, on subjective measures, there was a differential change in subjective state in response to alcohol and soft drink expectancy as conditioning progressed. Keywords: Alcohol cues - Drug cues - Physiological responses - Conditioning - Drug like - Drug withdrawal like - Drug opposite
Classical conditioning is the fundamental learning process by which organisms adapt to the relationships between events in their environments. In a typical conditioning experiment an innocuous stimulus is recurrently paired with a more potent unconditioned stimulus (US) and, as a consequence of this pairing, the innocuous stimulus acquires new response eliciting capacities and is termed The work was supported by programme grant No. 7400 from the Medical Research Council Correspondence to." S. Glautier
a conditioned stimulus (CS). For example, in an experiment using dogs, a ticking metronome can be repeatedly paired with food delivery and, after such pairing, the sound of the metronome elicits new responses from the dog, including salivation (Pavlov 1927). These new responses are collectively termed conditioned responses (CRs). Because of similarities between the sequence of events in conditioning experiments and in drug taking situations, there is a great deal of current interest in the role of classical conditioning in drug taking behaviour (see Niaura et al. 1988; D r u m m o n d et al. 1990 and Powell et al. 1990 tbr recent reviews). To elaborate using alcohol consumption as an example; over the course of repeated drinking episodes various relatively innocuous stimuli (e.g. the sight and smell of beer) are paired with alcohol ingestion which is a potent US. As a result of this contingency these relatively innocuous stimuli are likely to acquire CS properties. The main theoretical models of the role of CSs in the regulation of drug taking all suggest that the presence of drug CSs will elicit CRs which increase the likelihood of drug use (Wikler and Frank 1948; Siegel 1989 and Stewart et al. 1984). The models differ, however, in terms of the mechanism by which the CR exerts its effects. These conditioning models provide a framework within which it is possible to try to understand and investigate the role of drug CSs in the regulation of drug intake and, in the case of problematic drug use, provide a means of approaching the serious problem of relapse after a period of abstinence. In particular, since repeated presentation of a CS without the US results in extinction of CRs, a theoretical basis for investigating cue exposure treatment procedures can be developed. As yet, cue exposure treatment approaches have met with mixed results. Dawe et al. (1993) and McLellan et al. (1986) found no benefit of cue exposure in opiate addicts, nor did Raw and Russell (1980) when they treated smokers. However, Rankin et al. (1983) and Drummond and Glautier (1994) found that alcoholic patients showed some benefits from the cue exposure approach. As another means of investigating the role of drug CSs in drug taking, laboratory experiments have been geared to studying subjective, physiological and behavioural
361 responses to different kinds of drug cue (see reviews, op. cit.). Presentation of stimuli which have been associated with drug taking has been found to result in different responses when the responses are compared with those elicited by stimuli which do not share the same history of association with drug use. However, the majority of studies have been opportunistic, relying on subjects' extraexperimental conditioning histories, rather than actually conditioning subjects. The reasons for this include the fact that opportunistic studies, especially involving patient populations, are much easier to carry out. Subjects may only have to attend one or two sessions and ethical difficulties associated with giving drugs to patients can be avoided. However, even though it is much easier to carry out opportunistic studies, they have the serious flaw that it is impossible to be sure why different cues elicit different responses. F o r instance, in one recent study, alcoholic patients had higher skin conductance (SC) levels and reported more feelings of tension and desire to drink in the presence of alcoholic than soft drinks (Gtautier and D r u m m o n d 1994). While the alcoholic and soft drink cue undoubtedly had different conditioning histories they may well have had other differences and these may have accounted for the different responses. As an example, it is possible that soft and alcoholic drink cues have different unconditioned properties and others have already found that it is desirable to control for this possibility. McCaul et al. (1989) found that differences in "stimulus intensity" (pepper juice versus water) could result in different physiological responses. Robbins and Ehrman (1992) have suggested various ways to improve the design of these opportunistic studies in order to minimise the difficulties with the interpretation of results but, as they point out, it is clear that the only way to be sure that responses elicited by different drink cues are conditioned responses is to actually carry out a carefully designed conditioning experiment. Conditioning experiments using h u m a n subjects, in which responses are studied before, during and after conditioning would provide the most cogent demonstrations of drug conditioning and would add considerably to the strength of the present drug conditioning database. The objective of the present experiment was to study subjective, physiological and behavioural responses to different kinds of CS over the course of successive conditioning trials in which the CSs were paired with an alcohol US. The experiment was designed to model the kinds of conditioning taking place when alcohol is consumed in order to further our understanding of processes likely to play a part in the development and maintenance of problematic drinking. While the primary focus of the experiment was on the development of CRs to different (visual and gustatory) CSs, it was also possible to study the role of alcohol expectancy. It was thought important to explore the likelihood that different CSs might be preferentially associated with the alcohol US because responses to visual CSs which occur before drug taking begins must be at the heart of any conditioning model of the initiation of drug taking. However, there were three potential reasons for suspecting that visual CSs might not support conditioning as well as gustatory CSs; (a) differences in their
salience, (b) differences in their associability with drug effects and (c) differences in their temporal relationships with drug effects. The distinction between visual and gustatory CSs was also drawn in an attempt to follow up the results of an earlier experiment in our laboratory in which the manner of presentation of the drink cue affected physiological and subjective responses to the cue (Glautier et al. 1992b). In that experiment subjects were asked to either drink or hold drinks which had different histories of association with alcohol. It was found that holding and drinking alcohol associated drinks led to different responses. However, there were several possible explanations for this including unconditioned differences between the drink cues used (it was an opportunistic study) and differences in subject's beliefs about the likelihood of alcohol ingestion (holders would not be expecting alcohol). In the current experiment, subjects were conditioned and their responses to the presentation of drinks were studied over the course of conditioning when subjects fully expected to consume the drinks. After conditioning, responses to the presentation of drinks were examined when subjects had been told they would only be holding the drinks, as opposed to actually drinking them. As well as allowing the study of responses to drink cues plus and minus alcohol expectancy, this procedure provided a conditioning experiment parallel to the m a n y opportunistic studies which have studied responses to subjects holding, rather then actually drinking drinks.
Materials and methods
Design There were two parts to the experiment. In the first part, the "conditioning phase", a differential conditioning procedure was carried out in which different drinks were trained as CS + and CS - . In the second part, the "hold test phase", subjects merely held CS + and CS - drinks. Physiological, behavioural and subjective responses to CS + and CS - were of interest during both parts. During conditioning and holding all factors were within subject and the following counterbalancing and randomisation was carried out. Half of the subjects were randomly assigned to be conditioned with a red angostura drink as cue for alcohol (CS + = ANG) whereas the other half were trained with an alcoholic blue peppermint drink as cue for alcohol (CS + = PEP). Subjects trained with the red angostura mixture as CS + were trained with a blue peppermint drink as soft drink cue (CS - ) whereas those trained with the blue peppermint mixture as CS + were trained with a red angostura drink as C S - . There were 2 hold test days and subjects were presented with CS + on the first or second day. Thus, there were four possible conditioning cue/hold test order combinations (2 x 2) and three replicates of this basic design were conducted, using 12 subjects in all. The eight conditioning sessions (four CS + and four CS - ) were carried out on separate days and a conditioning block was defined as the presentation, on successive experimental sessions, of a CS - and CS + drink. This left four conditioning blocks, each of which had two possible orders; CS + drink on day 1 of the block and CS - drink on day 2 (A) or vice versa (B). Four block/order sequences were used (ABAB, BABA, ABBA or BAAB) and each cell of the basic 2 x 2 design (described above) was combined with one of these sequences for all three replicates. The design is illustrated in Table 1.
362 Table 1. Design of the experiment. Three replicates of this design were conducted. ANG = angostura trained as CS + ; PEP, peppermint trained as CS + ; A, alcohol presented on first day of conditioning block; B, alcohol presented on second day of conditioning block
CS + drink
ANG
ANG
PEP
PEP
Hold test order Conditioning pattern
CS+ ~CSABBA
CS- ~CS+ BAAB
CS+ -~CSABAB
CS- ~CS+ BABA
Table 2. Subject characteristics. EPQ scores on psychoticism (P), extraversion (E), neuroticism (N) and lie (L) scales. Alcohol consumption in weekly units (one unit = 8 g ethanol)
N=12
Age
Weekly units
EPQP
EPQE
EPQN
EPQL
Mean Range Std
30.3 20-46 7.7
24.6 8-48 14.5
5.7 1-12 2.9
12.7 5-19 5.9
10.8 3-17 4.3
5.5 1-12 3.8
Subjects
Questionnaires
Twelve mate subjects were recruited from the staff and students of the Maudsley Hospital, Institute of Psychiatry and local population by posted notices and personal solicitation. Summary data for the subjects' age, weekly alcohol consumption and scores on the Eysenck Personality Questionnaire (EPQ; Eysenck and Eysenck 1975) are given in Table 2. None reported a history of alcoholrelated problems, was suffering from serious physical illness, or was taking medication at the time of the experiment. Subjects were paid £100 each for their participation. All subjects gave written informed consent to participate in the study, which was approved by the hospital Ethics Committee.
Subjects completed a short drinking habits questionnaire, which asked about quantity and frequency of alcohol consumption, and the EPQ on the first of their experimental sessions. During sessions, before and after consuming drinks, subjects completed a mood questionnaire to report their subjective state in the three dimensions of pleasure, arousal and dominance (Mehrabian and Russell 1974). After consumption of drinks subjects rated their intoxication on a 150 mm visual analogue scale with poles labelled "Not at all intoxicated" and "Very intoxicated".
Physiology and drinking behaviour Setting The experiment was conducted in a sound-insulated psychophysiological recording room. Subjects sat in a comfortable chair beside a table upon which drinks and questionnaires for the session were laid out. They were observed through a one-way mirror by the experimenter from an adjacent room housing physiological recording apparatus and computer. The subject wore headphones throughout the experiment so that the experimenter was able to ~ve instructions at appropriate times during the sessions.
Drinks Two alcoholic drinks (9.4% alcohol) were used; one was a red angostura mixture and one was a blue peppermint mixture. Each alcoholic drink had a carefully matched placebo version so that with a total of four drinks (red angostura soft/blue peppermint soft plus the two alcoholic drinks), it was possible to ensure that different flavours and colours served different CS functions (CS + and CS - ) for different subjects. The exact formulation and method of designing these drinks was described in detail by Glautier et al. (1992a). The alcoholic drinks were those described; the angostura CS - was drink A4 and the peppermint CS - was drink B6. The dose of alcohol used was 0.6 g/kg and CS - drinks were of the same volume as the alcoholic drink. All drinks were administered as two separate portions presented in plastic glasses which were hidden under opaque containers on a table beside subjects until appropriate times during the sessions. Whenever a CS - drink was presented, a piece of tissue soaked in 2 ml vodka was tapped under the opaque container in order to provide a smell of alcohol. The purpose was to ensure conditioning would occur to visual and/or taste rather than olfactory cues.
Skin conductance, cardiac inter-beat interval (IBI) and finger pulse volume (FPV) were recorded. The equipment for physiological recording consisted of the following; (a) SC4 skin conductance meter, (b) HR heart rate meter, (c) PTI finger plethysmograph, (d) MCI/I computer interface and (e) PSV1 power supply all made by Contact Precision Instruments Ltd. This equipment allowed digital recording of physiological signals and direct storage of the signal onto computer disc. All data acquisition and analysis was done using IBM compatible computers. The statistical analyses were carried out using either version 3 or 4.01 of SPSSPC. Silver/silver chloride electrodes were used in conjunction with double stick electrode collars for SC recording, both were from Med Associates Inc. A computer program, written in Pascal, was used to record each sip subjects took of their drinks during training and testing. Each sip was recorded by a key press and the program timed the point at which the subject was instructed to begin drinking, the point at which each sip was taken, and the time the subject finished the drink. The program then calculated summary statistics based on these data (sip count, average sip volume, latency to begin drinking following instruction, and rate of consumption). Finally, breath alcohol level was measured following consumption of alcoholic drinks using a Lion SD-2 Alcometer. The purpose of measuring breath alcohol was twofold. Firstly, it served as a prop to help convince subjects that this was a focus of interest in the experiments. It was considered important that subjects did not know that their responses to the presentation of drinks was being studied. Secondly, breath alcohol was used to actually index the blood alcohol levels.
Procedure On initial contact, usually by telephone, subjects were told that the experiment was an investigation into the development of tolerance to the physiological and subjective effects of alcohol involving ten sessions each lasting about 1 h. Subjects were screened to ensure
363 they met the study entry criteria and given the following information about the experiment. They were told they would receive alcohol on half of the sessions and soft drink on other days but that they would not know what they were to get in advance. They were told that the dose of alcohol would be approximately equivalent to two pints of beer and because it would be consumed quickly that it was likely to make them intoxicated. Therefore they were advised that they should not plan to drive a car for the rest of the day or undertake any activity which might be dangerous if they were impaired. In addition, subjects were asked not to eat or drink for 2 h before the sessions, not to smoke for 1 h before sessions, told that the?' would be paid £100 on completion of the study and the first appointment was made.
that they would be asked to "act out drinking" for 10 min (picking up, looking at and lifting the glass to their lips repeatedly). Four minutes into the recording the first container was lifted, 6 rain into recording subjects took a small sip of the drink and 8 rain into the recording the first hold instruction was issued. Four hold instructions were then repeated at 2-rain intervals before subjects were instructed to place the container back over the drink. The session then proceded in exactly the same way as on conditioning days with subjects consuming a second drink. The consumption of the second drink was timed and constituted the drinking speed test. The second drink (drinking speed test drink) was always the alcohol associated drink on days 9 and 10. The first drink was CS + on one of the days and CS - on the other as per the design.
Conditioning phase
Data analysis' and reduction
On arrival on day 1, the rationale and description of the experiment was restated. Subjects signed a consent form, were weighed and asked to complete the drinking habits and EPQ intake questionnaires. The laboratory was prepared while subjects filled out these questionnaires. This involved setting out mood and intoxication questionnaires, and mixing and pouring of drinks. Subjects were then escorted to the laboratory to begin the first session. On all subsequent days, preparations were made before subjects arrived so that they could be escorted directly to the laboratory. Once in the laboratory subjects were asked to wash their hands before being seated and breathalysed. They were then connected to recording apparatus and told to expect either a red angostura (or blue peppermint) alcoholic drink or a blue peppermint (or red angostura) soft drink as appropriate for the session. On day 1 details of procedures were read to subjects verbatim so that subjects knew what to expect and to ensure standardisation between subjects. A full copy of these, including those used on hold test days, is available upon request. The experimenter then left the subject room. After 5 rain subjects completed the first mood questionnaire, after 12 min a 6-min physiological recording began. Two minutes into the recording subjects lifted one of the opaque containers revealing the first drink, 2 min after that subjects took a small sip of the drink and 2 rain later subjects were told to consume the drink within a 10-rain period. If a subject had not finished the drink after 10 min they were asked to do so. Five minutes after finishing the drink subjects completed another mood questionnaire following which the same procedures were repeated for the second drink. Five minutes after finishing the second drink subjects completed the third mood questionnaire and intoxication rating scale. If alcohol had been given subjects were disconnected and breathalysed again after 15 min, otherwise they were disconnected and the session was terminated immediately. Before breath was sampled, subjects rinsed their mouths with water to remove any traces of alcohol still in the mouth.
Data from the conditioning phase of the experiment were analysed as follows. Physiological data relating to the first drink were reduced by averaging over each of the first (baseline), third (sight cue alone), and 5th rain (sight cue plus taste cue) of the recording on each training day. To test the hypothesis that conditioning occurred change scores were obtained by subtracting baseline values from the 3rd and 5th min and entering them into 2 (CS + versus CS - ) x 2 (block 1 versus block 4) x 2 (sight versus sight plus taste) analyses of covariance (ANCOVAs) using first minute values as covariates of the change score. The purpose of using ANCOVA in this way was to remove any variation in change scores arising from variation in baseline level. Conditioning effects were also tested for by evaluating trends across time in response to CS + and CS - by fitting polynomial contrasts across levels of B L O C K for sight and sight plus taste data separately. Again ANCOVA was used in assessing these contrasts. Next, in order to test the effects of a conditioning history on alcohol expectancy (CS + versus CS - days), analyses of baseline levels on physiological and subjective data during the conditioning phase were undertaken by fitting polynomial contrasts across levels of BLOCK in 2 ( C S + versus C S - ) x 4 (block 1-4) ANOVAs. Finally, behavioural responses to CS + and C S drinks were studied using 2 (CS + versus CS - ) x 4 (block 1-4) analyses of variance (ANOVAs). Rate of consumption, latency to begin drinking following instruction and sip count were analysed by fitting polynomial contrasts across levels of BLOCK. In these analyses C S x B L O C K interactions indicate the presence of conditioning. During the hold phase of the experiment physiological data were reduced by averaging over each of the 1st (baseline), 5th (sight cue alone), 7th (sight cue plus taste cue), 9th, llth, 13th and 15th (alternate minute during the hold procedure) rain of the recording. Change scores were obtained by subtracting baseline measures before carrying out 2 (CS + versus C S - ) x 6 (time points) ANCOVAs using baseline values as covariates of the change scores. Subjective effects of holding CS + and CS - drinks were assessed by comparing changes in scores between mood questionnaires one and two (baseline and immediately after holding) using the scores obtained in the baseline period as covariates. The effects of holding CS + and CS - drinks on subsequent consumption (rate of consumption, number of sips and latency to first sip) and intoxicating effects (mood questionnaire, intoxication ratings and breath alcohol levels) of the alcoholic drinking speed test drink were also assessed. Subjective effects, as measured by change in mood between questionnaire 1 and 3 (baseline and 5 rain after finishing the drink) were compared on CS + and CS - days using baseline subjective state as covariates whereas intoxication ratings and breath alcohol level on different days had rate of consumption as covariates.
HoM phase Initial procedures on days 9 and 10 were the same as on previous days. At the point at which the experimenter normally told the subjects which drink to expect in the session, the subjects were told that a "movement control" procedure was going to be used for some subjects. In actual fact, all subjects were going to go through the procedure and the experimenter went on to explain in detail what it involved. On the first of the test sessions instructions were read verbatim to subjects, the experimenter then left the recording room. At the 12-min point a 16-rain physiological recording began. Two minutes into the recording the experimenter announced "You are going to be in the hold condition". The experimenter had previously explained to subjects that they would be in either the "hold" or "drink" condition. Thus, up until the announcement, subjects were uncertain about what condition they would be in. Subjects had been told that if they were in the drink condition that the session would proceed as usual but that if they were in the hold condition that they would not be drinking the first drink. Instead they were told
Results T h e effects of a l c o h o l a s s o c i a t i o n (CS + or C S - ), c o n d i t i o n i n g b l o c k (1-4), t i m e w i t h i n e x p e r i m e n t a l sessions a n d
364 ~C change (micromhos)
sensory modality of drink cue (sight or sight plus taste) are denoted by CS, B L O C K , T I M E and M O D A L I T Y , respectively, and interactions by "x'. Where the response to the sight cues accompanying the drink are referred to a symbol (s) is used, where the response to the sight plus taste cues is referred to a symbol (t) is used. One subject was dropped from the analysis of hold data because he was given the wrong drinks on the final day (blue peppermint CS - instead of red angostura CS - ).
v, %%.
"zX
Conditioningphase
O 1
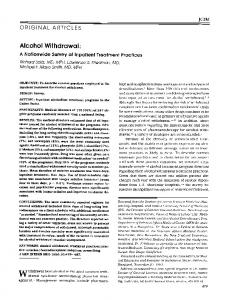
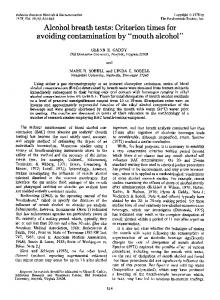
During the conditioning phase of the experiment, evidence was found for conditioning of physiological responses to initial sight and sight plus taste cues for alcohol delivery on SC but for IBI, evidence for conditioning to the sight plus taste cues for alcohol was absent. For FPV, however, there were no clear signs of conditioning to either sight or the sight plus taste cues for alcohol. The SC and IBI data is illustrated in Figs l a and b, respectively. On SC the initial responses (block one) to CS + (filled symbols) and CS - (empty symbols) were different to the final responses (block four). On block one CS - resulted in a larger response than CS + and vice versa on block four. These graphical impressions have statistical support. The 2 (CS + versus CS - ) x 2 (block 1 versus block 4) x 2 (sight versus sight plus taste) A N C O V A gave the following results. There was a C S × B L O C K interaction IF(l,10) = 6.24, P = 0.032] indicating conditioning and this interaction was explored further by separately comparing responses to sight and sight plus taste CS + and CS - on blocks one and four, again using ANCOVA. On block one the response to CS - (s) was almost higher than the response to CS + (s), but responses to CS - (t) were not larger than responses to CS + (t) [ F ( 1 , t 0 ) = 4.30, P = 0.065; F(1,10)= 2.60, P = 0.138, respectively]. In contrast, on Nock four, the response to CS + - s) was higher than the response to C S - (s), and CS + (t) was almost larger than CS - (t) [F(1,10) = 18.93, P = 0.001; F(1,10) = 4.38, P -- 0.064, respectively. On IBI, the initial responses (block one) to CS + (s) and CS - (s) were different to the final responses (block four) but this was not the case for CS + (t) and CS - (t). On block one CS + (s) resulted in a smaller IB! response than did CS - (s), and vice versa on block four. However, for CS + (t) the response was larger than the response to CS - (t) on block one and continued to be so on block four. Again these graphical impressions have statistical support. A 2 (CS + versus C S - )× 2 (block 1 versus block 4) x 2 (sight versus sight plus taste) A N C O V A gave the following result. There was a significant CS x B L O C K x M O D A L I T Y interaction [F(1,11) = 4.95, P = 0.048] which was given overall precedence in the interpretation of these data. The interaction was explored further by separately comparing responses to sight and sight plus gustatory CS + (s) and CS - (s) on blocks one and four, again using ANCOVA. On block one, IBI change in response to CS - (s) was almost larger than the response to CS + (s) [F(I,10) = 3.76~ P = 0.081] but the response to C S - (t) was not significantly different to CS 4 (t) [ F ( 1 , t 0 ) = 1.12, P =0.315]. In contrast, on
2
3
a
4
Block t0
31 change (millLsecs)
0 -t0 -20 -30 -40
-5oi
/23
C3.....4~Q
-60 -70 -80 -90 b
I
i
i
i
1
2
3
4
Block
Fig. la,b. Conditioning on SC and IBI. SC and IBI changes in response to the sight and sight plus taste o f C S + and CS -- drinks across conditioning blocks. - - • , CS + sight; - - zk ---, C S - sight; - - I I - - , CS + taste; - [ ] - , C S - taste
block four, the response to CS + (s) was almost larger than the response to CS - (s) [F(1,10) = 3.70, P = 0.083], whereas again response to CS - (t) was not significantly different to the response to CS + (t) I F ( l , 1 0 ) = 2.96, P = 0.116]. There were no CS x B L O C K or CS x B L O C K x M O D A L I T Y interactions on FPV [Fs < 1]. Table 3 shows the results of A N C O V A s in which polynomial contrasts were fitted across levels of block for sight and sight plus taste responses on SC and IBI. F o r SC, there was a significant CS x B L O C K interaction on linear and cubic trends on the sight and sight plus taste responses and this is further evidence of conditioning. However, Roy-Bargmann stepdown F-tests, which assess higher order trends (quadratic and cubic) while controlling for lower order trends, resulted in a loss of significance for the CS(s) x B L O C K and CS(t) x B L O C K cubic trends IF(l,6) = 3.27, P = 0.121; F(1,6) = 4.49, P = 0.078, respectively]. There was no linear trend across blocks on CS + (s) considered alone but the linear trend across blocks for CS - (s) was highly significant IF(l,8) = t.25, P = 0.296; F(1,8) = 13.67, P = 0.006, respectively]. A similar pattern held when taste responses were considered. There was no linear trend for CS + (t) responses but a highly significant trend for C S - ( t ) responses [F(1,8)