Alert Detection in System Logs Adam J. Oliner∗, Alex Aiken Stanford University Stanford, CA 94305-9025 USA {oliner,aiken}@cs.stanford.edu
Abstract We present Nodeinfo, an unsupervised algorithm for anomaly detection in system logs. We demonstrate Nodeinfo’s effectiveness on data from four of the world’s most powerful supercomputers: using logs representing over 746 million processor-hours, in which anomalous events called alerts were manually tagged for scoring, we aim to automatically identify the regions of the log containing those alerts. We formalize the alert detection task in these terms, describe how Nodeinfo uses the information entropy of message terms to identify alerts, and present an online version of this algorithm, which is now in production use. This is the first work to investigate alert detection on (several) publicly-available supercomputer system logs, thereby providing a reproducible performance baseline.
1
Introduction
For a large production computer system, like a supercomputer, unscheduled downtime carries a huge cost: the equipment and personnel required to find and fix the causes of downtime are a major contributor to the total cost of owning such a system. The data that these systems generate, typically in the form of system logs, are the primary avenue by which system administrators gain insight into the behavior of production systems. There is an increasing need for better tools for wading through the plethora of data that large systems generate. In particular, logs are used to detect and localize faults. The manifestation of a fault in the log is an alert; every line in a log has an associated alert category, which may be null. Lines with a non-null alert category (henceforth alerts) are messages that merit the attention of a system administrator, ∗ Work was funded in part by the U.S. Department of Energy High Performance Computer Science Fellowship. † Sandia is a multiprogram laboratory operated by Sandia Corporation, a Lockheed Martin Company, for the United States Department of Energy under Contract DE-AC04-94AL85000.
Jon Stearley Sandia National Laboratories† Albuquerque, NM 87111 USA
[email protected]
either because immediate action must be taken or because there is an indication of an underlying problem. Many alerts may be symptomatic of the same failure. Failures may be anything from a major filesystem malfunction to a transient connection loss that kills a job (see Oliner [8] for examples). The task of alert detection is to automatically separate both new and known alerts from innocuous messages (noise). In this paper, we formalize the alert detection task and propose a metric called binary scoring that we found to appropriately quantify operational value (Section 3). We then present Nodeinfo, an unsupervised alert detection algorithm that considers the information entropy of message terms (Section 4). Nodeinfo may be applied to any timestamped and tokenizable text log, it requires no system-specific information. Using nearly 750 million supercomputer log messages (81 GB) from a public data repository [8], we demonstrate Nodeinfo’s effectiveness on four separate systems (Sections 5 and 6). The analysis gives us deeper insight into the logs that even months of prior study did not provide. First, we identify and confirm ten new alert categories, yielding new alert messages on all four systems (Section 5.1). Second, we observe that similar computers, correctly executing similar workloads, tend to generate similar logs (Section 5.3), and demonstrate how statistical algorithms can exploit this fact to obtain substantial performance improvements (Section 6). Specifically, our algorithm ultimately achieves up to seven times baseline performance on some workloads. Nodeinfo is currently in production use on at least three supercomputers. The data sets and code are public [13, 14], so the results in this paper are verifiable and reproducible; this work provides a performance baseline for alert detection. These first steps have already improved the system administration task for the machines under study, and we are confident that further efforts will be similarly rewarded.
2
Related Work
System logs are generally readily available and often contain critical clues to causes of failure, so many tech-
niques for detecting alerts in logs have been proposed. Most prior works focus on logs with dependable structure (easily tokenizeable into message-type-ID’s), and identify alerts according to a severity field. These attempts include pattern-learning [2], data mining techniques to discover trends and correlations [7, 12, 17, 19], and message timing [4]. However, system logs are notoriously unstructured and “severity” is not a dependable alert indicator [8]. Less work has been done in the area of unstructured message content. Attempts to apply techniques from genomic sequence mining to logs [12, 18] have run up against scaling problems. Vaarandi has applied clustering [16] and Apriori data mining [17], and was the first to encode word positions in his analyses (e.g., the first word of the message, the second, etc.), thereby effectively capturing a simple form of message context. This paper extends the understanding of how valuable such position encoding can be. Reuning [9] and Liao [5] have each applied simple term weighting schemes to intrusion detection in logs, but Reuning concludes that his false positive rate renders the approach unusable in practice. We apply the more complex “log.entropy” weighting scheme that has been shown to be highly effective for information retrieval tasks [1]. Schroeder and Gibson conduct a long-term study of faults on clusters at Los Alamos National Labs [11]. They use a remedy database, a data set of failures (no noise) derived from system logs using a combination of automated scripts and manual effort, rather than the raw logs. In this paper, we analyze system logs as they actually are: huge, unstructured, time-varying, ambiguous, and rich with information. Our algorithm makes few assumptions about what data the logs contain (and in what form), and we evaluate our method quantitatively on a large, public data set from several of the world’s most powerful supercomputing systems. As logs of this kind have only recently become available [8], we believe ours is the first such work.
time. Such lines are said to be contained by (or in) their corresponding nodehour; the count of a nodehour is the number of messages it contains. We define Hjc , the j th nodehour for node c, to be Hjc = {li | ci = c ∧ j ≤ ti /3600 < j + 1}. Decomposing logs into documents by source and time reflects how many system administrators divide and conquer logs, as learned through the trial-and-error of experience. Individual lines lack the context to sufficiently characterize a message, whereas huge log dumps with interleaved node output can be difficult to mentally parse. A nodehour provides a happy medium between these extremes, and we found it to be a useful abstraction for detecting alerts. Implicitly, nodehours are chunks of data that we expect to be relatively uniform in content over time—anomalous nodehours are noteworthy events. Space constraints prevent us from discussing alternative log decompositions.
3.1
Ultimately, the goal of reliability research is to minimize unscheduled downtime. An alert detector can facilitate this goal by accurately identifying when and where alerts are generated, so that remedial or preventive action may be taken. Every log line is categorically either an alert or not, so nodehours, which consist of lines, can also be categorized by whether they contain alerts or not. A natural objective is to automatically rank nodehours by the probability that they contain alerts. In the original data sets, every line is tagged with an alert category using a combination of expert rules and manual labeling [8]. In this paper, we extend that tagging, due in part to the results from our alert detection methods (Section 5.1). The message tags are used exclusively for quantifying the effectiveness of our alert detection methods: the methods themselves ignore the tags entirely.
3.2
3
Objective
Metrics
The Challenge
Let a log be a sequence L of lines l1 through lN , where N is the total number of messages: L = (l1 , l2 , . . . , lN ). Each line li consists of a sequence of characters broken up into tokens s1 through sM according to some delimiting sequence of characters (we use whitespace): li = (s1 , s2 , . . . , sM ). Let si,m denote the mth token of line i. M may be different from line to line, and sm need not have the same semantic interpretation throughout the log. We calculate and prepend certain important tokens. Let t be the utime (universal time in seconds) for the line, and so let ti be the time of line i. In addition, let ci be the computer (hereafter node) that generated the line. We decompose logs into nodehours: all lines from a single node c in one hour intervals corresponding to wall clock
Call Hjc an alert nodehour if it contains at least one alert. An alert detection algorithm outputs a list of nodehours, sorted in decreasing order of the probability that each is an alert nodehour. Let Rk be the union of nodehours formed by taking the top k nodehours from this output list. Scoring a ranking of nodehours depends on the definition of what constitutes a true positive (TP), false positive (FP), true negative (TN), and false negative (FN). We experimented with several such definitions before determining that binary scoring, described below, is most useful in practice. This conclusion is related to the fact that some faults are bursty, meaning they produce numerous alert messages in a short period of time. Although the majority of fault types are not bursty [8], our alternative metrics disproportionately reward discovery of bursty alerts. (Many na¨ıve
algorithms seemed excellent, often near-optimal.) The binary scoring metric treats nodehours as atomic, considering only whether or not each nodehour Hjc is an alert nodehour. Nodehours are categorized as follows: TP = {Hjc ∈ Rk | ∃li ∈ Hjc s.t. li is an alert} FP = {Hjc ∈ Rk | ∀li ∈ Hjc , li is not an alert} TN = {Hjc ∈ / Rk | ∀li ∈ Hjc , li is not an alert} c FN = {Hj ∈ / Rk | ∃li ∈ Hjc s.t. li is an alert} A set of nodehours, Rk , yields a single value each for TP P precision ( T PT+F P ), recall ( T P +F N ), and the standard F1 2∗T P measure ( 2∗T P +F P +F N ). Binary scoring spurred us to investigate false positives, thereby finding new alert types that other metrics had obscured; some of these alerts were previously unknown even to the system administrators. Solutions are driven by the metrics used to assess them. For alert detection, the scoring method must be chosen carefully to prevent bursty alerts from eclipsing the more elusive ones. In addition to accurately reflecting the true value of an algorithm, binary scoring accomplishes what per-alert category threshold filtering [4, 10] does not: captures and filters cross-category temporal correlations. Based on our experience in this study, and following the lead of previous work [15], we recommend using binary scoring on nodehours.
The first step is to compute how much information each token conveys regarding the computer that produced it. Let W be the set of unique terms formed by concatenating each line token with its position m in the line (wm = m, si,m ), and let C be the total number of nodes. Let X be a |W | × C matrix such that xw,c is the number of times term w appears in messages generated by node c. Towards understanding how unevenly each term is distributed among nodes, let G be a vector of |W | weights where gw is equal to 1 plus term w’s Shannon information PC entropy [1]. Specifically, gw = 1 + log 1(C) c=1 pw,c log2 (pw,c ), where pw,c is the 2 number of times term w occurs on node c divided by the x number of times it occurs on any node (pw,c = PC w,cx ). c=1 w,c Thus, a term appearing on only a single node receives a weight of 1, and a term appearing the same number of times on all nodes receives a weight of 0. The second step ranks nodehours according to how many high-information terms each contains. Let H be the set of all nodehours and let Y be the |W | × |H| matrix where yw,c,j is the number of times term w occurs in nodehour Hjc . The Nodeinfo value for each nodehour is then calculated as v u |W | uX c (g log (y ))2 . Nodeinfo(H ) = t w
j
3.3
OPT outputs exactly the list of alert nodehours and appears implicitly in all precision-recall plots as a horizontal line at a precision of one. In addition to OPT, we compute scores for a baseline that represents the predominant practice of system administrators. This Bytes baseline simply ranks nodehours by the number of bytes of message data they contain, from largest to smallest. This practice is based on the fact that some alert categories are bursty, and thus the highest-byte nodehours often do contain alerts.
4
Nodeinfo
The motivating premise of Nodeinfo is that similar computers correctly executing similar work should produce similar logs, in terms of content (i.e., line tokens). Nodeinfo is universally applicable, in the sense that it can be computed on any tokenizable log with timestamps. Nodeinfo does not train on labeled data; it is unsupervised. The results represent a performance baseline for alert detection without incorporating system-specific information. The development of Nodeinfo, as well as its performance on a small subset of the data considered in this paper, is detailed elsewhere [15]. The current work contributes examination of its effectiveness on multiple systems, larger systems, and over longer time ranges (together resulting in nearly two orders of magnitude more data). In addition, it examines the effects of using different sized sliding windows, as done in practice.
2
w,c,j
w=1
Optimal and Baseline
Nodehours are then ranked by decreasing Nodeinfo value. Those containing high-information terms will be ranked high, and those containing low-information terms (even a great number of them) will be ranked low. These calculations are modeled after the “log.entropy” weighting scheme [1], where term entropy is calculated over node documents and then applied to all nodehour documents in the corpus. We now describe two practical considerations important for reproducibility of our results. First, we exclude all m = 1 terms in order to decrease the false positive rate [15]. Second, we institute a minimum support threshold of 2. Most terms are infrequent, so this significantly reduces memory overhead and has little impact on the outcome. For instance, terms with a support of 1 must each have a weight of 1, but can contribute no more than the square root of their total number to a nodehour’s Nodeinfo(Hjc ) magnitude. One class of terms eliminated in this manner is hexadecimal addresses, which rarely facilitate alert detection. We do not evaluate the actual impact of this threshold on the results due to computational limitations.
5
Results
Using previously released supercomputer system logs [8, 15], we ran Nodeinfo offline on data from four systems: Liberty, Spirit, Thunderbird, and Blue Gene/L (BG/L). In these initial tests, the algorithm did not significantly outperform Bytes; moreover, it was far from optimal. We now
Alert Type/Cat.
Count
Nodehours
H / CHK COND 3,948,364 S / EXT INODE 1,299,603 H / HDA NR 883,399 H / HDA STAT 883,398 S / PBS U09 437,776 S / PBS EPI 53,647 S / CALL TR 40,810 S / PBS U23 5177
66 47 1846 1846 199 1192 839 8
Example Message Body (Anonymized) Affected Systems: Thunderbird, Spirit, and Liberty kernel: [hex] has CHECK CONDITION, sense key = 0x3 kernel: EXT3-fs error [...] unable to read inode block - [...] kernel: hda: drive not ready for command kernel: hda: status error: status=[...] pbs mom: Unknown error 15009 (15009) in job start error from node [IP:port], [job] pbs mom: scan for exiting, system epilog failed kernel: Call Trace: [] net rx action [kernel] [...] pbs mom: Unknown error 15023 (15023) in job start error from node [IP:port], [job]
Affected System: Blue Gene/L H / DDR STR H / DDR EXC
243 41
241 41
ddr: ddr:
Unable to steer [...]consider replacing the card excessive soft failures, consider replacing the card
Table 1. Additional actionable alert messages discovered via our algorithms. describe the insights that allow us, in Section 6, to improve performance several-fold.
5.1
Data Refinement
We investigated this mediocre performance by scanning the output nodehour lists for false positives, starting with the most highly-ranked nodehours that ostensibly contained no alerts. In these nodehours, we discovered several new alert types that had been incorrectly assigned null alert tags. Using the same rigorous verification process as was employed to tag the original alerts, we updated the data sets with these new alert types. This process involves discussions with the system administrators and a characterization of the alerts that allows us to identify them elsewhere in the log. We also discovered 80 lines erroneously tagged as alerts in the original data [8]. Two were test scripts run on Spirit by an administrator, and the other 78 (on Thunderbird) appear to have been the result of a buggy tagging script. The new alerts are summarized in Table 1, similar to Table 4 in Oliner et al [8]. “Cat.” is the alert category. Types are H (Hardware) and S (Software). Bracketed text indicates omitted information; a bracketed ellipsis indicates sundry text. In all, we discovered ten alert categories, containing 7,552,458 new alert messages across 6325 nodehours. One might speculate whether such alerts could have been discovered via inspection, such as by selecting and reading random nodehours. Years of intense scutiny by the system administrators, and later by Oliner and Stearley, failed to elucidate the alerts discovered via our automated method. Thus, we believe such speculation is idle; our informationtheoretic algorithm revealed new alert categories with great efficiency, and the administrators have since incorporated these alerts into their production detection infrastructure.
5.2
Tagging Limitations
In addition to the ten alert categories enumerated in Table 1, our analysis revealed dozens of other alert categories
System Blue Gene/L (8.48% alerts) Thunderbird (0.163% alerts) Spirit (0.207% alerts) Liberty (0.282% alerts)
Counts Total: 1,816,627 Alert: 154,014 Total: 15,255,833 Alert: 24,877 Total: 6,731,957 Alert: 13,933 Total: 1,820,433 Alert: 5139
C% 87.08 45.42 89.50 85.81 98.76 93.12 96.07 97.90
A/IO % 12.10 54.52 0.6603 0.0764 0.3894 5.828 1.492 0.1946
O% 0.8200 0.0600 9.840 14.11 0.8506 1.052 2.438 1.905
Table 2. Distribution of total and alert nodehours across node types. ‘C’ is Compute, ‘A/IO’ is Admin and IO, and ‘O’ is Other. that were more challenging to incorporate into our current tagging framework. Whether or not certain messages are alerts may depend on (i) the rate at which the messages were generated (rate-sensitive), (ii) proximate messages or the operational status [8] of the node (context-sensitive), or (iii) whether the corresponding remedy is actually known or elected (non-actionable). Per-message alert tagging is straightforward (linewise regular expressions) and precise (exact time and source of an alert). Furthermore, the use of linewise tagging in this paper is consistent with prior work [3, 6, 8]. Nevertheless, limitations of our tagging tools and a poor understanding of rate thresholds obliged us to exclude rate- and contextsensitive messages as alerts. There is reason to expect that including them would improve the performance of our techniques. System administrators have advised us that nonactionable alerts still merit their attention, and so we treat them on par with actionable alerts for scoring.
5.3
Similar Nodes
Statistical anomaly detection algorithms compare a sample against a reference distribution and measure the variation from “normal”; such algorithms perform better when the reference distribution is from the same homogenous population as the sample. In the context of large clusters
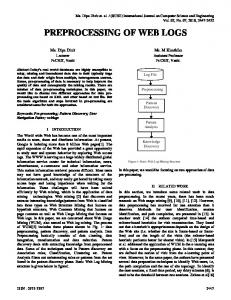
(a) Blue Gene/L. Detection performance on the IO nodes in isolation exceeds that of detection over the log as a whole, even when dropping alerts from every other functional group on the floor.
(b) Spirit. For comparison, the compute nodes group on Spirit yielded area under the curve more than twice that of both Bytes and Nodeinfo run on the entire log, even without considering the remainder of the data.
Figure 1. Precision-recall curves for the online Nodeinfo detector. The legend indicates the functional group, window size, area under the curve, and maximal F1: group.window (area, F1).
and supercomputers, different nodes serve different functions: computation, administration, communication, etc. We ran Nodeinfo on logs from all nodes, and on functionally similar subsets independently, but scored all results using the full number of alerts in all the logs. When considering only compute nodes on Liberty, the Nodeinfo algorithm achieves a maximal F1 score that is seven times better than when non-compute nodes are included. In other words, even when we cripple Nodeinfo by showing it only logs from the compute nodes, its score against the entire data set improves. Although we omit these offline results, the online experiments show similar improvements (Section 6). Table 2 shows the distribution of nodehours from each functional group: compute nodes, administrative nodes (Thunderbird, Spirit, and Liberty), IO nodes (BG/L), and other nodes. Columns 4–6 give the percent contribution of that functional group to the total number of nodehours (first row) and the number of alert nodehours (second row). For example, only 12.1% of the nodehours on BG/L were from I/O nodes, but this functional group contributed 54.52% of the alert nodehours. Considering that only 3.9% of Liberty’s nodehours were from non-compute nodes, the significant impact of their exclusion on Nodeinfo is particularly impressive. These data support our claim that similar computers (compute nodes) tend to generate similar logs.
6
Online Detection
The offline techniques are valuable for exploring the data, but a production setting requires online detection with low latency. In this section, we modify Nodeinfo to oper-
ate using a sliding bounded history window. Furthermore, we try running on major functional groups individually, to evaluate the impact of leveraging our observation regarding similar nodes. We use a “sticky” sliding window to compute the Nodeinfo score for the current nodehours: for reasons of efficiency, this window is not of fixed size; it always starts at midnight W − 1 days prior, for a window size of W days. For example, if W = 30, then all nodehours on January 30th will use data generated since January 1st at 12:00 AM. Thus, W is an upper bound on the amount of history considered in the computation. We consider windows of 30, 60, and 90 days. For consistency, the first 90 days of data are omitted from scoring all online experiments. To evaluate our similar nodes hypothesis, we divide the logs into functional groups (see Table 2) and run Nodeinfo on each group; the resulting lists of ranked nodehours are then scored against all functional groups. (Alerts in other groups are automatically false negatives.) Results from BG/L and Spirit are plotted in Figure 1, and these are representative. For example, Nodeinfo on Spirit (Figure 1(b)) performs slightly worse than Bytes when run on logs from all nodes, but beats it by more than twice (area under the curve) when considering functional groups individually. For comparison, consider the area under the curve metric when the results in Figure 1 are scored against only their respective functional groups: on the BG/L IO nodes, Nodeinfo achieves 0.63 of OPT; on the compute nodes, the metric improves nearly ten-fold. The critical conclusion is that we can leverage the homogeneity of large systems to dramatically improve the quality of alert detection.
Our results show that (i) Nodeinfo is an improvement over Bytes, (ii) Nodeinfo performs better on homogenous functional groups than on all the log at once, and (iii) larger window sizes yield marginal improvements, suggesting both that the logs are changing slowly enough for the past few months to reflect the future and that the computationally inexpensive parameters yield competitive results.
7
Contributions
The central goal of reliability research for high performance computing is to minimize unscheduled downtime. In order to do so, we must reduce the time that system administrators spend investigating new fault types and performing root cause analysis. Better techniques for alert detection are an important step toward more efficient system management, automatic fault prediction and response, and greater overall reliability. In this paper, we formalized the alert detection problem; presented Nodeinfo, a general, unsupervised alert detection algorithm; and quantitatively demonstrated its effectiveness on 81 GB of public supercomputer system logs. Our most salient insight into the alert detection problem is that similar nodes running similar workloads tend to generate similar logs—we can better identify anomalous behavior when normal behavior appears more uniform. The most compelling evidence of our success is that we discovered several new alert categories that had eluded experts for years and that our online implementation of Nodeinfo [14] is in production use on Red Storm, Thunderbird, and Liberty. According to the administrators of these systems, “[our method] has automatically detected, and more importantly isolated, a wide range of problems,” and they have found it to be “a useful diagnostic tool.” Thus, our work has already had a positive operational impact on the systems we studied.
Acknowledgments The authors would like to thank Sue Kelly, Bob Ballance, Sophia Corwell, Ruth Klundt, Dick Dimock, Michael Davis, Jason Repik, Victor Kuhns, Matt Bohnsack, Jerry Smith, and Josh England of SNL; Kim Cupps, Adam Bertsch, and Mike Miller of LLNL; Ramendra Sahoo of IBM; Daniel Ramage of Stanford; and Xuˆan V˜u.
References [1] M. W. Berry, Z. Drmac, and E. R. Jessup. Matrices, vector spaces, and information retrieval. SIAM Rev., 41(2):335– 362, 1999. [2] J. L. Hellerstein, S. Ma, and C. Perng. Discovering actionable patterns in event data. IBM Systems Journal, 41(3), 2002.
[3] Y. Liang, Y. Zhang, M. Jette, A. Sivasubramaniam, and R. K. Sahoo. Blue gene/l failure analysis and prediction models. In Proceedings of the Intl. Conf. on Dependable Systems and Networks (DSN), pages 425–434, 2006. [4] Y. Liang, et al. Filtering failure logs for a bluegene/l prototype. In Proceedings of the Intl. Conf. on Dependable Systems and Networks (DSN), pages 476–485, June 2005. [5] Y. Liao and V. R. Vemuri. Using text categorization techniques for intrusion detection. In 11th USENIX Security Symposium, August 5–9, 2002., pages 51–59, 2002. [6] Logsurfer. A tool for real-time monitoring of text-based logfiles. http://www.cert.dfn.de/eng/logsurf/, 2006. [7] S. Ma and J. Hellerstein. Mining partially periodic event patterns with unknown periods. In Proceedings of the International Conference on Data Engineering (ICDE), pages 409–416, 2001. [8] A. J. Oliner and J. Stearley. What supercomputers say: A study of five system logs. In Proceedings of the 2007 International Conference on Dependable Systems and Networks (DSN), 2007. [9] J. R. Reuning. Applying term weight techniques to event log analysis for intrusion detection. Master’s thesis, University of North Carolina at Chapel Hill, July 2004. [10] R. K. Sahoo and A. J. Oliner, et al. Critical event prediction for proactive management in large-scale computer clusters. In Proceedings of the 9th ACM SIGKDD, International Conference on Knowledge Discovery and Data Mining, pages 426–435. ACM Press, 2003. [11] B. Schroeder and G. Gibson. A large-scale study of failures in high-performance-computing systems. In Proceedings of the Intl. Conf. on Dependable Systems and Networks (DSN), Philadelphia, PA, June 2006. [12] J. Stearley. Towards informatic analysis of syslogs. In IEEE International Conference on Cluster Computing, pages 309– 318, 2004. [13] J. Stearley. Scrubbed logs from five top supercomputers. http://www.cs.sandia.gov/∼jrstear/.logs-alpha1, 2008. [14] J. Stearley. Sisyphus—a log data mining toolkit. http://www.cs.sandia.gov/sisyphus, 2008. [15] J. Stearley and A. J. Oliner. Bad words: Finding faults in spirit’s syslogs. In Workshop on Resiliency in HighPerformance Computing (Resilience), 2008. [16] R. Vaarandi. A data clustering algorithm for mining patterns from event logs. In Proceedings of IEEE International Workshop on IP Operations and Management (IPOM), pages 119–126, October 2003. [17] R. Vaarandi. A breadth-first algorithm for mining frequent patterns from event logs. In Proceedings of the 2004 IFIP International Conference on Intelligence in Communication Systems, volume 3283, pages 293–308, 2004. [18] A. Wespi, M. Dacier, and H. Debar. An intrusion-detection system based on the teiresias pattern-discovery algorithm. In EICAR Annual Conference Proceedings, pages 1–15, 1999. [19] K. Yamanishi and Y. Maruyama. Dynamic syslog mining for network failure monitoring. In Proceedings of the 11th ACM SIGKDD, International Conference on Knowledge Discovery and Data Mining, pages 499–508, New York, NY, USA, 2005. ACM Press.