hemoglob in there really is programmatic and cybernetic algorithm in which it is ârecordedâ, ... AC1 = 10 atoms; AC2 = 22 atoms; AC3 = 19 atoms;... AC306 = 17 ...
ISSN:2229-6093 Lutvo Kurić, Int. J. Comp. Tech. Appl., Vol 2 (2), 216-241
Algorithm and computational complexity of Insulin Lutvo Kurić Bosnia and Herzegovina, Novi Travnik, Kalinska 7
Abstract:This paper discusses cyberinformation studies of the amino acid composition of insulin, in particular the identification of scientific terminology that could describe this phenomenon, ie, the study of genetic information, as well as the relationship between the genetic language of proteins and theoretical aspect of this system and cybernetics. The result of this research show that there is a matrix code for insulin. It also shows that the coding system within the amino acidic language gives detailed information, not only on the amino acid „record“, but also on its structure, configuration and its various shapes. The issue of the existence of an insulin code and coding of the individual structural elements of this protein are discussed. Answers to the following questions are sought. Does the matrix mechanism for biosynthesis of this protein function within the law of the general theory of information systems, and what is the significance of this for understanding the genetic language of insulin? What is the essence of existence and functioning of this language? Is the genetic information characterized only by biochemical, or also by cyberinformation principles? The potential effects of physical and chemical, as well as cybernetic and information ptinciples, on the biochemical basis of insulin are also investigated.This aper discusses new methods for developing genetic technologies, in particular more advanced digital technology based on programming, cybernetics, and informational laws and systems, and how this new technology could be useful in medicine, bioinformatics, genetics, biochemistry, and other natural sciences. Keywords biocoding, atomic progression, human insulin, insulin code, genetics code, amino acids
Introduction The biologic role of any given protein in essential life processes, eg, insulin, depends on the positioning of its component amino acids, and is understood by the „positioning of letters forming words“. Each of these words has its biochemical base. If this base is expressed by corresponding discrete numbers, it can be seen that any given base has its own program, along with its own unique cybernetics and information characteristics. Indeed, the sequencing of the molecule is determined not only by distin biochemical features, but also by cybernetic and information principles. For this reason, research in this field deals more with the quantitative rather than qualitative characteristcs of genetic information and its biochemical basis. For the purposes of this paper, specific physical and chemical factors have been selected in order to express the genetic information for insulin.Numerical values are them assigned to these factors, enabling them to be measured. In this way it is possible to determine oif a connection really exists between the quantitative ratios in the process of transfer of genetic information and the qualitative appearance of the insulin molecule. To select these factors, preference is given to classical physical and chemical parameters, including the number of atoms in the relevant amino acids, their analog values, the position in these amino acids in the peptide chain, and their frenquencies.There is a arge numbers of these parameters, and each of their gives important genetic information. Going through this process, it becomes clear that there is a mathematical relationship between quantitative ratios and the qualitative appearance of the biochemical „genetic processes“ and that there is a measurement method that can be used to describe the biochemistry of insulin.
216
ISSN:2229-6093 Lutvo Kurić, Int. J. Comp. Tech. Appl., Vol 2 (2), 216-241
Methods Insulin can be represented by two different forms, ie, a discrete form and a sequential form. In the discrete form, a molecule of insulin is represented by a set of discrete codes or a multiple dimension vector. In the sequential form, an insulin molecule is represent by a series of amino acids according to the order of their position in the chains 1AI0. Therefore, the sequential form can naturally reflect all the information about the sequence order and lenght of an insulin molecule. The key issue is whether we can develop a different discrete method of representing an insulin molecule that will allow accomodation of partial, if not all sequence order information? Because a protein sequence is usually represented by a series of amino acids should be assigned to these codes in order to optimally convert the sequence order information into a series of numbers for the discrete form representation?
Expression of Insulin Code Matrix- 1AI0 The matrix mechanism of Insulin, the evolution of biomacromolecules and, especially, the biochemical evolution of Insulin language, have been analyzed by the application of cybernetic methods, information theory and system theory, respectively. The primary structure of a molecule of Insulin is the exact specification of its atomic composition and the chemical bonds connecting those atoms.
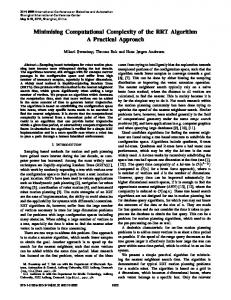
Insulin Model The structure 1AI0 has in total 12 chains: A,B,C,D,E,F,G,H,I,J,K,L. 1AI0:A G
I
V
E
Q
C
C
T
S
I
C
S
L
Y
Q
L
E
N
Y
C
N
10
22
19
19
20
14
14
17
14
22
14
14
22
24
20
22
19
17
24
14
17
1
2
3
4
5
6
7
8
9
10
11
12
13
14
15
16
17
18
19
20
21
1AI0:B F
V
N
Q
H
I
C
G
S
H
L
V
E
A
L
23
19
17
20
20
22
14
10
14
20
22
19
19
13
22
22
23
24
25
26
27
28
29
30
31
32
33
34
35
36
Y
L
V
C
G
E
R
G
F
I
Y
T
P
K
T
24
22
19
14
10
19
26
10
23
22
24
17
17
24
17
37
38
39
40
41
42
43
44
45
46
47
48
49
50
51
etc. Figure 1. Group of chains A,B,C,D,E,F,G,H,I,J,K,L. Notes: Aforementioned aminoacids are positioned from number 1 to 306. Numbers 1, 2, 3, n... present the position of a certain aminoacid. This positioning is of the key importance for understanding of programmatic, cybernetic and information principles in this protein. The scientific key for interpretation of bio chemical processes is the same for insulin and as well as for the other proteins and other sequences in biochemistry.
217
ISSN:2229-6093 Lutvo Kurić, Int. J. Comp. Tech. Appl., Vol 2 (2), 216-241
The first aminoacid in this example has 10 atoms, the second one 22, the third one 19, etc. They have exactly these numbers of atoms because there are many codes in the insulin molecule, analog codes, and other voded features. In fact, there is a cybernetic algorithm which it is „recorded“ that the firs amino acid has to have 10 atoms, the second one 22, the third one 19, etc. The first amino acid has its own biochemistry, as does the second and the third, etc. The obvious conclusion is that there is a concrete relationship between quantitative ratios in the process of transfer of genetic information and qualitative appearance, ie, the characteristcs of the organism. ALGORITHM
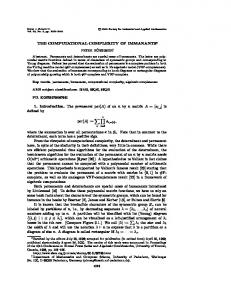
We shall now give some mathematical evidences that will prove that in the biochemistry of hemoglob in there really is programmatic and cybernetic algorithm in which it is „recorded“, in the language of mathematics, how the molecule will be built and what will be the quantitative characteristics of the given genetic information. Atomic progression Step 1 (Amino acids from 1 to 306) AC1 = 10 atoms; AC2 = 22 atoms; AC3 = 19 atoms;... AC306 = 17 atoms; [AC1 + (AC1+ AC2) + (AC1+ AC2+ AC3)..., + (AC1+ AC2+ AC3..., + AC147)] = S1; AC1 = APa1 = 10; (AC1+ AC2) = (10+22) = APa2 = 32; (AC1+ AC2+ AC3) = (10+22+19) = APa3 = 51; (AC1+ AC2+ AC3..., + AC306) = APa306 = 5640 atoms; APa1,2,3,n = Atomic progression of amino acids 1,2,3,n [APa1+APa2+APa3)..., + APa306)] = (10+32+51…, + 5640) = S1; S1 = 863 208;
Example : Atomic progression 1 (APa) . . G I V E Q C P K T Sum . . 10 22 19 19 20 14 17 24 17 5640 . . 304 305 306 46971 1 2 3 4 5 6 . . Sum G I V E Q C P K T 5599 5623 5640 863 208 10 32 51 70 90 104 . . . . 1 2 3 4 5 6 304 305 306 46971 (0+10) = 10; (10+22)=32; (10+11+19) = 51; etc.
218
ISSN:2229-6093 Lutvo Kurić, Int. J. Comp. Tech. Appl., Vol 2 (2), 216-241
Figure 2. Atomic progression 1 (APa) of amino acids from 1 to 306. Notes: By using chemical-information procedures, we calculated the arithmetic progression for the information content of aforementioned aminoacids.
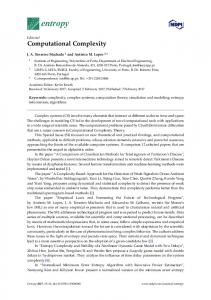
Step 2 (Amino acids from 306 to 1) AC306 = 17 atoms; AC305 = 24 atoms; AC304 = 17 atoms;... AC1 = 10 atoms; [AC306 + (AC306+ AC305) + (AC306+ AC305+ AC304)..., + (AC306+AC305+AC304..., +AC1)] = S2; AC306 = APb306 = 17; (AC306+ AC305) = (17+24) = APb306 = 41; (AC306+ AC305+ AC304) = (17+24+17) = APb304 = 58; (AC306+ AC305+ AC304..., + AC1) = APb1 = 5640 atoms; APb306,305,304, …,1 = Atomic progression of amino acids 306,305,304,…1; [APb306+APb305+APb1304)..., + APb1)] = (17+41+58…, + 5640) = 868 272; S2 = 868 272; Example: Atomic progression 2 (APb) G
I
V
.
.
I
Y
T
P
K
T
Sum
10
22
19
24
17
17
24
17
5640
2
3
. .
22
1
. .
302
303
304
305
306
46971
Sum 868 272 46971
301
G
I
V
.
.
I
Y
T
P
K
T
5640 1
5630 2
5608 3
. .
. .
121 301
99 302
75 303
58 304
41 305
17 306
(0+17) = 17; (17+24)=41; (17+24+17)=58; etc. Figure 3. Schematic representation of the atomic progression 2 from 306 to 1. Within the digital pictures in biochemistry, the physical and chemical parameters are in a strict compliance with programmatic, cybernetic and information principles. Each bar in the protein chain attracts only the corresponding aminoacid, and only the relevant aminoacid can be positioned at certain place in the chain. Each peptide chain can have the exact number of aminoacids necessary to meet the strictly determined mathematical conditioning. It can have as many atoms as necessary to meet the mathematical balance of the biochemical phenomenon at certain mathematical level, etc. The digital language of biochemistry has a countless number of codes and analogue codes, as well as other information content. These pictures enable us to realize the very essence of functioning of biochemical processes. There are some examples.
219
ISSN:2229-6093 Lutvo Kurić, Int. J. Comp. Tech. Appl., Vol 2 (2), 216-241
Table 1.
Bio intervals APa and APb (sequence from 1 to 306 AA)
Insulin Model The structure 1AI0 AA
S
N
C
L
E
G
T
S
N
C
L
E
G
T
Number of atoms
14
17
14
22
19
10
17
14
17
14
22
19
10
17
Rank
114
120
122
134
136
143
153
165
171
173
185
187
194
204
2079
2203
2241
2459
2497
2621
2820
3019
3143
3181
3399
3437
3561
3760
APa
-1681
-1358
-1196
-940
-684
-522
-199
+199
+522
+684
+940
+1196
+1358
+1681
APb
3760
3561
3437
3399
3181
3143
3019
2820
2621
2497
2459
2241
2203
2079
AA
G
L
Y
N
V
A
E
G
L
Y
N
V
A
E
Number of atoms Rank
10
22
24
17
19
13
19
10
22
24
17
19
13
19
103
115
121
123
135
137
144
154
166
172
174
186
188
195
>
40420
>
40420
(2079-3760) = -1681; (2203-3561) = -1358; (2241-3437) ) =-1196; etc.
Table 1. Schematic representation of the bio intervals APa and APb (sequence from 1 to 306 AA). Notes: Namely, having mathematically analyzed the Bio intervals model of Insulin Model (Table 1) we have found out that the protein code is based on a periodic law. This being the only to „read“ the picture, the solution of the main problem (concering an arrangement where each amino acid takes only one, precisely determined position in the code), is quite manifest: Bio intervals model of insulin should, in fact, be „remodelled“ into a periodic system. Examples:
Insulin Model The structure 1AI0 Table 2 AA
S
N
C
L
E
G
T
S
N
C
L
E
G
T
Number of atoms
14
17
14
22
19
10
17
14
17
14
22
19
10
17
Rank
63
69
71
83
85
92
102
216
222
224
236
238
245
255
1139
1263
1301
1519
1557
1681
1880
3959
4083
4121
4339
4377
4501
4700
APa
-3561
-3238
-3076
-2820
-2564
-2402
-2079
2079
2402
2564
2820
3076
3238
3561
>
220
40420
ISSN:2229-6093 Lutvo Kurić, Int. J. Comp. Tech. Appl., Vol 2 (2), 216-241
APb
4700
4501
4377
4339
4121
4083
3959
1880
1681
1557
1519
1301
1263
1139
AA
G
L
Y
N
V
A
E
G
L
Y
N
V
A
E
Number of atoms
10
22
24
17
19
13
19
10
22
24
17
19
13
19
52
64
70
72
84
86
93
205
217
223
225
237
239
246
Rank
>
40420
Table 2. Schematic representation of the bio intervals APa and APb (sequence from 52 to 255 AA).
Insulin Model The structure 1AI0 Table 3 AA
S
N
C
L
E
G
T
S
N
C
L
E
G
T
Number of atoms
14
17
14
22
19
10
17
14
17
14
22
19
10
17
Rank
12
18
20
32
34
41
51
267
273
275
287
289
296
306
199
323
361
579
617
741
940
4899
5023
5061
5279
5317
5441
5640
-5441
-5118
-4956
-4700
-4444
-4282
-3959
+3959
+4282
+4444
+4700
+4956
+5118
+5441
APb
5640
5441
5317
5279
5061
5023
4899
940
741
617
579
361
323
199
AA
G
L
Y
N
V
A
E
G
L
Y
N
V
A
E
10
22
24
17
19
13
19
10
22
24
17
19
13
19
1
13
19
21
33
35
42
256
268
274
276
288
290
297
APa
Number of atoms Rank
Table 3. Schematic representation of the bio intervals APa and APb (sequence from 1 to 306 AA). The research we carried out have shown that atomic progression are one of quantitative characteristics in biochemistry. Atomic progression is, actually, a discrete code that protects and guards genetic information coded in bio-chemical processes. This a recently discovered code, and more detailed knowledge on it is yet to be discovered. In a similar way we shall calculate bio codes of other unions of amino acids. Once we do this, we will find out that all these unions of amino acids are connected by various bio codes, analogue codes as well as other quantitative features. Examples:
221
>
40420
>
40420
ISSN:2229-6093 Lutvo Kurić, Int. J. Comp. Tech. Appl., Vol 2 (2), 216-241
Insulin Model The structure 1AI0 Table 4. AA Number of atoms
S
N
C
L
E
G
T
14
17
14
22
19
10
17
Rank
12
18
20
32
34
41
51
199
323
361
579
617
741
940
-741
-418
-256
0
+256
+418
+741
APb
940
741
617
579
361
323
199
AA Number of atoms
G
L
Y
N
V
A
E
10
22
24
17
19
13
19
Rank
256
268
274
276
288
290
297
APa
>
3760
>
3760
Table 4. Schematic representation of the bio intervals APa and APb (sequence from 12 to 297. AA). (199-940) = -741; (323-741) = -418; (361-617) = -256;
Insulin Model The structure 1AI0 Table 5. AA Number of atoms
S
N
C
L
E
G
T
14
17
14
22
19
10
17
Rank
63
69
71
83
85
92
102
1139
1263
1301
1519
1557
1681
1880
APa
-741 -418 -256
0
>
10340
+256 +418 +741
222
ISSN:2229-6093 Lutvo Kurić, Int. J. Comp. Tech. Appl., Vol 2 (2), 216-241
APb
1880
1681
1557
1519
1301
1263
1139
AA Number of atoms
G
L
Y
N
V
A
E
10
22
24
17
19
13
19
Rank
205
217
223
225
237
239
246
>
10340
Table 5. Schematic representation of the bio intervals APa and APb (sequence from 63 to 246. AA).
Insulin Model The structure 1AI0 Table 6. AA Number of atoms
S
N
C
L
E
G
T
14
17
14
22
19
10
17
Rank
114
120
122
134
136
143
153
APa
2079
2203
2241
2459
2497
2621
2820
-741 -418 -256
0
>
16920
>
16920
+256 +418 +741
APb
2820
2621
2497
2459
2241
2203
2079
AA Number of atoms
G
L
Y
N
V
A
E
10
22
24
17
19
13
19
Rank
154
166
172
174
186
188
195
Table 6. Schematic representation of the bio intervals APa and APb (sequence from 114 to 195. AA).
Insulin Model The structure 1AI0 Table 7. AA Number of atoms
S
N
C
L
E
G
T
14
17
14
22
19
10
17
Rank
165
171
173
185
187
194
204
APa
3019
3143
3181
3399
3437
3561
3760
>
23500
223
ISSN:2229-6093 Lutvo Kurić, Int. J. Comp. Tech. Appl., Vol 2 (2), 216-241
-741 -418 -256
0
256
418
741
APb
3760
3561
3437
3399
3181
3143
3019
AA Number of atoms
G
L
Y
N
V
A
E
10
22
24
17
19
13
19
Rank
103
115
121
123
135
137
144
>
23500
Table 7. Schematic representation of the bio intervals APa and APb (sequence from 103 to 165. AA).
Insulin Model The structure 1AI0 Table 8. AA Number of atoms
S
N
C
L
E
G
T
14
17
14
22
19
10
17
Rank
216
222
224
236
238
245
255
3959
4083
4121
4339
4377
4501
4700
0
256
418
741
APa
-741 -418 -256
APb
4700
4501
4377
4339
4121
4083
3959
AA Number of atoms
G
L
Y
N
V
A
E
10
22
24
17
19
13
19
Rank
52
64
70
72
84
86
93
>
30080
>
30080
Table 8. Schematic representation of the bio intervals APa and APb (sequence from 52 to 255. AA).
Insulin Model The structure 1AI0 Table 9. AA Number of atoms
S
N
C
L
E
G
T
14
17
14
22
19
10
17
224
ISSN:2229-6093 Lutvo Kurić, Int. J. Comp. Tech. Appl., Vol 2 (2), 216-241
Rank
APa
267
273
275
287
289
296
306
4899
5023
5061
5279
5317
5441
5640
0
256
418
741
-741 -418 -256
APb
5640
5441
5317
5279
5061
5023
4899
AA Number of atoms
G
L
Y
N
V
A
E
10
22
24
17
19
13
19
Rank
1
13
19
21
33
35
42
>
36660
>
36660
Table 9. Schematic representation of the bio intervals APa and APb (sequence from 1 to 306. AA). Those tables (4-9) contains an overview of all positive and negative values of bio codes. The values show some of the quantitative characteristics of the molecule of insulin. Actually, they show that there is an exact mathematical balance between positive and negative values. Therefore, there is a mathematical balance between the union of aminoacids with positive progression and those of negative progression. Aminoacids with a positive progression have a primary role in the mathematical picture of that protein, and the negative progression have a secondary role in it. We assume that aminoacids with a positive progression have a primary role in the biochemical picture of that protein, and the negative progression have a secondary role in it. If this really is the case and research on an experimental level proves it, a radically new way of learning about biochemical processes will be opened. The molecule of insulin we can understand as words built from letters, i.e. aminoacids. The meaning of words is determined by positioning of letters. Each of these words has its biochemical base. If this base is expressed by corresponding discrete numbers, we find out that the base has its own program, cybernetic and information characteristics. In fact, we will find out that the sequencing of the molecule is conditioned and determined not only by biochemical, but also by cybernetic and information principles. For this reason, in this research we will deal more with quantitative, and less with qualitative characteristics of the genetic information and its biochemical foundation. Here are some examples
Insulin Model The structure 1AI0 Table 10. AA Number of atoms
G
G
G
G
G
G
10
10
10
10
10
10
Rank
256
205
154
103
52
1
225
ISSN:2229-6093 Lutvo Kurić, Int. J. Comp. Tech. Appl., Vol 2 (2), 216-241
940 1880 2820 3760 4700 5640
APb
741
741
741
741
741
741
199 1139 2079 3019 3959 4899
APa
AA Number of atoms
S
S
S
S
S
S
14
14
14
14
14
14
Rank
12
63
114
165
216
267
Table 10. Schematic representation of the bio intervals APa and APb (G and S. AA). (940-199)=741; (1880-1139) = 741: (2820-2079) = 741; etc.
Insulin Model The structure 1AI0 Table 11. AA Number of atoms
L
L
L
L
L
L
22
22
22
22
22
22
Rank
13
64
115
166
217
268
5441
4501
3561
2621
1681
741
418
418
418
418
418
418
5023
4083
3143
2203
1263
323
APa
APb
AA Number of atoms
N
N
N
N
N
N
17
17
17
17
17
17
Rank
273
222
171
120
69
18
Table 11. Schematic representation of the bio intervals APa and APb (L and N. AA). .
226
ISSN:2229-6093 Lutvo Kurić, Int. J. Comp. Tech. Appl., Vol 2 (2), 216-241
Insulin Model The structure 1AI0 Table 12. AA Number of atoms
L
L
L
L
L
L
22
22
22
22
22
22
Rank
32
83
134
185
236
287
579
1519
2459
3399
4339
5279
0
0
0
0
0
0
1519
2459
3399
4339
5279
APa
APb
579
AA Number of atoms
N
N
N
N
N
N
17
17
17
17
17
17
Rank
276
225
174
123
72
21
Table 12. Schematic representation of the bio intervals APa and APb (L and N. AA).
Insulin Model The structure 1AI0 Table 13. AA Number of atoms
G
G
G
G
G
G
10
10
10
10
10
10
Rank
41
92
143
194
245
296
741
1681
2621
3561
4501
5441
5764
5764
5764
5764
5764
5764
5023
4083
3143
2203
1263
A
A
A
A
A
A
APa
APb
AA
323
227
ISSN:2229-6093 Lutvo Kurić, Int. J. Comp. Tech. Appl., Vol 2 (2), 216-241
Number of atoms
13
13
13
13
13
13
Rank
35
86
137
188
239
290
Table 13. Schematic representation of the bio intervals APa and APb (G and A. AA). (741+5023) = 5764; (1681+4083) = 5764; (2621+3143) = 5764; etc.
Insulin Model The structure 1AI0 Table 14. AA Number of atoms
C
C
C
C
C
C
14
14
14
14
14
14
Rank
20
71
122
173
224
275
361
1301
2241
3181
4121
5061
APa
5678 5678 5678 5678 5678 5678 APb
5317
4377
3437
2497
1557
617
AA Number of atoms
Y
Y
Y
Y
Y
Y
24
24
24
24
24
24
Rank
19
70
121
172
223
274
Table 14. Schematic representation of the bio intervals APa and APb (C and Y. AA). (361+5317) = 5678; (1301+4377) = 5678; (2241+3437) = 5678; etc.
Insulin Model The structure 1AI0 Table 15. AA Number of atoms
E
E
E
E
E
E
19
19
19
19
19
19
228
ISSN:2229-6093 Lutvo Kurić, Int. J. Comp. Tech. Appl., Vol 2 (2), 216-241
Rank
APa
34
85
136
187
238
289
617
1557
2497
3437
4377
5317
5678 5678 5678 5678 5678 5678 APb
5061
4121
3181
2241
1301
361
AA Number of atoms
V
V
V
V
V
V
19
19
19
19
19
19
Rank
33
84
135
186
237
288
Table 15. Schematic representation of the bio intervals APa and APb (E and V. AA). (617+5061) = 5678; (1557+4121) = 5678; (2497+3181) = 5678; ets.
Insulin Model The structure 1AI0 Table 16. AA Number of atoms
T
T
T
T
T
T
17
17
17
17
17
17
Rank
51
102
153
204
255
306
940
1880
2820
3760
4700
5640
APa
5839 5839 5839 5839 5839 5839 APb
4899
3959
3019
2079
1139
199
AA Number of atoms
E
E
E
E
E
E
19
19
19
19
19
19
Rank
42
93
144
195
246
297
Table 16. Schematic representation of the bio intervals APa and APb (T and E. AA). (940+4899) = 5839; (1880+3959) = 5839; (3760+2079) = 5839; ets.
229
ISSN:2229-6093 Lutvo Kurić, Int. J. Comp. Tech. Appl., Vol 2 (2), 216-241
Insulin Model The structure 1AI0 Table 17. AA Number of atoms
E
E
E
E
E
E
19
19
19
19
19
19
Rank
34
85
136
187
238
289
617
1557
2497
3437
4377
5317
0
0
0
0
0
0
617
1557
2497
3437
4377
5317
APa
APb
AA Number of atoms
Y
Y
Y
Y
Y
Y
24
24
24
24
24
24
Rank
274
223
172
121
70
19
Table 17. Schematic representation of the bio intervals APa and APb (E and Y. AA).
Insulin Model The structure 1AI0 Table 18. AA Number of atoms
C
C
C
C
C
C
14
14
14
14
14
14
Rank
20
71
122
173
224
275
361
1301
2241
3181
4121
5061
0
0
0
0
0
0
1301
2241
3181
4121
5061
V
V
V
V
V
V
APa
APb
AA
361
230
ISSN:2229-6093 Lutvo Kurić, Int. J. Comp. Tech. Appl., Vol 2 (2), 216-241
Number of atoms
19
19
19
19
19
19
Rank
288
237
186
135
84
33
Table 18. Schematic representation of the bio intervals APa and APb (C and V. AA).
Insulin Model The structure 1AI0 Table 19. AA Number of atoms
T
T
T
T
T
T
17
17
17
17
17
17
Rank
51
102
153
204
255
306
940
1880
2820
3760
4700
5640
741
741
741
741
741
741
199
1139
2079
3019
3959
4899
APa
APb
AA Number of atoms
E
E
E
E
E
E
19
19
19
19
19
19
Rank
297
246
195
144
93
42
(940-199) = 741; (1880-1139) = 741; (940-2079) = 741; etc. Table 19. Schematic representation of the bio intervals APa and APb (T and E. AA). Atomic progression presented in Tables 1-19 are calculated using the relationship between corresponding groups of amino acids. These are groups with different numbers of amino acids. There are different ways and methods of selecting these groups of amino acids, which method is most efficient some We hope that science will determine which method is most efficient for this selection. Biological particularity of proteins depends on the order of amino acids in their molecules. Change of that order will lead to the change of their biological particularity. The base parameters that determine the change of status of biosynthesis matrix of macromolecules are the system entropy, volume of information transferred and the level of probability that the genetic information will be transferred as a whole.
231
ISSN:2229-6093 Lutvo Kurić, Int. J. Comp. Tech. Appl., Vol 2 (2), 216-241
System is any group of objects (elements), their relations (number of atoms, atomic number, atomic weight, co-valent radius, molar rotation, electrical negativity, etc...), as well as relations among its attributes. Such is the example of insulin, but also all other proteins. An identical scenario we have in the example of all natural sequences. Therefore, if G (10 atoms) is replaced by an amino acid with the same polarity of characteristics, but different number of atoms, the biological particularity of insulin will change, reflected in genetic changes and mutagenesis.
Insulin Model The structure 1AI0 Table 20. G AA Number of atoms
Rank
G
G
G
G
G
10
10
10
10
10
10
256
205
154
103
52
1
268 268 268 268 268 268 Rank
AA Number of atoms
12
63
114
165
216
267
S
S
S
S
S
S
14
14
14
14
14
14
(256+12) = 268; (205+63) = 268; (154+114) = 268; etc. Table 20. Schematic representation of the ranks APa and APb (G and S. AA).
Insulin Model The structure 1AI0 Table 21. AA Number of atoms
Rank
L
L
L
L
L
L
22
22
22
22
22
22
13
64
115
166
217
268
286 286 286 286 286 286
232
ISSN:2229-6093 Lutvo Kurić, Int. J. Comp. Tech. Appl., Vol 2 (2), 216-241
Rank
AA Number of atoms
273
222
171
120
69
18
N
N
N
N
N
N
17
17
17
17
17
17
(273+13) = 286; (222+64) = 286; (171+115) = 286; etc. Table 21. Schematic representation of the ranks APa and APb (L and N. AA).
Insulin Model The structure 1AI0 Table 22. L AA Number of atoms
Rank
L
L
L
L
L
22
22
22
22
22
22
32
83
134
185
236
287
308 308 308 308 308 308 Rank
AA Number of atoms
276
225
174
123
72
21
N
N
N
N
N
N
17
17
17
17
17
17
(32+276) = 308; (83+225) = 308; (134+174) = 308; etc. Table 22. Schematic representation of the ranks APa and APb (L and N. AA).
Insulin Model The structure 1AI0 Table 23. AA Number of atoms
Rank
G
G
G
G
G
G
10
10
10
10
10
10
296
245
194
143
92
41
233
ISSN:2229-6093 Lutvo Kurić, Int. J. Comp. Tech. Appl., Vol 2 (2), 216-241
331 331 331 331 331 331 Rank
AA Number of atoms
35
86
137
188
239
290
A
A
A
A
A
A
13
13
13
13
13
13
(296+35) = 331; (245+86) = 331; (194+137) = 331; etc. Table 23. Schematic representation of the ranks APa and APb (G and A. AA).
Insulin Model The structure 1AI0
Table 24. AA Number of atoms
Rank
C
C
C
C
C
C
14
14
14
14
14
14
20
71
122
173
224
275
294 294 294 294 294 294 Rank
AA Number of atoms
274
223
172
121
70
19
Y
Y
Y
Y
Y
Y
24 24 24 24 24 24 (20+274) = 294; (71+223) = 294; (122+172) = 294; etc. Table 24. Schematic representation of the ranks APa and APb (G and A. AA).
Insulin Model The structure 1AI0 Table 25. AA
E
E
E
E
E
E
234
ISSN:2229-6093 Lutvo Kurić, Int. J. Comp. Tech. Appl., Vol 2 (2), 216-241
Number of atoms
Rank
19
19
19
19
19
19
34
85
136
187
238
289
322 322 322 322 322 322 Rank
AA Number of atoms
288
237
186
135
84
33
V
V
V
V
V
V
19
19
19
19
19
19
(34+288) = 322; (85+237) = 322; (136+186) = 322; etc. Table 25. Schematic representation of the ranks APa and APb (E and V. AA).
Insulin Model The structure 1AI0
Table 26. AA Number of atoms
Rank
T
T
T
T
T
T
17
17
17
17
17
17
51
102
153
204
255
306
348 348 348 348 348 348 Rank
AA Number of atoms
297
246
195
144
93
42
E
E
E
E
E
E
19
19
19
19
19
19
(51+297) = 348; (102+246) = 348; (153+195) = 348; etc. Table 26. Schematic representation of the ranks APa and APb (T and E. AA). As it cam be observed, quantitative characteristics of the biochemistry of insulin apply to the position number. It can be concluded that there is a connection between quantitative
235
ISSN:2229-6093 Lutvo Kurić, Int. J. Comp. Tech. Appl., Vol 2 (2), 216-241
characteristics in the process of transfer of genetic information and the qualitative appearance of given genetic processes. We would particularly like to stress here that the genetic, as well as biochemical information in a broader sense of the word, is determined and characterized by very complex cybernetic and information principles. The constantans in those principles are: the number of atoms and molecules, atomic numbers, atomic weight, physical and chemical parameters, even and odd values, codes and analogue codes, standard deviations, frequencies, primary and secondary values, and many other things. There are some examples.
Amino acids with atomic progression
Insulin Model The structure 1AI0, chains: A,B,C,D,E,F,G,H,I,J,K,L.
Table 27. G I V E Q C C T S I C S L Y Q L E N Y C N F V N Q H I C G S H L V E A L Y L V C G E R G F I Y T P K T G I V E Q C C T S I C S L Y Q L E N Y C N F V N Q H I C G S H L V E A L Y L V C G E R G F I Y T P K T G I V E Q C C T S I C S L Y Q L E N Y C N F V N Q H I C G S H L V E A L Y L V C G E R G F I Y T P K T G I V E Q C C T S I C S L Y Q L E N Y C N F V N Q H I C G S H L V E A L Y L V C G E R G F I Y T P K T G I V E Q C C T S I C S L Y Q L E N Y C N F V N Q H I C G S H L V E A L Y L V C G E R G F I Y T P K T G I V E Q C C T S I C S L Y Q L E N Y C N F V N Q H I C G S H L V E A L Y L V C G E R G F I Y T P K T Table 27. Schematic representation of the amino acids with atomic progression .
236
ISSN:2229-6093 Lutvo Kurić, Int. J. Comp. Tech. Appl., Vol 2 (2), 216-241
Amino acids without atomic progression Table 28. G I V E Q C C
T
S
I
C S
L
Y Q L
E
N Y C N F V N Q H I C G S H L V E A L Y L V C G E R G F I Y T P K T G I V E Q C C T S I C S L Y Q L E N Y C N F V N Q H I C G S H L V E A L Y L V C G E R G F I Y T P K T G I V E Q C C T S I C S L Y Q L E N Y C N F V N Q H I C G S H L V E A L Y L V C G E R G F I Y T P K T G I V E Q C C T S I C S L Y Q L E N Y C N F V N Q H I C G S H L V E A L Y L V C G E R G F I Y T P K T G I V E Q C C T S I C S L Y Q L E N Y C N F V N Q H I C G S H L V E A L Y L V C G E R G F I Y T P K T G I V E Q C C T S I C S L Y Q L E N Y C N F V N Q H I C G S H L V E A L Y L V C G E R G F I Y T P K T Table 28. Schematic representation of the amino acids without atomic progression
The structure 1AI0, chains: A,B,C,D,E,F,G,H,I,J,K,L. Prima sequences Table 29. 10
22
19
19
20 14 14 17 14 22 14 14 22 24 20 22 19
17 24 14 17 23 19 17 20 20 22 14 10 14 20 22 19 19 13
22
24
22
19 14 10 19 26 10 23 22
24
17
17
24
17
10
22
19
19
20 14 14 17 14 22 14 14 22 24 20 22 19
17 24 14 17 23 19 17 20 20 22 14 10 14 20 22 19 19 13
22
24
22
19 14 10 19 26 10 23 22
24
17
17
24
17
20 14 14 17 14 22 14 14 22 24 20 22 19 17 24 14 17 23 19 17 20 20 22 14 10 14 20 22 19 19 10
22
19
19
13
22
24
22
10
22
19
19
19 14 10 19 26 10 23 22
20 17 24 14 17 23 13 22 24 22 19 10 22 19 19 20
14 19 14 14
14 17 10 14
17 20 19 17
14 20 26 14
22 22 10 22
14 14 23 14
24
17
17
24
17
14 22 24 20 22 19 10 14 20 22 19 19 22 24 17 17 24 17 14 22 24 20 22 19
237
ISSN:2229-6093 Lutvo Kurić, Int. J. Comp. Tech. Appl., Vol 2 (2), 216-241
17 24 14 17 23 19 17 20 20 22 14 10 14 20 22 19 19 13 10
22 22
24 19
22 19
19 14 10 19 26 10 23 22 24 17 17 24 17 20 14 14 17 14 22 14 14 22 24 20 22 19
17 24 14 17 23 19 17 20 20 22 14 10 14 20 22 19 19 13
22
24
22
19 14 10 19 26 10 23 22
24
17
17
24
17
Table 29. Schematic representation of the amino acids - prima sequences Prima numbers 19, 19, 17,…, 17 = Prima sequences V,E,T,…T In the previous examples we translated the physical and chemical parameters from the language of biochemistry into the digital language of programmatic, cybernetic and information principles. This we did by using the adequate mathematical algorithms. By using chemical-information procedures, we calculated the numerical value for the information content of molecules. What we got this way is the digital picture of the phenomenon of biochemistry. These digital pictures reveal to us a whole new dimension of this science. They reveal to us that the biochemical process is strictly conditioned and determined by programmatic, cybernetic and information principles. From the previous examples we can see that this protein really has its quantitative characteristics. It can be concluded that there is a connection between quantitative characteristics in the process of transfer of genetic information and the qualitative appearance of given genetic processes.
DISCUSSION The results of our research show that the processes of sequencing the molecules are conditioned and arranged not only with chemical and biochemical lawfulness, but also with program, cybernetic and informational lawfulness too. At the first stage of our research we replaced nucleotides from the Amino Acid Code Matrix with numbers of the atoms and atomic numbers in those nucleotides. Translation of the biochemical language of these amino acids into a digital language may be very useful for developing new methods of predicting protein sub-cellular localization, membrane protein type, protein structure secondary prediction or any other protein attributes. Since the concept of Chou's pseudo amino acid composition was proposed [1-2], there have been many efforts to try to use various digital numbers to represent the 20 native amino acids in order to better reflect the sequence-order effects through the vehicle of pseudo amino acid composition. Some investigators used complexity measure factor [3], some used the values derived from the cellular automata [4-7], some used hydrophobic and/or hydrophilic values [8-16], some were through Fourier transform [17-18], and some used the physicochemical distance [19]. The author [34-44] is devoted to provide a digital code for each of 20 native amino acids. These digital codes should more complete and better reflect the essence of each of the 20 amino acids. Therefore, it might stimulate a series of future work by using the author’s digital codes to formulate the pseudo amino acid composition for predicting protein structure class [20-22], subcellular location [23,24], membrane protein type [9,25], enzyme family class [26,27], GPCR type [28, 29], protease type [30], protein-protein interaction [31], metabolic pathways [32], protein quaternary structure [33], and other protein attributes. It is going to be possible to use a completely new strategy of research in genetics in the future. However, close observation of
238
ISSN:2229-6093 Lutvo Kurić, Int. J. Comp. Tech. Appl., Vol 2 (2), 216-241
all these relationships, which are the outcomes of periodic laws (more specifically the law of binary coding), stereo-chemical and digital structure of proteins.
Conclusions The process of sequencing in bio-macromolecules is conditioned and determined not only through biochemical, but also through cybernetic and information principles. The digital pictures of biochemistry provide us with cybernetic and information interpretation of the scientific facts. Now we have the exact scientific proofs that there is a genetic language that can be described by the theory of systems and cybernetics, and which functions in accordance with certain principles.
DISCLOSURE The author reports no conflict of interest in this research.
REFERENCES [1] K.C. Chou, Gene Cloning & Expression Technologies, Chapter 4 (Weinrer, P.W., and Lu, Q., Eds.), Eaton Publishing, Westborough, MA (2002), pp. 57-70. [2] K.C. Chou, Prediction of protein cellular attributes using pseudo amino acid composition PROTEINS: Structure, Function, and Genetics (Erratum: ibid., 2001, Vol.44,60) 43 (2001) 246-255. [3] X. Xiao, S. Shao, Y. Ding, Z. Huang, Y. Huang, K. C. Chou, Using complexity measure factor to predict protein subcellular location, Amino Acids 28 (2005) 57-61. [4] X. Xiao, S. Shao, Y. Ding, Z. Huang, X. Chen, K. C. Chou, Using cellular automata to generate Image representation for biological sequences, Amino Acids 28 (2005) 29-35. [5] X. Xiao, S. Shao, Y. Ding, Z. Huang, X. Chen, K. C. Chou, An Application of Gene Comparative Image for Predicting the Effect on Replication Ratio by HBV Virus Gene Missense Mutation, Journal of Theoretical Biology 235 (2005) 555-565. [6] X. Xiao, S. H. Shao, Z. D. Huang, K. C. Chou, Using pseudo amino acid composition to predict protein structural classes: approached with complexity measure factor, Journal of Computational Chemistry 27 (2006) 478-482. [7] X. Xiao, S. H. Shao, Y. S. Ding, Z. D. Huang, K. C. Chou, Using cellular automata images and pseudo amino acid composition to predict protein sub-cellular location, Amino Acids 30 (2006) 49-54. [8] K. C. Chou, Using amphiphilic pseudo amino acid composition to predict enzyme subfamily classes, Bioinformatics 21 (2005) 10-19. [9] K. C. Chou, Y. D. Cai, Prediction of membrane protein types by incorporating amphipathic effects, Journal of Chemical Information and Modeling 45 (2005) 407-413. [10] Z. P. Feng, Prediction of the subcellular location of prokaryotic proteins based on a new representation of the amino acid composition, Biopolymers 58 (2001) 491-499. [11] Z. P. Feng, An overview on predicting the subcellular location of a protein, In Silico Biol 2 (2002) 291-303. [12] M. Wang, J. Yang, Z. J. Xu, K. C. Chou, SLLE for predicting membrane protein types, Journal of Theoretical Biology 232 (2005) 7-15. [13] S. Q. Wang, J. Yang, K. C. Chou, Using stacked generalization to predict membrane protein types based on pseudo amino acid composition, Journal of Theoretical Biology,
239
ISSN:2229-6093 Lutvo Kurić, Int. J. Comp. Tech. Appl., Vol 2 (2), 216-241
in press (2006) doi:10.1016/j.jtbi.2006.1005.1006. [14] M. Wang, J. Yang, G. P. Liu, Z. J. Xu, K. C. Chou, Weighted-support vector machines for predicting membrane protein types based on pseudo amino acid composition, Protein Engineering, Design, and Selection 17 (2004) 509-516. [15] S. W. Zhang, Q. Pan, H. C. Zhang, Z. C. Shao, J. Y. Shi, Prediction protein homooligomer types by pseudo amino acid composition: Approached with an improved feature extraction and naive Bayes feature fusion, Amino Acids 30 (2006) 461-468. [16] Y. Gao, S. H. Shao, X. Xiao, Y. S. Ding, Y. S. Huang, Z. D. Huang, K. C. Chou, Using pseudo amino acid composition to predict protein subcellular location: approached with Lyapunov index, Bessel function, and Chebyshev filter, Amino Acids 28 (2005) 373376. [17] Y. Z. Guo, M. Li, M. Lu, Z. Wen, K. Wang, G. Li, J. Wu, Classifying G proteincoupled receptors and nuclear receptors based on protein power spectrum from fast Fourier transform, Amino Acids 30 (2006) 397-402. [18] H. Liu, M. Wang, K. C. Chou, Low-frequency Fourier spectrum for predicting membrane protein types, Biochem Biophys Res Commun 336 (2005) 737-739. [19] K. C. Chou, Prediction of protein subcellular locations by incorporating quasisequence-order effect, Biochemical & Biophysical Research Communications 278 (2000) 477-483. [20] K. C. Chou, A novel approach to predicting protein structural classes in a (20-1)-D amino acid composition space, Proteins: Structure, Function & Genetics 21 (1995) 319344. [21] K. C. Chou, C. T. Zhang, Predicting protein folding types by distance functions that make allowances for amino acid interactions, Journal of Biological Chemistry 269 (1994) 22014-22020. [22] K. C. Chou, C. T. Zhang, Review: Prediction of protein structural classes, Critical Reviews in Biochemistry and Molecular Biology 30 (1995) 275-349. [23] K. C. Chou, D. W. Elrod, Protein subcellular location prediction, Protein Engineering 12 (1999) 107-118. [24] K. C. Chou, Review: Prediction of protein structural classes and subcellular locations, Current Protein and Peptide Science 1 (2000) 171-208. [25] K. C. Chou, D. W. Elrod, Prediction of membrane protein types and subcellular locations, PROTEINS: Structure, Function, and Genetics 34 (1999) 137-153. [26] K. C. Chou, D. W. Elrod, Prediction of enzyme family classes, Journal of Proteome Research 2 (2003) 183-190. [27] K. C. Chou, Y. D. Cai, Predicting enzyme family class in a hybridization space, Protein Science 13 (2004) 2857-2863. [28] K. C. Chou, D. W. Elrod, Bioinformatical analysis of G-protein-coupled receptors, Journal of Proteome Research 1 (2002) 429-433. [29] K. C. Chou, Prediction of G-protein-coupled receptor classes, Journal of Proteome Research 4 (2005) 1413-1418. [30] K. C. Chou, Y. D. Cai, Prediction of protease types in a hybridization space, Biochem. Biophys. Res. Comm. 339 (2006) 1015-1020. [31] K. C. Chou, Y. D. Cai, Predicting protein-protein interactions from sequences in a hybridization space, Journal of Proteome Research 5 (2006) 316-322. [32] K. C. Chou, Y. D. Cai, W. Z. Zhong, Predicting networking couples for metabolic pathways of Arabidopsis, EXCLI Journal 5 (2006) 55-65. [33] K. C. Chou, Y. D. Cai, Predicting protein quaternary structure by pseudo amino acid composition, PROTEINS: Structure, Function, and Genetics 53 (2003) 282-289. [34] L.Kurić, The digital language of amino acids. Amino Acids (2007) 653-661.
240
ISSN:2229-6093 Lutvo Kurić, Int. J. Comp. Tech. Appl., Vol 2 (2), 216-241
[35] L.Kurić, The Atomic Genetic Code. J. Comput Sci Biol 2 (2009) 101-116. [36] L.Kurić, Mesure complexe des caracteristiques dynamiques de series temporelles “Journal de la Societe de statistique de Paris”- tome 127, No 2.1986. [37] L.Kurić, The Insulin Bio Code - Zero Frenquencies, GJMR Vol. 10 Issue 1: 15 May 2010. [38] L.Kurić, Molecular biocoding of insulin, Advances and Applications in Bioinformatics and Chemistry, Jul. 2010.p.45 – 58.
[39] L.Kurić, The Insulin Bio Code – Prima sequences, GJMR Vol. 1 Issue 1: 15 June 2010. [40] L.Kurić, ATOMIC HEMOGLOBIN CODE, GJMR Volume 10 Issue 2, October 2010. [41] L.Kurić, Language of Insulin Decoded:Discret code 1128, IJPBS JOURNAL, October 2010. [42] L.Kurić, „Measures of Bio Insulin Frequencies“, IJCSET (Volume 1. Issue 4. December, 2010) [43] Kurić L. The Insulin Bio Code - Standard Deviation, International Journal of Scientific and Engineering Research (IJSER) Nov 25, 2010 under ISSN 2229-5518. [44] Kurić L. Molecular biocoding of insulin – amino acid Gly, International Journal of Scientific and Engineering Research (IJSER) - Feb 2011 issue.
241