V. Kholin. School of Chemistry, V.N. Karazin Kharkiv National University, Svoboda sq. 4, Kharkiv, 61022 Ukraine. Received, December 7, 2011; in final form, ...
ISSN 1061�9348, Journal of Analytical Chemistry, 2013, Vol. 68, No. 11, pp. 942–948. © Pleiades Publishing, Ltd., 2013. Original Russian Text © A.V. Panteleimonov, Yu.V. Kholin, 2013, published in Zhurnal Analiticheskoi Khimii, 2013, Vol. 68, No. 11, pp. 1056–1062.
ARTICLES
Algorithm of Object Identification in Qualitative Chemical Analysis Based on Fuzzy Similarity Criteria A. V. Panteleimonov and Yu. V. Kholin School of Chemistry, V.N. Karazin Kharkiv National University, Svoboda sq. 4, Kharkiv, 61022 Ukraine Received, December 7, 2011; in final form, April 9, 2013
Abstract—An identification algorithm in qualitative chemical analysis is proposed based on the application of fuzzy (using the fuzzy set theory) similarity criteria. Examples of algorithm application to the identification of some objects are given; the stability of conclusions about the identification/nonidentification of objects to certain drawbacks is demonstrated. Keywords: qualitative chemical analysis, identification, fuzzy sets theory, similarity criteria DOI: 10.1134/S1061934813110099
Present�day qualitative analysis solves problems of three types, of detection, identification, and discrimi� nation [1]. The aim of detection is to conclude on the presence of an analyte in a test sample in the concen� tration exceeding a certain preset threshold value [2]. Identification implies a conclusion about the identity of the analyzed and known objects (or about the assignment of an analyte to a certain class) based on the correspondence of their properties [3]. Discrimi� nation is the classification of samples based on the use of a training set containing a priori information about the assignment of objects to certain classes [4]. One of the key approaches to identification is based on the evaluation of the similarity of the properties of analyte а and standard е [5–7]. The properties are, for example, retention times in chromatography, posi� tions or absorption band maxima, chemical shifts in NMR spectra, values of signals of multisensor systems “electronic nose” and “electronic tongue,” etc. [8– 13]. The conclusions “analyte coincides with the stan� dard” or “analyte differs from the standard” are made by comparing the measure of similarity between the standard and analyte with its critical value. The mea� sures of similarity can be different types of distances between the analyte and the standard or similarity coefficients (Minkowski distances in different metrics, Mahalanobis distances, Tanimoto coefficients) [14, 15]. If we assume that the properties are independent and that the distribution of their errors obeys the Gaussian law with the zero expectation and known variances, the simplest way to test the hypothesis about the coincidence (within measurement errors) of the standard and analyte properties is to study the statis� tics:
N
χ 2exp =
∑ξ , 2 i
(1)
i =1
where N is the total number of properties, ξi are weighed residuals:
ξ i = wi1 2(ai − ei ), i = 1,2,..., N , statistical weights:
wi =
1 , i = 1,2,..., N , s (ai ) 2
(2)
(3)
s 2(ai ) is variance of the i�th property of an analyte that should be either determined experimentally by the scatter of the results of replicate observations or speci� fied based on the specific features of the experiment and the characteristics of the measurement system. At the confidence level α the analyte is identified with the standard if the following inequality is held: χ 2exp < χ 2N ,α ,
(4)
where χ 2N ,α is the 100α percent point of the distribu� tion of χ2 for N degrees of freedom. Two types of errors can be met in the identification: an erroneous conclusion that the analyte is different from the standard or its misidentification. Usually errors of the first type are more hazardous by their aftereffects (for example, nonidentification of an ana� lyte with a hazardous toxicant); these are traditionally considered the first type errors [1]. Reliability, the key performance characteristics of the identification pro� cedure [16, 17] should be related to the low probability of the first type errors. As in traditional tests of statistical hypotheses, we can calculate the probabilities of the first and second type errors only when the probability density functions
942
ALGORITHM OF OBJECT IDENTIFICATION IN QUALITATIVE CHEMICAL ANALYSIS
of errors in the properties of the analyte and standard are known. This information is available only in the processing of model (imitated) data. Therefore, the reliability of identification is estimated in two approaches, statistical and a priori [3]. In the first approach, the analysts estimate the percent of errors in the identification of analytes that are certainly known either to coincide with the standards or to be different from them. In the second approach the probabilities of errors of the first and second type are calculated using a priori hypotheses on the properties of the analyte and the standard. Special attention to the requirements on improving the reliability of identification was given in the well�known monograph [3]. The lack of detailed information on errors in the properties of the analyte and the standard causes not only difficulties in estimating the reliability of identifi� cation. It is also important that, at the wide diversity of the used similarity criteria, the lack of the above infor� mation hinders the theoretical justification of the choice of one or another similarity criterion as the most powerful one in solving a particular identifica� tion problem. In this aspect of particular interest are criteria that do not imply the use of detailed informa� tion on the density functions of errors in the experi� mental properties of the analyte and the standard. The development of criteria based on the applica� tion of the fuzzy sets theory seems promising. The fuzzy sets theory is based on the concept of the person� alistic probability (possibility), different from the sta� tistical probability. The approach to identification based on the fuzzy sets theory can be illustrated by the following example. Let a functional group in an analyte molecule be iden� tified by comparing the experimentally found maxi� mum of the absorption band with the reference value presented in a spectral atlas (database). These values in almost no case coincide precisely; therefore, a certain range of acceptable values is specified instead of a pointwise reference value. The group is considered identified if the experimental value falls in the speci� fied range and considered absent if it lies outside the range. This dichotomous result is somewhat confus� ing, because the difference between the reference and measured values becomes not important if the latter value falls in the admissible range. More comprehen� sive information can be obtained using the key con� cept of the fuzzy sets theory, the membership function. The membership function of the analyte properties to the standard is defined so that, in the complete coinci� dence of the measured value with the reference one, it takes the value 1, whereas when the experimental value approaches the boundary of the admissible range, the value reduces to 0. In this case the higher the value of the membership function, the higher the probability of correct identification (reliability). Starting from the pioneer works [18, 19], the fuzzy sets theory has been successfully used to process the results of chemical analysis, including qualitative ones JOURNAL OF ANALYTICAL CHEMISTRY
Vol. 68
943
[20–26]. Even presence the of “rough errors” (outli� ers) in the data [27] does not prevent the development of numerous robust algorithms based on the fuzzy sets theory and stable to the deviations of the law of experimental error distribution from the normal law [28–31]. In this work we propose an algorithm of analyte identification based on the analysis of multidimen� sional data arrays and using approaches of the fuzzy sets theory. The advantages of the algorithm are its low sensitivity to the presence of rough errors in the data and minimum requirements to the a priori informa� tion on the properties of the results of measurements. Fuzzy similarity criteria. In this work the values of analyte and standard properties were considered as one�dimensional fuzzy numbers [32]. The results of measurements can be presented as a fuzzy number 1
using a fuzzification procedure [26]. To fuzzify the result of measurement р means to define a continuous membership function μ(x) on the interval x ∈ [ p − 0.5b; p + 0.5b] that takes the maximum value in the point р (μ(р) = 1) and uniformly decreases to μ = 0 in the points р ± 0.5b (note that the normalization requirement is not imposed on the function μ(x)). The parameter b we will name the admissible data range. Its value should be set based on the specific features of the experiment and the properties of the measurement system. The parameter b cannot be identified with the parameters of the range of statistical distributions. The simplest presentation of the result of measurement р as a fuzzy number is shown in Fig. 1. After fuzzification of the properties of the analyte and standard, one can evaluate the degree of member� ship in one set using such characteristic as the inter� section of two fuzzy numbers [18, 33]. In Fig. 2 mea� surements р1 and р2 belong to one set with the mem� bership degree 0.25. The presentation of the properties of the analyte and standard by fuzzy numbers can be used to imple� ment an identification procedure. We propose the following algorithm of analyte identification: 1. Set the admissible range of data b. 2. Fuzzify the values of analyte and standard prop� erties (р) by defining membership functions μі, i = 1, 2, …, N. In this work we have tested membership func� tions of four types (Table 1). 3. For the i�th property of the standard and the cor� responding property of the analyte calculate their membership functions in set µ iae as the intersection of fuzzy numbers. 4. Find the cardinal number of the set of member� ship functions µ iae:
( )
1 Note
that the unified fuzzification procedure does not exist. Several main types of the membership function were described in [33].
No. 11
2013
944
PANTELEIMONOV, KHOLIN
µ(x)
µ 1.0
1.0
0.8
0.8
0.6 0.6 0.4 0.4
µ(p1, p2) 0.2
0.2 0 0 p
p – 0.5b
p + 0.5b x
p1
p2
Scale of the results of measurements Fig. 2. Membership of the results of measurements p1 and p2 in one set.
Fig. 1. Possible representation of a result of measurement p as a fuzzy number with the admissible data range b.
N
= 1 N
µ sum
∑µ
i ae .
(5)
i =1
5. Compare the value of the criterion μsum with the critical value of μα and draw a conclusion about the identification of the analyte or about its difference with the standard. Calculation of the parameters of membership func� tions. The parameters of triangular (Simpson) and parabolic (quadratic) membership functions were cal� culated using the simplest algebraic transformations. Two bell�shaped membership functions were also used: Gaussian and Laplacian. The width parameter σG of the Gaussian membership function was specified based on following reasons. Let measurement р pos� sesses measurement function described by a Gaussian density distribution function (without imposing a nor� Table 1. Types of membership functions used in the study Type of membership function
Calculation equation
Simpson
µ ( x) = 1 − 2 p − x b
Quadratic
µ (x) = a0(x − p) + a1 x − p + a2
Gaussian
2 ⎛ ⎡ x − p⎤ ⎞ μ (x) = exp ⎜⎜ − 0.5 ⎢ G ⎥ ⎟⎟ ⎣ σ ⎦ ⎠ ⎝
Laplacian
⎛ x− p⎞ μ L ( x) = exp ⎜ − ⎟ ⎝ σL ⎠
S
Q
2
G
malization requirement). To determine the reference point, let us suppose that the possibility of the appear� ance of the result of measurement х outside the inter� val [р – 0.5b; р + 0.5b] is 0.003. If the results of mea� surements actually obey the Gaussian law, this value corresponds to six standard deviations (the width of the interval [р – 0.5b; р + 0.5b] is equal to 6σG). There� fore, (6) σG = b . 6 In calculations of the width parameter of the Laplacian function we found such values of σL at which the ordinates of the membership function μL coincides with the ordinates of the function μG in the points р – 0.5b and р + 0.5b; the parameter L (7) σ = b. 9 The difference in the width parameters of Gaussian and Laplacian membership functions is explained by the specific features of these functions, the use of the squared difference “mathematical expectation minus the result of measurement” and of the modulus of this difference. The shapes of membership functions are shown in Fig. 3. Critical values of fuzzy similarity criteria. The reli� ability of the identification of the analyte with the standard was taken equal to 100 × (1 – α)% if the fol� lowing inequality was satisfied
(8) µ sum > µ α, where α is the confidence level (the probability of an erroneous conclusion about the difference between the standard and the analyte). It is clear that μ0 = 0 and μ1 = 1. The other values of μα were estimated heuristi� cally.
JOURNAL OF ANALYTICAL CHEMISTRY
Vol. 68
No. 11
2013
ALGORITHM OF OBJECT IDENTIFICATION IN QUALITATIVE CHEMICAL ANALYSIS μ
μ
μQ
1.0
1.0
μS
0.8
0.8 0.6
0.6 0.4
μα
μG
μL
0.4
0.2 0
945
0.2 p – 0.5b p p + 0.5b Scale of the results of measurements
0
We considered unimodal symmetrical membership functions μ(х) and used an analogy between these functions and probability densities. For a specified probability α we found such value of r for the probabil� ity P for a random value x is P ( x ∈ [ p − 0.5b, p − r]) = α, where р is the mathematical expectation of x (at this value the membership function is equal to unity). The above probability was estimated as the ratio Ar/A, where Ar is the area under the curve of the membership function along the interval [ p − 0.5b, p − r], А is the area under the whole curve of the mem� bership function. The ordinate of the membership function in the point (р – r) (Table 2) was taken as μα. The procedure of determining μα is illustrated in Fig. 4. Tests of identification algorithm. The properties of the proposed identification algorithm were studied by a simulation technique. We tested the stability of the results to the presence of errors in the initial data with density distribution functions possessing tails “longer” than those for normal distributions. The positions of maxima of fourteen absorption bands of tert�butyl 2�[[(2,2,2�trichloroethaneimi� doyl)hydroxy]methyl] acrylate in the IR region were presented in the work [34]. These were considered as properties of standard е (Table 3). Into these proper� ties we introduced errors generated in the model of rough errors [35]:
deviation σL. Based on the data in Table 3, we sup� posed that the acceptable range of positions of absorp� tion bands can be taken equal to 1 cm–1 (the positions of bands 7, 10, and 11 were determined with the least precision); then σG = (1/6) cm–1, and σL = (1/9) cm–1. Random numbers distributed by the Gaussian and Laplacian laws were generated by the method of inverse functions [36]. The properties of analytes were calculated as ai = ei + εi. We obtained aΔ, Δ = 0, 25, 50, 75, and 100%. To all values of а we assigned equal standard deviations s(ai) = (1/6) cm–1. The results of analyte identification by the sets aΔ (Table 4) indicate that the approach based on the use of statistics χ2exp is not efficient for the identification of analytes with the standard in the pres� ence “rough errors” in the results of measurements, whereas fuzzy similarity criteria are stable to devia� tions of the law of experimental error distribution from the normal law. Raman spectra of water and ethanol mixtures mea� sured at different temperatures were reported in the work [37]. The results of measurements of the absor� Table 2. Critical values of fuzzy identification criteria Type of membership function α S
Q
G
L
0.10
0.46
0.64
0.45
0.22
0.05
0.32
0.48
0.27
0.12
0.01
0.16
0.23
0.09
0.03
(9)
where Δ is the intensity of rough errors (Δ varies from 0 to 100% at a step of 25%), εG are errors distributed by the Gaussian law with the zero average value and stan� dard deviation σG, εL are errors distributed by the Laplacian law with the zero average value and standard JOURNAL OF ANALYTICAL CHEMISTRY
p p – 0.5b p–r Scale of the results of measurements
Fig. 4. Determination of the critical value of a fuzzy iden� tification criterion.
Fig. 3. General view of membership functions.
ε = [(100 − Δ) ε G + Δε L ] 100,
Ar
Vol. 68
No. 11
2013
946
PANTELEIMONOV, KHOLIN
Table 3. Positions of absorption maxima of bands in IR spectrum of tert�butyl 2�[[(2,2,2�trichloroetaneimi� doyl)hydroxy]methyl]acrylate No. of absorption Maximum of absorp� band tion band, cm–1 1
3348.7
2
1738.5
3
1732.2
4
1727.9
5
1724
6
1719.7
7
1712
8
1707.3
9
1702.3
10
1697
11
1674
12
1669.7
13
1664.7
14
1645.2
Assignment νNH
νC=O
νC=N
νC=C
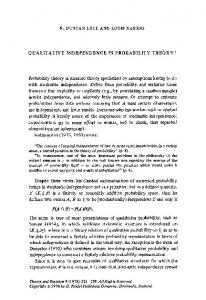
bances of solutions (I) as functions of wavelengths (λ) for ethanol at 30, 50 and 70°С (E30, E50, E70) and water at 30°С (W30) were extracted from the data array obtained [38] (Fig. 5). The data array contained measurements at 200 wavelengths, from 850 to 1049 nm at a step of 1 nm. The value of I varied in a wide range from 2 × 10⁶ to 2 × 101. Two identification problems were solved. In the first one, the properties of water were considered as reference and we evaluated the possibility of water identification with ethanol based on a comparison of the data array W30 with the arrays E30, E50, and E70. In the second problem the properties of E30 were con� sidered reference and the possibility of identifying the data of E50 and E70 with these properties was esti� mated. For each of the measured absorbance values Ii, i = 1, 2…, …, N, the acceptable data ranges were taken equal to bi = 0.1Ii and, in the calculations of the statis� tics of χ2exp the standard deviations were set as s(Ii) = 0.1Ii/6. The results of calculations indicate that all approaches to identification used this work ensure the discrimination of water and ethanol by the properties of Raman spectra (Table 5). The identification of eth� anol spectra measured at different temperatures ensures the use of fuzzy criteria with triangular and parabolic membership functions (Table 6). We believe that just these criteria should be use in the case when first class errors are particularly undesirable.
Table 4. Identification of characteristics of analytes (a) and the standard (e). The results satisfying the conditions (4) or (8) are given boldface Sets of properties Criterion
Critical value* (a0; e)
(a25; e)
(a50; e)
(a75; e)
(a100; e)
χ 2exp
23.7
13.3
19.8
27.5
36.7
47.1
µ sum
S
0.32
0.87
0.84
0.82
0.79
0.77
µ sum
Q
0.48
0.97
0.96
0.95
0.93
0.91
µ sum
G
0.27
0.90
0.86
0.82
0.78
0.75
L
0.12
0.60
0.56
0.53
0.50
0.48
µ sum
2
2
* Here and in Tables 5 and 6 for the statistics of χexp we give critical values of χ N, 0.05 and µ0.05 in the other cases. JOURNAL OF ANALYTICAL CHEMISTRY
Vol. 68
No. 11
2013
ALGORITHM OF OBJECT IDENTIFICATION IN QUALITATIVE CHEMICAL ANALYSIS Table 5. Results of ethanol identification with water by the data of Raman
947
Table 6. Results of ethanol identification by Raman spec� tra measured at different temperatures. The results satisfy� ing condition (8) are given boldface
Sets of properties Criterion
Critical value
(E30; W30)
(E50; W30)
(E70; W30)
Criterion
1.1 × 10⁷ 9.6 × 10⁶ 4.4 × 10⁶
Sets of properties (E30; E50) (E30; E70) (E50; E70)
χ 2exp
234
3.0 × 10⁴
9.4 × 10⁴
1.1 × 10⁴
µ sum
S
0.32
0.48
0.41
0.43
µ sum
Q
0.48
0.57
0.54
0.57
µ sum
G
0.27
0
0
0
L
0.12
0
0
0
χ 2exp
234
µ sum
S
0.32
0.02
0.02
0.02
µ Qsum
0.48
0.03
0.03
0.03
µ sum
G
0.27
0
0
0
L
0.12
0
0
0
µ sum
µ sum
Critical value
CONCLUSIONS
REFERENCES
We proposed an algorithm of analyte identification based on the analysis multiresponse data arrays and using approaches of the fuzzy sets theory. The advan� tages of the algorithm are its stability to presence of rough errors in the data and minimal requirements to the a priori information on the statistical properties of the results of measurements (one should only know the admissible data ranges for the analyte and stan� dard). The use of triangular and quadratic member� ship functions in the identification procedure is most expedient in the cases when an erroneous conclusion about the difference between the analyte and the stan� dard is particularly hazardous.
1. Milman, B.L., Trend. Anal. Chem., 2005, vol. 24, no. 6, p. 493. 2. Cardenas, S. and Valcarcel, M., Trend. Anal. Chem., 2005, vol. 24, no. 6, p. 477. 3. Vershinin, V.I., Derendyaev, B.G., and Lebedev, K.S., Komp’yuternaya identifikatsiya organicheskikh soedine� nii (Computational Identification of Organic Com� pounds), Moscow: Akademkniga, 2002. 4. Vlasov, Yu., Legin, A., Rudnitskaya, A., Di Natale, C., and D’Amico, A., Pure Appl. Chem., 2005, vol. 11, p. 1965. 5. Vershinin, V.I., Topchii, V.A., and Medvedovskaya, I.I., J. Anal. Chem., 2001, vol. 56, no. 4, p. 324. 6. Sokolova, O.V., Il’icheva, N.B., and Vershinin, V.I., Analitika i kontrol’, 2000, vol. 4, p. 363. 7. Vershinin, V.I., J. Anal. Chem., 2000, vol. 55, no. 5, p. 417. 8. Oliveri, P., Baldo, M.A., Daniele, S., and Forina, M., Anal. Bioanal. Chem., 2009, vol. 395, p. 1135. 9. Cotte, J.F., Casabianca, H., Chardon, S., Lheritier, J., and Grenier�Loustalot, M.F., Anal. Bioanal. Chem., 2004, vol. 380, p. 698. 10. Boffo, E.F., Tavares, L.A., Ferreira, M.M.C., and Fer� reira, A.G., LWT Food Sci. Technol., 2009, vol. 42, no. 9, p. 1455. 11. Bellorini, S., Strathmann, S., Baeten, V., Fumiere, O., Berben, G., Tirendi, S., and von Holst, C., Anal. Bioa� nal. Chem., 2005, vol. 382, p. 1073. 12. Li, H., Takahashi, Y., Kumagai, M., Fujiwara, K., Kikuchi, R., Yoshimura, N., Amano, T., and Ogawa, N., J. Near Infrared Spectrosc., 2009, vol. 17, no. 2, p. 69. 13. Shin, Y.S., Bang, K.H., In, D.S., Kim, O.T., Hyun, D.Y., Ahn, I.O., Bon, C.K., and Choi, H.K., Arch. Pharm. Res., 2007, vol. 30, no. 12, p. 1625.
I, rel. units 0.20
W30
0.15
0.10 E70 0.05 E30 0
850
900
950
1000
1050 λ, nm
Fig. 5. Raman spectra of water and ethanol. JOURNAL OF ANALYTICAL CHEMISTRY
Vol. 68
No. 11
2013
948
PANTELEIMONOV, KHOLIN
14. Cuadrado, M., Luque de Castro, M.D., and Gomez Nieto, M.A., Anal. Bioanal. Chem, 2005, vol. 381, p. 953. 15. Saito, S., Hirokawa, T., and Horimoto, K., J. Chem. Inf. Model, 2011, vol. 51, p. 61. 16. Eurachem/CITAC Guide: Quantifying Uncertainty in Analytical Measurement, Ellison, S.L.R., Rosslein, M., and Williams, A. Eds., Eurachem, 2000, 2nd Ed. 17. Mil’man, B.L. and Konopel’ko, L.A., J. Anal. Chem., 2004, vol. 59, no. 12, p. 1128. 18. Bandemer, H. and Otto, M., Microchim. Acta, 1986, vol. 89, p. 93. 19. Nazarenko, A.Yu., Sukhan, V.V., and Nazaren� ko, N.A., Zavod. Lab., 1991, vol. 57, no. 10, p. 63. 20. Linusson, A., Wold, S., and Norden, B., Chemom. Intell. Lab. Sys., 1998, vol. 44, p. 213. 21. Barbieri, P., Adami, G., Favretto, A., Lutman, A., Avoscan, W., and Reisenhofer, E., Anal. Chim. Acta, 2001, vol. 440, no. 2, p. 161. 22. Sârbu, C. and Pop, H.F., Talanta, 2005, vol. 65, p. 1215. 23. Sârbu, C. and Pop, H.F., Chemosphere, 2000, vol. 40, p. 513. 24. Iliev, B., Lindquist, M., Robertsson, L., and Wide, P., Fuzzy Sets and Systems, 2006, vol. 157, p. 1155. 25. Musee, N., Lorenzen, L., and Aldrich, C., J. Hazard. Mater., 2008, vol. 154, p. 1040. 26. Kholin, Yu.V., Nikitina, N.A., Panteleimonov, A.V., Reshetnyak, E.A., Bugaevskii, A.A., and Loginova, L.P., Metrologicheskie kharakteristiki meto� dik obnaruzheniya s binarnym otklikom (Metrological
27. 28. 29. 30. 31. 32. 33. 34. 35. 36. 37. 38.
Characteristics of Binary Response Techniques), Kharkov: Timchenko, 2008. Huber, P.J., Robust statistics, New York: Wiley, 1981. Pop, H.F. and Sârbu, C., Anal. Chem., 1996, vol. 771, no. 5. Sârbu, C. and Pop, H.F., Talanta, 2001, vol. 54, p. 125. Changa, Y.�H.O. and Ayyub, B.M., Fuzzy Sets and Sys� tems, 2001, vol. 119, p. 187. Nasrabadi, E., Mehdi, HashemiS., and Mehdi, GhateeA.N., Int. J. Uncertainty, Fuzziness and Knowl� edge�Based Systems, 2007, vol. 15, no. 4, p. 441. Zadeh, L.A., Fuzzy Sets and Their Application to Pattern Classification and Clustering Analysis. Classification and Clustering, New York: Academic Press, 1977. Orlovskii, S.A., Problemy prinyatiya reshenii pri nechet� koi iskhodnoi informatsii (Taking a Decision based on Fuzzy Underlying Data), Moscow: Nauka, 1981. Conti, C., Galeazzi, R., Giorgini, E., and Tosi, G., J. Mol. Struct., 2005, p. 417. Vuchkov, I., Boyadzhieva, L., and Solakov, E., Applied Linear Regression Analysis, Moscow: Finansy i Statis� tika, 1987. Bol’shev, L.N. and Smirnov, N.V., Tablitsy matemat� icheskoi statistiki (Tables of Mathematical Statistics), Moscow: Nauka, 1983. Wülfert, F., Kok, W.Th., and Smilde, A.K., Anal. Chem., 1998, vol. 70, no. 9, p. 1761. www.models.life.ku.dk/datasets. Accessed April, 06, 2013.
JOURNAL OF ANALYTICAL CHEMISTRY
Translated by E. Rykova
Vol. 68
No. 11
2013