MATEC Web of Conferences 170, 05006 (2018) https://doi.org/10.1051/matecconf/201817005006 SPbWOSCE-2017
Algorithms of data clustering in assessing the transport infrastructure of the region Olga Popova1*, and Elena Kuznetsova1 and Tatiana Sazonova2 1 Northern
(Arctic) Federal University 163000, Arkhangelsk, nab. Severnaya Dvina, 17, Russia Saint Petersburg State University of Architecture and Civil Engineering, Vtoraya Krasnoarmeiskaya str. 4. St. Petersburg, 190005, Russia 2
Abstract. The article presents the results of a complex analytical research of the region transport infrastructure. The authors propose the developed methodology for assessing the transport infrastructure in the region. The evaluation algorithm is based on consideration of individual municipal entities and their clustering by the Self-organizing maps. An example of approbation of the developed methodology in the Arkhangelsk region is given. As a result, we obtained a map showing clusters that unite municipal entities in homogeneous groups. Based on the results, a list of recommendations for the territorial development of each cluster was developed.
1 Introduction The transport infrastructure at the meso-level of the country ensures the integrity of the territory and economic space. The developed transport infrastructure of the region is an indispensable condition for the implementation of resource, economic, social potentials of the territory. Each sub-sovereign entity of the Russian Federation is characterized by certain features (territorial, climatic, demographic) that affect the development of transport infrastructure. Therefore, it is necessary to create transport infrastructure assessment technologies in every sub-sovereign entity. The bulk of modern publications in this field of knowledge is aimed at studying the transport system as a whole, and not just the transport infrastructure [1-4]. Authors, who in their studies consider a separate territory of the country [5-8], do not provide a common methodology for conducting such an assessment for other territories. The purpose of the study is to develop methods for assessing the state of transport infrastructure in the region by using cluster analysis. In accordance with the purpose, the main tasks of the study are formulated: - determination of the characteristics of the transport infrastructure at the regional level; - study of the essence of cluster analysis using the method of self-organizing maps; - development a theoretical model of clustering in the analytical platform "Deductor".
*
Corresponding author:
[email protected]
1
MATEC Web of Conferences 170, 05006 (2018) https://doi.org/10.1051/matecconf/201817005006 SPbWOSCE-2017
2 Materials and Methods The authors put forward the hypothesis that the level of development of transport infrastructure within the sub-sovereign entity of the federation is characterized by the level of development of the transport infrastructure of its municipal entities. Then, assessing the state of the transport infrastructure in each municipal entity and combining them into groups with similar characteristics will give a representation about the state of the transport system at the regional level. This determined the choice of the tool for data analysis - the clustering method. The study was carried out in several stages, including the definition of factors for the assessment of transport infrastructure, the collection and preparation of statistical data, the compilation of data using self-organizing maps, the normalization of results, aggregate analysis. 2.1 Determining the characteristics of transport infrastructure The transport infrastructure was divided into 4 directions, corresponding to the types of transport network. For each direction, a set of parameters was defined (Table 1), for which an estimate was made. These parameters describe the municipal entity, both in terms of accessibility and in terms of the availability of transport infrastructure facilities within the municipal entity. In a separate category, a characteristic of the concentration of inhabitants in the populated areas of the territory was given (Table 2). This parameter indirectly characterizes the transport infrastructure. It is important to note that the list of parameters can vary depending on the sub-sovereign entity of the Russian Federation. For example, one of the direction of analysis can be completely excluded from consideration. Also, the list of parameters can be supplemented by modes of transport that are not widely distributed, but can be important within a certain sub-sovereign entity. These types of transport can include space transport or horse-drawn transport. Table 1. Characteristics of the municipal transport infrastructure Transport sector
Parameters of the transport accessibility
Parameters of the availability of transport infrastructure facilities Presence of the federal highway in the municipal entity Presence of the regional highway in the municipal entity Distance from the federal highway to the farthest removed area of municipal entity
Highway transport
Distance from municipal entity to the regional center Distance from municipal entity to the federal district center Distance from municipal entity to the nearest sub-sovereign entity center Distance from municipal entity to the federal highway
Railway transport
Distance from municipal entity to the regional center Distance from municipal entity to the federal district center Distance from municipal entity to the nearest sub-sovereign entity center
Presence of the federal railway lines in the municipal entity Number of main railway stations
Waterborne transport
Distance from municipal entity to the regional center Distance from municipal entity to the federal district center Distance from municipal entity to the nearest sub-sovereign entity center Presence of the outlet to the sea lane
Presence of the navigable river waterway in the municipal entity Number of main river berthing facilities
Air
Distance from municipal entity to the
Presence of the airport in the municipal entity
2
Distance from the federal railway line to the farthest removed area of municipal entity
Presence of the seaport in the municipal entity
MATEC Web of Conferences 170, 05006 (2018) https://doi.org/10.1051/matecconf/201817005006 SPbWOSCE-2017 transport
regional center Distance from municipal entity to the federal district center
Distance from the airport to the farthest removed area of municipal entity
Distance from municipal entity to the nearest sub-sovereign entity center
Table 2. Population parameters in the municipal entities Characteristics of the municipal entities
Population parameters in the municipal entities
Numerical parameters
Relative parameters
Number of city of regional significance in the municipal entity Number of cities (except of regional significance) in the municipal entity Number of other populated locality in the municipal entity (population more than 3000) Number of other populated locality in the municipal entity (population less than 3000)
The proportion of the population of cities of the regional significance relative to the population of the municipal entity The proportion of the population of cities (except of regional significance) relative to the population of the municipal entity The proportion of the population of other populated locality (population more than 3000) relative to the population of the municipal entity The proportion of the population of other populated locality (population less than 3000) relative to the population of the municipal entity
The characteristics are listed in the tables with the following assumptions and limitations: 1) The characteristics "distance from municipal entity" - it is the average time in hours, necessary to overcome this distance of the appropriate mode of transport. 2) The characteristic of the presence of highway, railway lines and navigable river waterway – it is the length of the corresponding way section relative to the area of the municipal entity. 3) The characteristic "distance to the farthest removed area of municipal entity" from the highway, railway station or airport – it is a corresponding distance along a regional or local road. 2.2 Collection and normalization of statistical data To evaluate each municipal entity using the parameters given in Tables 1 and 2, the following sources of information were selected: 1. Area planning scheme of the sub-sovereign entity of the Russian Federation: in accordance with Article 9 of the Urban Planning Code of the Russian Federation [9], the documents on area planning should be made publicly available on the official website of the sub-sovereign entity. A detailed analysis of the planning scheme allows to determine the parameters of the presence of transport infrastructure objects. 2. Cartographic service "Google Maps": using the function "Get directions" [10] allows to identify the characteristics "distance to the municipal entity". The choice of this service was determined by the availability in it of the possibility to calculate the distance not only along highway, but also with the use of other modes of transport. 3. Website "The Federal Service of State Statistics" [11]: contains actual quantitative data on the population and areas of municipal entity. To further process data normalization is required, which includes: - formation of tables; - bringing the data in tables to a general view; - exclusion of values "falling out" from the sample (that is, having a large deviation from the average value from the data set).
3
MATEC Web of Conferences 170, 05006 (2018) https://doi.org/10.1051/matecconf/201817005006 SPbWOSCE-2017
It is convenient to format tables in MS Excel. But, if necessary, any other service can be used. Each filled table is the original data matrix. The number of tables corresponds to the number of estimated characteristics of the transport infrastructure. For further implementation of the cluster analysis, it is necessary to bring the data to a general view (that is, to convert the qualitative parameters into quantitative ones using encoding). The accepted data encoding conditions for each characteristic are given in the table 3. Тable 3. The data encoding conditions Estimated characteristic of the municipal entity
Encoding conditions
Highway transport
If the municipal entity is not available using highway transport, the parameter "distance" is assumed to be 100
Railway transport
If the municipal entity is not available using railway transport, the parameter "distance" is assumed to be 100
Waterborne transport
Air transport
If the municipal entity is not available by sea but is available by river, the parameter "distance" is assumed to be 2000 If the municipal entity is not available using water transport, the parameter "distance" is assumed to be 5000 If there are no direct flights to the municipal entity (only subsequent flights), the parameter "distance" is assumed to be 20 If there are no regular flights to the selected municipal entity (only periodic flights), the parameter "distance" is adopted 50 If the municipal entity is not available using air transport, the parameter "distance" is assumed to be 100
It is possible that the selected encoding conditions will not be valid for the region in question. For example, if the encoded data "unavailability of the municipal entity using highway transport" (100) becomes commensurate with the real distance to the municipal entity (in hours), then it is necessary to make changes to the code (replace 100 by 1000). This logic is applicable to all numerical parameters. In conclusion at this stage from the sample, it is necessary to exclude values that can negatively affect the accuracy of data processing. These are values that go beyond the range of normal distribution. 2.3 Development of an evaluation mechanism The task of the study is to divide the municipal entity into relatively homogeneous groups (clusters). To solve the task of data clustering, a neural network (self-organizing map, SOM) is chosen [12]. The advantage of SOM is that the learning result depends only on the structure of the input data. To implement the cluster analysis, the analytics platform "Deductor" is offered. This program allows to process the data matrix. It is required to load the data matrixes obtained earlier and apply the "Kohonen Map" processing tool to them in turn [13]. As a result, a new column of data (the cluster) appears in each table. At this stage, we have information about the affiliation of each municipal entity to a cluster for all evaluated characteristics. For further processing of the received information, it is convenient to present the data in the form of a table (the matrix of clustering results), where
4
MATEC Web of Conferences 170, 05006 (2018) https://doi.org/10.1051/matecconf/201817005006 SPbWOSCE-2017
the first column is a list of municipal entity, the top line is a list of evaluated characteristics with a cluster number (table 4). Table 4. An example of a matrix of clustering results The municipal entity (ME) title ME "А" ME "B" ME "C" ME "D" ME "E" …
Highway transport (cluster number) 0 3 2 0 1 …
Railway transport (cluster number) 0 2 1 2 2 …
Waterborne transport (cluster number) 1 1 0 1 2 …
Air transport (cluster number) 3 3 3 3 3 …
Population parameters in the municipal entities (cluster number) 1 2 2 2 1 …
At the final stage of the research, it is required to combine municipal entities into homogeneous clusters that have similar indicators for the evaluated characteristics. To do this, the clustering results matrix must be loaded into "Deductor" with the following corrections: - data can be loaded multiple times with repetitions in a random order to solve the problem of insufficient number of training samples for good statistical accuracy; - each column needs to be assigned significance in accordance with the importance of each characteristic within the region in question. As a result of the data processing, similar to the previously described process, a table with a new column (a cluster) will be obtained. It is necessary to sort the table for combine municipal entities with identical values of clusters in groups.
3 Results As an example, the study examined the Arkhangelsk region - one of the largest regions of Russia. Its area is 413103 square kilometers. The population is 1121813 people (as at 1 January 2017). Thus, the population density in the region is 2.72 people per square kilometer. For such large regions with a low population density, the most pressing issues are the development of transport links between municipal entities. Also, a unique feature of the region in question is the geographical location. The Arkhangelsk region is part of the Arctic zone; the Northern Sea Route passes through the main port of the region. Belonging the region to the Arctic zone also determines the climatic features - some parts of the municipal entities of the region in the autumn and spring are not available for some modes of transport. In general, there are four modes of transport network on the territory of the Arkhangelsk region: highway, railway, waterborne and air transport. Therefore, all the parameters given in Tables 1 and 2 above in the text of the paper will be evaluated. Statistical data will be obtained from the following sources: 1. Provision on territorial planning. One of its components is the transport infrastructure scheme developed by the Russian State Research and Design Institute of Urbanistics and approved by the Government of the Arkhangelsk Region [14]. 2. Cartographic service "Google Maps" [9] using the function "Get directions". Many times there were cases when the service was plotting 2 or more variants of the way by the roads. In each such case, the way was chosen, where most of the way passed by the federal and regional highway and there were no ferry crossings. 3. Official website of the Arkhangelsk Region Government [15]. Summarizing all the collected statistical data, 5 tables were obtained. The first column of each tables is a list of municipal entities. The top row of each tables is filled with the
5
MATEC Web of Conferences 170, 05006 (2018) https://doi.org/10.1051/matecconf/201817005006 SPbWOSCE-2017
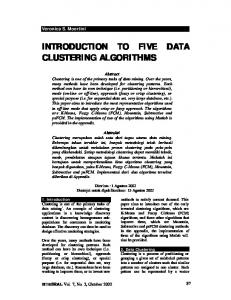
relevant characteristics of the transport infrastructure. The data was converted to a general view using encoding conditions (Table 3). For example, a fragment of one of the obtained matrices is given (Table 5). Then each data matrix was loaded into the "Deductor" and processed using the Kohonen Map tool. As an example, below are the results of processing the data matrix in the direction of analysis "railway transport" (Figure 1,2)
Fig.1. Comparison matrix for clusters in the analytics platform "Deductor"
Fig.2. Kohonen map in the analytics platform "Deductor"
By analogy, data matrixes "highway transport", "waterborne transport", "air transport", "population parameters" were processed. For convenience of presentation, the obtained results of cluster analysis are summarized in Table 5. Table 5. Result matrix of data clustering The municipal entity (ME) title ME "Velsky municipal district" ME "Verkhnetoemsky municipal district" ME "Vilegodsky municipal district" ME "Vinogradovsky municipal district" ME "Kargopolsky municipal district"
Highway transport (cluster number)
Railway transport (cluster number)
Waterborne transport (cluster number)
Air transport (cluster number)
Population parameters in the municipal entities (cluster number)
0
0
1
3
1
3
2
1
3
2
2
1
0
3
2
0
2
1
3
2
1
2
2
3
1
6
MATEC Web of Conferences 170, 05006 (2018) https://doi.org/10.1051/matecconf/201817005006 SPbWOSCE-2017 ME "Konoshsky municipal district" ME "Kotlasky municipal district" ME "Krasnoborsky municipal district" ME "Lenskiy municipal district" ME "Leshukonsky municipal district" ME "Mezensky municipal district" ME "Novaya Zemlya" ME «Nyandomsky municipal district" ME "Onezhsky municipal district" ME "Pinezhsky municipal district" ME "Plesetsky municipal district" ME "Primorsky municipal district" ME "Ustyansky municipal district" ME "Kholmogorsky municipal district" ME "Shenkursky municipal district"
2
0
2
3
2
1
0
0
0
0
3
2
1
3
2
3
1
0
3
2
3
2
1
2
2
3
2
0
1
1
4
2
0
1
3
2
0
2
3
1
3
0
0
2
0
3
1
1
3
2
3
0
2
3
0
3
1
0
0
0
3
0
2
3
2
0
1
1
3
2
0
2
1
3
1
In the end, the obtained the result matrix of clustering by the analisis directions (Table 5) is loaded into Deductor with the following additions: - the matrix is loaded 3 times, the rows are arranged in a random order [12]; - each column is given importance: 100% for highway and railway transport (in the Arkhangelsk region the bulk of freight and passenger traffic is carried out by this transport modes); 80% for the population parameters (since this is an indirect characteristic); 50% and 30% for water transport and air transport respectively (non-priority modes of transport in the region). The final result of data clustering is shown in Table 6. It sorts the data for the "Final cluster" column for the convenience of analysis. Table 6. Summary of data clustering The municipal entity (ME) title ME "Velsky municipal district" ME "Kotlasky municipal district" ME "Onezhsky municipal district" ME "Primorsky municipal district" ME "Vilegodsky municipal district" ME "Konoshsky municipal district" ME «Nyandomsky municipal district"
Highway transport (cluster number)
Railway transport (cluster number)
Waterborne transport (cluster number)
Air transport (cluster number)
Population parameters in the municipal entities (cluster number)
Final cluster
0
0
1
3
1
1
1
0
0
0
0
1
3
0
0
2
0
2
3
1
0
0
0
2
2
1
0
3
2
3
2
0
2
3
2
3
2
0
2
3
1
3
7
MATEC Web of Conferences 170, 05006 (2018) https://doi.org/10.1051/matecconf/201817005006 SPbWOSCE-2017 ME "Plesetsky municipal district" ME "Ustyansky municipal district" ME "Vinogradovsky municipal district" ME "Kargopolsky municipal district" ME "Kholmogorsky municipal district" ME "Shenkursky municipal district" ME "Verkhnetoemsky municipal district" ME "Krasnoborsky municipal district" ME "Lenskiy municipal district" ME "Leshukonsky municipal district" ME "Mezensky municipal district" ME "Novaya Zemlya" ME "Pinezhsky municipal district"
3
0
2
3
0
3
3
0
2
3
2
3
0
2
1
3
2
4
1
2
2
3
1
4
0
1
1
3
2
4
0
2
1
3
1
4
3
2
1
3
2
5
3
2
1
3
2
5
3
1
0
3
2
5
3
2
1
2
2
5
3
2
0
1
1
5
4
2
0
1
3
5
3
1
1
3
2
5
As a result, the division of the region into clusters, comprehensively describing the transport infrastructure in each of them, was obtained. The result is transferred to the map (Figure 3).
Fig. 3. The Arkhangelsk region map with cluster boundaries
8
MATEC Web of Conferences 170, 05006 (2018) https://doi.org/10.1051/matecconf/201817005006 SPbWOSCE-2017
A description of each cluster was made. A recommendations were given on the development of municipal entities in clusters. Table 7. Characteristics of clusters (Arkhangelsk region) No.
1
2
3
4
5
Cluster description - closer to the administrative centers of neighboring sub-sovereign entity of the Russian Federation than to Arkhangelsk; - more than 50% of the population lives in cities; - well accessible by the main modes of transport of the region (highway and railway), as well as by water transport - there are cities of regional value, in which more than 65% of the population is concentrated; - there are no federal highway, there are only regional highway; - well accessible by the main modes of transport of the region (highway and railway), as well as by water transport - there are no federal highway, there are only regional highway; - urban population is less than 40%; - there is a developed railway network - well developed highway transport network; - available only from Arkhangelsk using waterborne transport or not available at all; - 50% of the population live in cities or large rural settlements - there are no cities on cluster territory; - there are no federal highway, and regional highway are located so that the many areas of this cluster are anaccessible; - available using waterborne transport both from Arkhangelsk and from neighboring regions
Disadvantages of the cluster - distance from Arkhangelsk
- highway are located not evenly, so that many areas of this cluster are remote from roads and are difficult to access - there are no air transport; - there are no navigable sections of rivers, or these sections are within one municipal entity - there is no railway and air transport
almost completely absent railway and air transport
Recommendations for evolution of the cluster
the
This cluster territories are optimal for the organization of translogistics complexes regional and federal value due to good transport accessibility
Improvement of the regional transport network on the territories of this cluster will allow developing more actively inaccessible areas
It is possible to organize production plants and to form sales channels for products through a developed railway network
It is possible to create a special economic zones in rural settlements. It will stimulate the development of peripheral settlements
Development of tourism (on the sea and river lines) within the region, creation of tourist routes to other regions using the water transport network
4 Discussion It was hypothesized that an assessment of the region transport infrastructure is possible by assessing individual municipal entities in the region. This hypothesis is confirmed in practice. Within the framework of the research, a method has been developed for applying cluster analysis for dividing municipal entities of the region into homogeneous groups. Each group has similar characteristics by a set of parameters. The following issues are consistently disclosed in the article: 1. The transport infrastructure of the region is considered and its characteristics are determined. 2. Selection of information sources for the collection of statistical data was carried out. 3. The parameters of optimization statistical data are formulated.
9
MATEC Web of Conferences 170, 05006 (2018) https://doi.org/10.1051/matecconf/201817005006 SPbWOSCE-2017
4. A mechanism for processing statistical data in the platform "Deductor" has been developed. Among modern scientific research, the use of clustering methods is widespread. But the uniqueness of this research lies in the application of clustering in two stages.
Conclusions The developed method for assessing the state of the transport infrastructure has the following features: 1. The method is unified, applicable to any sub-sovereign entity of the Russian Federation. 2. The method is based on a cluster analysis algorithm using self-organizing maps (SOM). In this case, the result is directly dependent on the input data and does not require intervention in the calculations. 3. The method is of practical importance. It allows not only to assess the current state of the transport infrastructure in the region, but also gives a notion of the state of the transport infrastructure modes. The results of the application of the method can become the basis for the development of a list of recommendations for the transport infrastructure evolution in the region. This list can be part of the development strategy of the sub-sovereign entity of the Russian Federation.
References 1. 2. 3. 4. 5. 6. 7. 8. 9. 10. 11. 12. 13. 14. 15.
A.E. Auhadeev, P.P. Pavlov, R.D. Hamidullin, L.N. Kisneeva, Scientific problems of transport in Siberia and the Far East, 1, 106-108 (2014). V.G. Mamonova, Actual problems of modern science, 16, 230-238 (2010). S.A. Seliverstov, Ya.A. Seliverstov, Scientific and technical news SPBGPU, 2, 139161 (2015). N.G. Gubanov, E.Yu. Kubrin, Bulletin SamSTU, 4, 25-30, 2012. N.G. Mashinina, PhD thesis. (2009). V.A. Noskov, Innovations in railway transport, 1, 320-327 (2009). S.V. Sorokin, M.E. Kasper, Development of theory and practice of road transport, transport logistics, 1, 297-304 (2016). K.L. Terent'eva, V.I. Vagizova, Development of financial mechanisms for managing the regional transport system (Pub. house of Kazan University, Kazan, 2016). The Russian Federation Civil Code by November 01, 2017 (Prospekt, Moscow). Google maps [Online]. Aviable: https://www.google.ru/maps/. Federal State Statistics Service [Online]. Aviable: https:// http://www.gks.ru/. T. Kohonen, Self-organizing maps (BINOM, Moscow, 2012). Portal of artificial intelligence [Online]. Aviable: https:// http://neuronus.com/theory/961-nejronnye-seti-kokhonena/. On the approval of the Arkhangelsk region territorial planning scheme by December 25, 2012 No. 608-pp. The Arkhangelsk Region Goverment. Official website [Online]. Aviable: https://dvinaland.ru/.
10