Abstract. Purpose â The purpose of this paper is to provide algorithms of the automatic landmark extraction software program that are applicable for any torso ...
The current issue and full text archive of this journal is available at www.emeraldinsight.com/0955-6222.htm
Algorithms of the Automatic Landmark Identification for various torso shapes Hyunsook Han and Yunja Nam Clothing and Textile Department, Seoul National University, Seoul, South Korea, and
Automatic Landmark Identification 343 Received 28 December 2009 Accepted 4 April 2010
Su-Jeong Hwang Shin Apparel Design and Manufacturing Program, Texas Tech University, College of Human Science, Lubbock, Texas, USA Abstract Purpose – The purpose of this paper is to provide algorithms of the automatic landmark extraction software program that are applicable for any torso shape. Design/methodology/approach – In this study, Automatic Landmark Identification (AULID), an automatic landmark extraction software program, was developed to extract consistent landmark locations from any torso shape. A methodology of geometrical characteristics of the body surfaces around each landmark was used for the algorithms and implemented with Cþþ . The accuracy of the AULID was tested on various torso shapes. The verification methodology consisted of mean difference (MD), mean absolute differences (MAD), and one-way analysis of variance. Duncan test for multiple comparisons was used to evaluate the significant differences of MAD values among different torso groups. The MAD values were compared to the anthropometric survey allowable errors. Findings – The algorithms of AULID provided both accuracy and consistency of identifying landmarks on any body torso types. Originality/value – Most 3D body scanning systems often show landmark location errors when dealing with nonstandard body shapes. None of automatic landmark extraction software program provides consistency of identifying landmarks in various body shapes. However, algorithms of AULID, an automatic landmark extraction software program, in this study are only consistent definitions for identifying landmarks in any torso shape. Keywords Computational geometry, Measurement, Garment industry, South Korea Paper type Research paper
1. Introduction An automatic body measurement method using 3D body scan technology has been developed and utilized in the apparel industry. The accuracy of body measurements is very important for apparel manufacturers to develop patterns and sizing systems. However, most automatic body scan measurement methods often show landmark location errors when dealing with nonstandard body figures (Ashdown and Dunne, 2006). The error nullifies the advantage of saving time of automatic body measurement system and makes body scan measurements inaccurate. The inaccuracy causes ineffective sizing systems for apparel mass production. The accuracy and consistency of measurements are related to algorithms of the automatic landmark extraction that are usually predefined by 3D body scan developers.
International Journal of Clothing Science and Technology Vol. 22 No. 5, 2010 pp. 343-357 q Emerald Group Publishing Limited 0955-6222 DOI 10.1108/09556221011071811
IJCST 22,5
344
There are three approaches to automatic landmark extraction. The first approach is to identify a landmark by using geometric characteristics of body surfaces around each landmark. The second approach is to use statistical relationships among landmarks. The third approach is to match the individual body shape to a template with model landmarks marked on it. In the first approach, Dekker et al. (1999) detected landmarks based on the relation between the surface shape of each body part and other landmarks (Dekker et al. 1999). A limitation of the study (Dekker et al. 1999) was that only the accuracy of sizes was verified rather than the landmark positions. Wang et al. (2003) extracted feature points using fuzzy logic, and the feature points of the human body were extracted from the relation between the surface shape of each body part and other landmarks (Wang et al. 2003). However, Wang et al. (2003) did not verify the accuracy of the feature points because it focused on the generation of a body feature model. Leong et al. (2007) automatically detected landmarks through image processing and computer geometry by logically and mathematically analyzing feature point definitions (Leong et al. 2007). In the second approach, Azouz et al. (2006) used the learning of spatial relations among the characteristics of landmarks and body scan data with landmark sets (Azouz et al., 2006). The learned information was formalized into a pair-wise Markov network. Each node on the network corresponding to the landmark position was a random variable. An edge on the network indicated the positional relation between a pair of landmarks. In addition, Azouz et al. (2006) performed statistical inference on the Markov network for positioning landmarks. Azouz et al. (2006) verified the accuracy of the extracted landmarks. In the third approach, Au and Yuen (1999) recognized features by creating an original feature model. Landmarks were placed on a torso mannequin, and the original feature model is scanned. Then, each individual landmark in the original feature model was compared and matched to the point clouds in the scanned feature (Au and Yuen, 1999). These approaches had both advantages and disadvantages. However, none of them were verified for consistency of identifying landmarks in various body torso shapes. Thus, the purpose of this study is to provide algorithms of the automatic landmark extraction that are applicable for any torso shape. In this study, algorithms of an automatic landmark extraction software program, called as Automatic Landmark Identification (AULID) were developed and tested results to provide consistent landmark locations in any torso shape. 2. Research method 2.1 The 3D body scan subjects A data set of the 5th Size Korea was used in this study. The 5th Size Korea National Sizing Survey was conducted between 2003 and 2004 in South Korea. Subjects, 1,704 males and 1,718 females, were scanned with the WB4 body scanner (Cyberware Co. Ltd, USA) during the Size Korea National Sizing Survey. Table I shows rudimentary statistics on age, height, and BMI of the subjects. Subjects were age over 20 years old. Average of
Table I. Basic descriptive statistics of the subjects
Gender
Age
n
Mean height
Mean BMI
Male Female Total
20 , 69 20 , 69
1,704 1,718 3,422
1,693 mm 1,570 mm
24.2 22.9
men’s BMI was 24.2 and women’s BMI was 22.9. Average of men’s height was 1,693 mm and women’s height was 1,693 mm. A data set of 20 females and 20 males for each body figure group was selected from the 5th Size Korea and tested with algorithms of identifying landmarks in this study. Algorithms were developed for identifying five landmarks on the torso: nipples, underbust, waist, abdomen and hip point. Table II shows the landmarks were related to body figure factors such as body weight, waist shapes and abdomen shapes. Each body figure was defined with the body figure factors. Therefore, the factors were considered for identifying landmarks in each body figure group. For example, body figures were grouped by body weights to identify the landmarks of nipple and under bust because the breast shapes were related to obesity (Park and Sohn, 1996; Sohn and Ko, 2000; Cho and Sohn, 2001). The waist was determined with shapes of the waist (¼ body figure factor). The waist landmark was identified with a concave point on the torso from the front view, and the existence of concave point was different by the waist types (e.g. X or H type). The abdomen landmark was identified with the most forward protruded point on the abdomen shape from the side view. The existence of the protruded point was different by the abdomen types (e.g. protrusion type or flat type). The hip landmark was identified with the most backward protruded point from the side view. The body figures could not be grouped by the hip shapes since all body figures had the same protruded point.
Automatic Landmark Identification 345
2.2 Methodology of AULID In this study, AULID, an automatic landmark extraction software program, was developed to extract consistent landmark locations from any torso shape. A methodology of identifying landmarks was based on the maximum value, the minimum value, the radical slope changes in front view, the silhouettes, and the cross sections. In addition, statistical position of each landmark was used when any distinct geometrical feature and criterion was not identified. Algorithms of the AULID were implemented with Cþþ, and the following coordinate system was used: the leftward direction is to be the x-axis; the upward direction, the y-axis; and forward direction, the z-axis. The x, y, z value of a landmark referred to as width location, height location and depth location, respectively. 2.3 Verification of the accuracy and consistency The accuracy and consistency of the AULID were verified by evaluating both mean differences (MD) and mean absolute differences (MAD). The MD was calculated by subtracting the measure of each manually marked (MM) point from the measure of each corresponding automatically identified (AI) point. A positive (þ ) MD means that the measure of the AI point is larger. In addition, one-way analysis of variance and
Landmark
Body figure factors
Body figures
Nipple Underbust Waist Abdomen Hip
Body weight Body weight Waist shape Abdomen shape No
Underweight/normal weight/overweight Underweight/normal weight/overweight X type/H type Protrusion type/flat type No
Table II. Landmarks on the torso and Body figures
IJCST 22,5
346
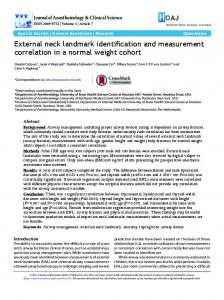
Duncan test for multiple comparisons were used to verify if there were any MAD value differences among body figure groups in the significance level set at p # 0.05 level (a . b . c). The MAD of each measurement was compared with the allowable technical errors in the anthropometric survey (ANSUR) Natick/TR-89-044 technical reference (Gordon et al. 1989). The allowable errors are calculated by the following formula where d1,2 are the difference between the first and second measurement (Gordon et al. 1989): sffiffiffiffiffiffiffiffiffiffiffiffi P 2 d1;2 2N 3. Automatic Landmark Identification 3.1 Bust point landmark identification (only for women) (1) Height location determination. The height of bust points were determined as a “first point where slop degree change from minus to plus value (PslopC) on the side silhouette (Sils) from up (armpit height) to down” (PslopC(Sils)). This approach was suitable for finding any slop degree changes on the bust points even on the flat bust shape and the protruded abdomen shape (Figure 1). The following algorithm for identifying height location was programmed in Cþ þ : Algorithm. The height of nipple Target zone, T ¼ {P[ fSils(set of side silhouette points, front): P.y0) then do ‘step 1’ again with next two points Else set the Pup.y as the height of nipple. (2) Width location determination. The width location of the nipple point on the side silhouette was significantly different from that of actual nipple point. Table III shows the differences in width position between the actual bust point and the side silhouette bust point. The actual nipple point were more outward than the side silhouette nipple point by 18-35 mm. The bust points of obese body type were more outward than that of
Bust point
Bust point
Max protruding point
Slop –
Max protruding point Slop +
Figure 1. Identifying bust points
Woman Man Maximum protruding point method (a)
Woman Slop change method (b)
normal type as shown in Figure 2. Table IV shows the mean ratio “distance between nipple points” to “bust width”. Therefore, this study adjusted the width position of the side silhouette bust point to be mean ratio position of “distance between nipple points” to “bust width” as shown in Table IV. The following algorithm for identifying width location was programmed in Cþ þ :
Automatic Landmark Identification
Algorithm. The width location of nipple Target zone, T ¼ {P[ fSecCnipple(set of front cross section points): P.y ¼ nipple.y} Step 1: Calculate the statistical width location of nipple, the nipple.x: nipple.x (right nipple) ¼ C.x – ((bust width £ mean ratio of ‘distance between nipple points’ to “bust width”)/2) where C.x is the x-coordinate of center point of fSecC. Step 2: Calculate the x-distance with the nipple.x for all points in T x-distance ¼ ABS(P.x-nipple.x) Set the point of minimum x-distance as the nipple point.
347
3.2 Underbust point identification (only for women) This study identified the underbust point on a sagittal section. Among many sagittal sections, we used a sagittal section (Ssbust) which passing through the nipple point because the underbust position had been clearly revealed at the section. The following algorithm for identifying the underbust point was programmed in Cþ þ , and the result shows in Figure 3. Body type (n) Low weight (10) Normal weight (10) Over weight (10)
Max protruding point Real BP at side view
Mean
SD
18.2 24.2 36.5
9.3 16.8 6.7
Table III. Difference in width position between actual nipple point and side silhouette nipple point (unit: mm)
Max protruding point at side view Real BP
Normal weight (a)
Over weight (b)
Figure 2. Difference in width position between actual nipple point and side silhouette nipple point
IJCST 22,5
348
Algorithm. The underbust point Target zone, T ¼ {P[ fSecS nipple (set of sagittal section points, front): Pu.y