Original Research published: 01 December 2016 doi: 10.3389/fneur.2016.00215
A
Ruth A. Wood1,2, Kuven K. Moodley1, Colin Lever 3, Ludovico Minati4,5 and Dennis Chan6* Department of Medicine, Brighton and Sussex Medical School, Falmer, UK, 2 Sainsbury Wellcome Centre for Neural Circuits and Behaviour, University College London, London, UK, 3 Department of Psychology, University of Durham, Durham, UK, 4 U.O. Direzione Scientifica, Fondazione IRCCS, Istituto Neurologico Carlo Besta, Milan, Italy, 5 Centro Interdipartimentale Mente/Cervello (CIMeC), Università di Trento, Trento, Italy, 6 Department of Clinical Neurosciences, University of Cambridge, Cambridge, UK 1
Edited by: Stefano L. Sensi, University of California, Irvine, USA Reviewed by: Valerio Frazzini, G. d’Annunzio University, Italy Nicola Mammarella, University of Chieti-Pescara, Italy Giorgia Committeri, University of Chieti-Pescara, Italy *Correspondence: Dennis Chan
[email protected] Specialty section: This article was submitted to Neurodegeneration, a section of the journal Frontiers in Neurology Received: 05 September 2016 Accepted: 15 November 2016 Published: 01 December 2016 Citation: Wood RA, Moodley KK, Lever C, Minati L and Chan D (2016) Allocentric Spatial Memory Testing Predicts Conversion from Mild Cognitive Impairment to Dementia: An Initial Proof-of-Concept Study. Front. Neurol. 7:215. doi: 10.3389/fneur.2016.00215
Frontiers in Neurology | www.frontiersin.org
The hippocampus is one of the first regions to exhibit neurodegeneration in Alzheimer’s disease (AD), and knowledge of its role in allocentric spatial memory may therefore aid early diagnosis of AD. The 4 Mountains Test (4MT) is a short and easily administered test of spatial memory based on the cognitive map theory of hippocampal function as derived from rodent single cell and behavioral studies. The 4MT has been shown in previous cross-sectional studies to be sensitive and specific for mild cognitive impairment (MCI) due to AD. This report describes the initial results of a longitudinal study testing the hypothesis that allocentric spatial memory is predictive of conversion from MCI to dementia. Fifteen patients with MCI underwent baseline testing on the 4MT in addition to CSF amyloid/tau biomarker studies, volumetric MRI and neuropsychological assessment including the Rey Auditory Verbal Learning Test (RAVLT) and Trail Making Test “B” (TMT-B). At 24 months, 9/15 patients had converted to AD dementia. The 4MT predicted conversion to AD with 93% accuracy (Cohen’s d = 2.52). The predictive accuracies of the comparator measures were as follows: CSF tau/β-amyloid1–42 ratio 92% (d = 1.81), RAVLT 64% (d = 0.41), TMT-B 78% (d = 1.56), and hippocampal volume 77% (d = 0.65). CSF tau levels were strongly negatively correlated with 4MT scores (r = −0.71). This proof-of-concept study provides initial support for the hypothesis that allocentric spatial memory testing is a predictive cognitive marker of hippocampal neurodegeneration in pre-dementia AD. The 4MT is a brief, non-invasive, straightforward spatial memory test and is therefore ideally suited for use in routine clinical diagnostic practice. This is of particular importance given the current unmet need for simple accurate diagnostic tests for early AD and the ongoing development of potential disease-modifying therapeutic agents, which may be more efficacious when given earlier in the disease course. By applying a test based on studies of hippocampal function in rodents to patient populations, this work represents the first step in the development of translatable biomarkers of hippocampal involvement in early AD for use in both animal models and human subjects. Keywords: Alzheimer’s disease, mild cognitive impairment, spatial memory, hippocampus, Four Mountains Test, dementia
1
December 2016 | Volume 7 | Article 215
Wood et al.
Spatial Memory Testing Predicts AD
INTRODUCTION
A variety of differing behavioral paradigms have been used to test spatial memory in humans. These include the Hidden Goal Task (26), which was designed as a human analog of the Morris water maze used for rodent studies (27) and assesses memory for hidden locations within a three meter diameter, circular, velvet arena, as well as a variety of tests of spatial navigation and memory using desktop-based virtual reality (VR) paradigms (22, 28). However, these paradigms have operational limitations that render them unsuitable for use as diagnostic tests for prodromal AD in routine clinical practice. The space requirements of the Hidden Goal Task effectively precludes its usage beyond research labs with dedicated testing arenas, whereas the various VR tests used to date require significant tester input and have been associated with nausea and disorientation when applied to older individuals with early AD (29). The 4 Mountains Test (4MT) is an easily administered test of allocentric spatial memory, which builds upon the defining characteristic of hippocampal spatial representation mentioned above in discussing rodent spatial neurons: the signaling of viewpoint-independent location. Essentially, the task requires that the participant correctly identifies a previously seen location, though the viewpoint the location is seen from has shifted from sample to test. The 4MT is specifically designed to be resistant to non-spatial strategies (30). The 4MT can be applied in paper form, with or as an iPad app, and requires little in the way of tester training or instructions (a video example of test administration is viewable via the open access article by Chan et al. (31)). The brevity of the test (around 10 minutes for the paper version and around 8 minutes for the app) is comparable to the MMSE (Mini Mental State Examination Test) (5), which is widely used worldwide as a short screening test for cognitive impairment but a poor predictor of progression from MCI to dementia (6). Following the initial use of this test to demonstrate that patients with focal hippocampal damage were selectively impaired on spatial memory testing, with relative preservation of spatial perception and non-spatial memory (30), performance on the 4MT has been found to discriminate between AD and non-AD dementia (29, 32) and between MCI patients with and without CSF biomarker evidence of underlying AD (33). Following on from these cross-sectional studies, this initial longitudinal study used the 4MT to test the primary hypothesis that allocentric spatial memory test performance is predictive of conversion from MCI to AD dementia. Additionally, the secondary hypothesis that spatial memory is a behavioral marker of hippocampal neurodegeneration in early AD was tested by correlating 4MT scores with levels of CSF total tau, representing a biomarker of neurodegeneration in AD.
The anticipated arrival of disease-modifying drugs for the treatment of Alzheimer’s disease (AD) places increased emphasis on the need to identify AD in its earliest stages, when such treatments may have greatest benefit in delaying or preventing the onset of dementia. It is now accepted that AD presents as mild cognitive impairment (MCI) in its prodromal stages (1), but MCI can also be caused by non-AD disorders with lower dementia risk, including non-neurodegenerative conditions such as anxiety. Identification of MCI on clinical grounds alone cannot discriminate between the various differing underlying etiologies (2, 3). The high prevalence of memory impairment in the aging population [in a US study, 27% of people over 65 years reported memory decline (4)] amplifies the difficulty of accurately differentiating MCI due to AD and highlights the need for diagnostic tests that are not only sensitive and specific for pre-dementia AD but are also non-invasive and usable in routine clinical diagnostic practice. This need is not met by current tests. Screening tests of global cognitive function of the kind typically used in primary care, such as the Mini-Mental State Examination (MMSE), have low diagnostic specificity and are poor predictors of conversion to dementia (5, 6). Tests of specific cognitive domains, such as episodic memory or attention, have higher diagnostic accuracy but require training in administration and scoring and are primarily used in specialist clinics (7–9). Biomarker-based tests, such as MRI measurements of hippocampal atrophy, amyloid-PET scanning, or CSF studies of amyloid/tau, have higher predictive accuracy (10–12), but the high cost, limited availability, and invasive nature of some tests preclude their usage in routine clinical practice. This need may be met by a hippocampus-dependent test of allocentric spatial memory. Neuropathological studies have shown the hippocampus to be one of the first brain regions affected in AD (13), and there is extensive evidence that the hippocampus is critically involved in spatial memory, with the demonstration in rodents of spatially related firing activity of hippocampal neurons “place cells” (14) and of a correlation between place cell activity and spatial memory (15). Importantly, in an open arena, hippocampal spatial neurons signal location in an allocentric reference frame. Place cells and boundary cells fire in a viewpoint-independent manner such that a given neuron fires at broadly similar rates whether the subject is, for instance, facing north or south as it moves through the neuron’s locational firing field (16, 17). This signaling of viewpoint-independent location is a defining characteristic of hippocampal spatial representation. A role for the human hippocampus in spatial memory is supported by pre-surgical depth electrode recordings of place-related firing of hippocampal neurons (18), and functional imaging studies showing activation of the hippocampus during spatial memory tasks (19, 20). Patients with focal hippocampal lesions show disproportionate impairment of spatial memory (21), and several studies have shown that spatial memory is impaired in patients with MCI and AD (22–25). However, to date, the ability of spatial memory testing to predict conversion from MCI to AD dementia has not been evaluated.
Frontiers in Neurology | www.frontiersin.org
MATERIALS AND METHODS Subjects
Fifteen patients with multiple domain MCI, all of whom presented with memory impairment, were recruited from the Cognitive Disorders Clinic, Hurstwood Park Neurological Centre, Haywards Heath, West Sussex, and from the East Sussex Memory Assessment Service. The baseline cross-sectional data on 13/15
2
December 2016 | Volume 7 | Article 215
Wood et al.
Spatial Memory Testing Predicts AD
TABLE 1 | Demographic variables and candidate predictors of conversion. Demographic or predictor variable
MCI – converters (mean ± SE)
Gender Age Years of education NART estimated IQ 4MT score TMT-B (s) RAVLT score MMSE score Total hippocampal volume (% of total intracranial volume) CSF total tau:β-amyloid1–42
2 F:7 M 71.7 ± 3.0 12.1 ± 0.7 106.6 ± 3.9 5.56 ± 0.71 132.55 ± 14.98 2.38 ± 0.62 27.89 ± 0.42 0.509 ± 0.037 3.57 ± 0.92
MCI – non-converters (mean ± SE)
Difference statistic
p-value*
Cohen’s d (effect size)
2 F:4 M 65.2 ± 3.4 11.0 ± 0.5 114.7 ± 3.4 10.17 ± 0.60 80.78 ± 8.36 3.33 ± 0.14 27.33 ± 0.21 0.577 ± 0.45 0.45 ± 0.09
X21 = 0.227 T13 = 1.41 T13 = 1.19 T10 = 1.50 T13 = 4.60 T12 = 2.74 T12 = 0.79 T13 = 1.01 T11 = 1.18 T11 = 3.12
0.63 0.18 0.26 0.16 0.0005 0.018 0.45 0.33 0.26 0.001
– 0.75 0.67 0.90 2.52 1.56 0.41 0.58 0.65 1.81
MCI, mild cognitive impairment; 4MT, Four Mountains Test; TMT-B, Trail Making Test B; RAVLT, Rey Auditory Verbal Learning Test; MMSE, Mini Mental State Examination. *Uncorrected p-values. Bold font signifies p-values that are statistically significant at the p 4 (35). The degree and extent of objective cognitive impairment was established at baseline in clinic using the Addenbrooke’s Cognitive Examination – Revised (36), which includes the MMSE (5), or the Queen Square Screening Test for Cognitive Deficits (©EK Warrington, 2003) plus the MMSE. As part of their diagnostic work-up 13/15 MCI subjects had CSF tested for AD biomarkers (CSF β-amyloid1–42, CSF tau, CSF tau/β-amyloid1–42 ratio) using industry standard ELISA assay kits (Innotest, Innogenetics, Ghent, Belgium) in accordance with the CSF collection protocol of the CSF sub-study of the Alzheimer’s disease Neuroimaging Initiative (ADNI) (37). The 13/15 subjects had MRI scans with T1-weighted volumetric MRI data acquired on a 1.5T Siemens Avanto scanner based at the Clinical Imaging Sciences Centre, Brighton and Sussex Medical School using a magnetization-prepared rapid-acquisition gradient-echo sequence to generate voxels of 1 mm × 1 mm × 1 mm. Total hippocampal volumes, corrected for total intracranial volume, were measured using the FSL(version 5.0)/FIRST tool (FMRIB, Oxford Centre for Functional Magnetic Resonance Imaging of the Brain, Oxford, UK) (38). In those instances where CSF and MRI investigations were not undertaken, this was due to patient preference. The study was undertaken in accordance with the Declaration of Helsinki and all participants provided written informed consent. Ethical approval was obtained from the UK Research Ethics Committee South East Coast – Brighton and Sussex (references 10/H1107/23 and 13/LO/0277).
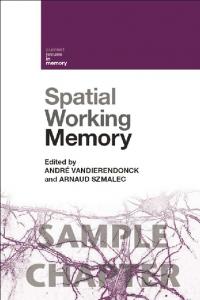
FIGURE 1 | The 4 Mountains Test. (A) A landscape containing four mountains is presented for 8 seconds and then removed. (B) After a 2 second delay, this landscape is re-presented, but from a rotated viewpoint, with three additional “foil” landscapes, in a delayed match-to-sample paradigm (the correct response is the bottom right image).
computer-generated landscapes, each containing images of four mountains arranged around the center of the landscape, in the form of printed color images within an A4-sized booklet. For each test item, a sample image is presented for eight seconds. After a two second delay, this image is re-presented, but from a different viewpoint, alongside three foil images of landscapes with differing topography (Figure 1). Fifteen test items were shown in all, and the total test duration was approximately ten minutes. Participants completed the 4MT alongside additional neuropsychological tests at entry into the study, with all testing undertaken during a single sitting.
Baseline Neuropsychological Testing
Subjects completed a battery of baseline neuropsychological tests, which included the National Adult Reading Test (NART) (39) to obtain an estimation of premorbid IQ in line with numerous other studies of cognitive function in clinical cohorts, and subtests of the Visual Object and Space Perception battery (40) for assessment of visual perception. The neuropsychological test battery also included two tests considered to be sensitive to early AD (1) and thus effective predictors of progression from MCI to AD dementia (8, 41). These are the Rey Auditory Verbal Learning Test [RAVLT; (42)], a test of episodic memory, and the Trail Making Test “B” (TMT-B) (43), a test probing several cognitive domains including attention, speed of information processing, and executive function. One subject declined to complete the tests outlined above due to anxiety.
The 4 Mountains Test
A full description of the 4MT is provided by Hartley et al. (30). The spatial memory test involves presentation of
Frontiers in Neurology | www.frontiersin.org
3
December 2016 | Volume 7 | Article 215
Wood et al.
Spatial Memory Testing Predicts AD
Determination of Conversion Status
plots and Shapiro–Wilk testing, and Levene’s test was applied to ensure homogeneity of variances. No corrections were necessary. Cohen’s d provided a measure of effect size, calculated by dividing the difference between the group means by their pooled SD (√[(StDevConverters2 + StDevNon-Converters2)/2]). The threshold criteria for binary classification (MCI converters vs. MCI non-converters) for each of the comparators were selected by maximizing Youden’s index J (Table 2), where Youden’s J = sensitivity + specificity − 1. The SE of the area under the curve (AUC) and the probability value of the AUC under the null hypothesis of AUC = 0.5 were calculated according to the method of DeLong et al. (46).
Comparison of 4MT Performance with Other Measures
RESULTS
Conversion status was determined 24 months after study enrollment by a neurologist (Kuven K. Moodley and Dennis Chan) in clinic, blinded to the baseline 4MT score, with the diagnosis of AD dementia made in accordance with the 2011 McKhann criteria (44). In addition to the presence of cognitive or behavioral symptoms involving at least two cognitive domains, conversion to AD dementia from MCI was based on decline in cognitive function on objective testing, new impairment in activities of daily living and loss of functional independence, representing changes from the time of the previously attributed MCI diagnosis.
Demographics
The ability of the 4MT to predict conversion from MCI to dementia was compared with five other measures. In addition to the RAVLT (delayed free recall score) and TMT-B (completion time), comparisons were made with the MMSE score, total hippocampal volume, and CSF tau/β-amyloid1–42 ratio. The rationale for these additional comparisons is as follows. While systematic reviews have shown that the predictive ability of the MMSE is low (6), it is part of the Preclinical Alzheimer Cognitive Composite (45) that is approved by the FDA for use as an outcome measure in trials of treatments aiming to delay progression from MCI to dementia. Furthermore, the MMSE is used widely as a cognitive screening test in UK memory services, notably in primary care, and as such the MMSE score has a bearing on the clinical management of patients presenting with MCI. Total hippocampal volume and CSF tau/β-amyloid1–42 ratio are included as comparators in view of their status as AD biomarkers included within research criteria for the diagnosis of MCI due to AD (1). These five comparator measures were analyzed as both continuous (Table 1) and binary (Table 2) variables.
There were no statistically significant differences between MCI converters and MCI non-converters in terms of age [71.7 ± 3.0 years (mean ± SE) vs. 65.2 ± 3.4, p = 0.18], years of education (12.1 ± 0.7 vs. 11.0 ± 0.5, p = 0.26), gender (2 F:7 M vs. 2 F:4 M, p = 0.634), or NART estimated IQ (106.6 ± 3.9 vs. 114.7 ± 3.4, p = 0.16). An ANCOVA of the 4MT score vs. converter status, with age and IQ as covariates, showed that their effect on conversion status was non-significant (p = 0.223, p = 0.332, respectively). The effect of 4MT score on conversion status remained significant even after accounting for group differences in age and IQ.
Correlation of 4MT Score with CSF AD Biomarkers
4MT scores were strongly negatively correlated with the levels of CSF total tau (r = −0.71, p = 0.007; Figure 2F) but did not correlate with the levels of CSF Aβ1–42 (r = 0.5, p = 0.08). CSF tau levels were negatively correlated with total hippocampal volume (r = −0.59, p = 0.04) in keeping with previous studies (47, 48), but after controlling for hippocampal volume, CSF tau still robustly predicted 4MT spatial memory score (n = 12, partial r = −0.84, p = 0.001). Thirteen subjects were available for the 4MT vs. hippocampal volume correlation. An r value ≥0.56 would be required for
Statistical Analysis
Data were analyzed using MedCalc Statistical Software version 15.6.1 (MedCalc Software bvba, Ostend, Belgium, 2015). For all continuous data, normality was assessed using normal probability TABLE 2 | Binary classification using candidate predictor variables. Criterion for Prevalence positive test (of converter positive (see methods) cases in sample, %) 4MT score TMT-B (s) RAVLT score MMSE score Total hippocampal volume (% of TIV) CSF total tau:β-amyloid1–42
Sensitivity (%)
Specificity PPV:NPV (%) (%)
Accuracy (%)
Youden’s J
AUC ± SE
AUC p-value (0.5 AUC = H0)
≤8 >102.6 ≤3 ≤27 ≤0.570
60 (n = 15) 57.1 (n = 14) 57.1 (n = 14) 60 (n = 15) 53.8 (n = 13)
100 62.5 75.0 44.4 85.7
83.3 100 50.0 33.3 66.7
90.0:100 100:66.7 66.7:60.0 50.0:28.6 75.0:80.0
93.3 78.6 64.3 40.0 76.9
0.833 0.625 0.250 −0.222 0.524
0.981 ± 0.022 0.875 ± 0.094 0.604 ± 0.168 0.370 ± 0.140 0.714 ± 0.163
0.5* 0.19
>0.821
53.8 (n = 13)
85.7
100
100:85.7
92.3
0.857
0.905 ± 0.100
0.0001
PPV, positive predictive value; NPV, negative predictive value; AUC, area under curve; TIV, total intracranial volume. *An exact p-value is not given here as the ROC curve for MMSE was below the chance line. Bold font signifies p-values that are statistically significant at the p