DIANNE MCCARTHY, MICHAEL DAVISON, AND PETER E. JENKINS. UNIVERSITY OF AUCKLAND, NEW ZEALAND. Six pigeons were trained to discriminate ...
JOURNAL OF THE EXPERIMENTAL ANALYSIS OF BEHAVIOR
1982, 37, 199-215
NUMBER
2(MARCH)
STIMULUS DISCRIMINABILITY IN FREE-OPERANT AND DISCRETE-TRIAL DETECTION PRO CED URES DIANNE MCCARTHY, MICHAEL DAVISON, AND PETER E. JENKINS UNIVERSITY OF AUCKLAND, NEW ZEALAND
Six pigeons were trained to discriminate different light intensities in four experimental procedures. Experiment 1 compared stimulus discriminability in a yes-no signal-detection task with discriminability measures obtained from two free-operant procedures. Discriminability estimates were significantly lower in the detection procedure. Experiment 2 showed this lowered discriminability to be a function of the delay between stimulus presentation and the availability of the choice-response keys in the standard detection task. In addition, reinforcement sensitivity was lowest when correct choice responses were intermittently, rather than continuously, reinforced. Key words: generalized matching law, signal-detection theory, multiple-concurrent schedules, stimulus discriminability, reinforcement, pecking, pigeons
An index of discrimination measures what a 1971) is well known. A second bias also occurs subject does in a particular situation relative when the stimuli are different and discriminato another situation. It is a measure that sum- ble, but responses in the presence of one of the marizes performance without attempting to stimuli are not reinforced. If component duradelineate the many sources of control over that tions are fixed, as they most often are, a source performance. Discrimination, as usually mea- of discrimination additional to the discriminasured in multiple schedules (e.g., the number tive stimuli exists in this situation. The delivor rate of responses emitted in the presence of ery of food provides unequivocal information one stimulus relative to the number or rate that the reinforced component is in effect, and emitted in the other stimulus), is a biased performance in this component following food measure of stimulus control. It is affected by delivery will be different from that preceding both stimulus difference and by biasing factors food delivery (Ferster & Skinner, 1957) unless such as reinforcement delivery and response- discrimination is perfect. This effect will again requirement differences. bias the measure of stimulus discrimination For example, the subject's performance may depending on the rate at which behavior is rebe affected by an inherent bias toward one of inforced: the higher the rate, the greater the the two stimuli (Baum, 1974) when the stimuli bias. If, instead of reinforcement and extincare different and discriminable. This source of tion schedules, two different reinforcementbias is not normally addressed and controlled rate schedules are used, the measure of disin studies of stimulus control, though its ex- crimination is profoundly affected by the istence (sometimes under the title of stimulus scheduling arrangements. With the same stimintensity dynamism; Blue, Sherman, & Pierrel, uli, the smaller the difference in the reinforcement schedules, the smaller will be the meaThis research was supported by the New Zealand sure of discrimination. The situation is clearly demonstrated by the Univ ersity Grants Committee for whose support we continue to be most grateful. We also thank the researchers application of the generalized matching law to and technicians who have kindly helped with data col- multiple-schedule performance (Lander & Irlection and animal care. Preliminary reports of this paper were discussed in McCarthy (1981) and McCarthy win, 1968; Lobb & Davison, 1977). With suband Davison (1981). Reprints may be obtained from scripts 1 and 2 referring to the two multipleDianne McCarthy, Department of Psychology, Univer- schedule components, and P and R referring sity of Auckland, Private Bag, Auckland, New Zealand, to response and reinforcement rates respecor Peter E. Jenkins, Psychology Department, Vassar College, Poughkeepsie, New York 12601. Peter E. Jen- tively, kins was a Post-Doctoral Fellow, University of Aucka l(og R + log c, (1) land, 1979-1980. 199 2
200
DIANNE McCARTHY et al.
where c is a measure of inherent bias, and a is a measure of the sensitivity of performance to changes in the reinforcement ratio (Baum, 1974). Although this equation is silent on the effects of changing the discriminative stimuli, it is evident that no reinforcement sensitivity (a = 0) must occur when the stimuli are identical (and no other source of discrimination is present). We may also assume that a increases with stimulus difference, as it does for concurrent-schedule performance (Miller, Saunders, & Bourland, 1980). Equation 1 describes the effects of both inherent bias and reinforcement on the measure of discrimination, with a reflecting the discriminability of the components
(Baum, 1974). Discriminability, as distinct from discrimination, is the maximal ability of a subject to discriminate between two stimuli (Davison & McCarthy, 1980). Signal-detection theory (Green & Swets, 1966) is an attempt to provide stimulus-discriminability measures that are not biased by reinforcement or payoff effects. The behavioral approach to signal-detection theory (Davison & Tustin, 1978) was extended by Davison and McCarthy (1980) in an attempt to provide measures of discriminability in multiple schedules. The application of their model to existing multiple-schedule literature was satisfactory only in the sense that it gave estimates of discriminability with small standard deviations. They were not able to show that discriminability measures from multiple schedules were the same in absolute value as those obtained from the usual signal-detection procedures. Further, most of the data that were available were from situations in which the reinforcement schedules may have contributed to the apparent discriminability of the stimuli. Finally, data from simple multiple schedules could not be used in their analyses because these do not provide sufficient data for independent estimates of discriminability and reinforcement bias. The required data are 2 by 2 matrices in which stimulus differences and reinforcement differences move the behavior orthogonally. Thus, the data that Davison and McCarthy analyzed were from multiple-concurrent schedules in which the multiple-schedule performance occurred in the presence of other, alternative, variable-interval (VI) schedules. A simple multiple schedule in which the same response produces reinforcement in both components does not produce orthogonal re-
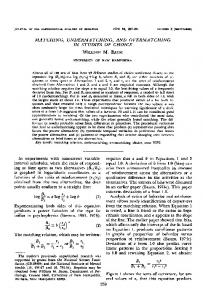
sponse changes when stimuli and reinforcement are changed. From Equation 1 above, increasing the reinforcement ratio, as well as increasing the stimulus differential, increases the measure log (P1/P2). Furthermore, the more different are the stimuli, the more the reinforcement differential may control the behavior. The experiments reported here were designed to determine whether absolute measures of discriminability obtained from signal-detection tasks were the same as those obtained from free-operant multiple-schedule procedures. The free-operant multiple-schedule procedures were nonstandard in two ways. First, to make stimulus effects orthogonal to reinforcement effects, the components in which responses were reinforced were arranged on two different response keys according to which discriminative stimulus was presented. Two keys were always available. When a reinforcement schedule was arranged on one key (for 'correct' responses), an extinction schedule was concurrently available on the other key (for 'error' responses). Second, in order that the components could not be discriminable on the basis of reinforcement, components ended with the first reinforcement, and a new component was selected using a probability gate. The schedules may, therefore, be rather generally designated multiple (concurrent reinforcement extinction) (concurrent extinction reinforcement) schedules with random component duration and random alternation. The data were analysed using a behavioral model of signal-detection performance (Davison & Tustin, 1978; McCarthy & Davison, 1979, 1980a, 1980b). This model assumes that the way behavior is allocated following (or during) each stimulus presentation is a function of the ratio of reinforcements for the two choice responses, the discriminability of the stimuli, and inherent bias toward one of the two choice responses. The matrix of events in a signal-detection, or a multiple-concurrent schedule procedure, is shown in Figure 1. S1 and S2 refer to the two discriminative stimuli and P1 and P2 to the two choice responses. The reinforced responses are P1 in the presence of (or, following) S1 (designated Pm), and P2 in the presence of S2 (Px). P3, and P. are errors resulting from emitting P2 in the presence of SI and emitting P1 in the presence of S2, respectively. The number of reinforcers, R, obtained for re-
FREE-OPERANT AND DISCRETE-TRIAL DETECTION PROCEDURES
RESPONSE IPP
w
x2
RFT
LI)
:D 7-
L/)
EXT
EXT
sponses are designated similarly. In the present experiments, where component durations were, on the average, equal, numbers and rates of responses are equivalent as are numbers and rates of reinforcements. Davison and Tustin (1978) suggested the following equations: in the presence of Si:
log (p)
=
ar
log (R)
presence = a,.
=
RFTl
Fig. 1. The matrix of events in a multiple-concurrent schedule arrangement and in a yes-no signal-detection task. One of two responses (P1, P,) is emitted during (or, following) the presentation of one of two stimuli (S1, S,). RFT denotes reinforcement, and EXT denotes extinction or nonreinforcement. The cells of the matrix in which responses and reinforcements are tallied are denoted by W, X, Y, and Z.
and, in the
(p) = (ar, - ar2)lg ( + 2 logd. (4) This equation, which McCarthy and Davison (1980a) termed a stimulus function, leads naturally to a point estimate of discriminability: log
log d
S2
log ( p)
Davison and Tustin showed, unbiased estimates of stimulus discriminability may be obtained by combining the above two equations. If ar, #7 a,. (McCarthy & Davison, 1980b), subtracting Equation 3 from Equation 2 gives: log (Pw
Si
+
log d + log c, (2)
of S2:
log (R) -log d + log c. (3)
The parameter log d is the discriminability of the stimuli, and this measure is equivalent to the signal-detection measure d' (Davison & Tiistin, 1978). Log c measures inherent bias, which may be toward either response alternative, and which is constant throughout the experiment (Baum, 1974). The parameters a,r and ar are the sensitivities of behavior to changes in reinforcement in the presence of each of the two stimuli. The log-response ratios in Equations 2 and 3 are clearly not direct estimates of discriminability and are affected also by reinforcement and inherent biases. However, as
201
[log
(a,
-a
(p) + log (P) (5)
R)log
(R)]
If ar, = ar2, the reinforcement term is zero in Equation 4, and an unbiased estimate of discriminability is given by: I log d = [log (p ) + log (l)] *
(6)
Adding Equations 2 and 3 provides a bias function (McCarthy & Davison, 1980a) that describes the effects on behavior of changing the reinforcement ratio for the two choice responses, and of inherent bias, independently of the discriminability of the stimuli: log (p)
+
log
(p) = (a,.
+ a,)log
+ 2 log c.
(R
)
(7)
The first experiment reported here measured stimulus discriminability under two multiple-concurrent schedule procedures, and compared these measures with estimates of discriminability obtained in a standard yes-no detection procedure. In addition, relative-reinforcement variation was carried out within each procedure. This manipulation allowed an assessment of procedural effects on the sensitivity of beha-vior allocation to relative-reinforcement allocation. EXPERIMENT
1
METHOD
Subjects Six experimentally naive homing pigeons, numnbered 61 to 66, served. All birds were maintained at 80% 15 g of their free-feeding
DIANNE McCARTHY et al.
202
body weights by providing supplementary food in the home cage after each experimental session. Water and grit were available at all times in the home cage. Apparatus Conventional solid-state control equipment was situated remotely from the standard sound-attenuated chamber. The chamber was fitted with an exhaust fan to mask external noise and contained three response keys 2 cm in diameter, 9.5 cm apart, and 24 cm from the grid floor. The center key remained darkened and inoperative throughout the experiment. The two side keys could be transilluminated by white, green, or red. The white lights could be varied between four preset luminances by a solid-state constant voltage device. The more intense luminances were 3.8 cd/in2 (left) and 20 cd/M2 (right). The less intense luminances were 2.51 cd/m2 (left) and 13.2 cd/M2 (right). Each key was operated, when illuminated, by a peck exceeding .1 N. A food magazine was situated 10 cm from the grid floor and equidistant between the two side keys. Reinforcement was 3-sec access to wheat. The only sources of illumination in the chamber were the key and magazine lights. Procedure After key pecking was autoshaped, the birds were trained on a selection of variable-interval
(VI) schedules on both side keys with various colors for 20 sessions. The birds were then trained to discriminate differences in light intensity under three procedures each containing five experimental conditions. The sequence of procedures and conditions and the number of sessions training given in each are shown in Table 1. The first two procedures were multiple-concurrent procedures in which the components were changed randomly after each reinforcement. The components were signaled by the presentation of two less-intense stimuli (i.e., 2.51 cd/im & 13.2 cd/M2), or two more-intense stimuli (i.e., 3.8 cd/m2 8c 20 cd/M2) on the left and right side keys respectively. These stimulus pairs were randomly presented on the left and right keys according to set probabilities (Table 1). Reinforced responses were left-key pecks during the less-intense stimulus pair (Stimulus 1), and right-key pecks during the more-intense stimulus pair (Stimulus 2). In Procedure A, after each reinforcement, one pair of stimuli was presented, and the appropriate VI timer was started. When the VI timer had timed an interval, a response on the appropriate key (left during the duller pair, right during the brighter pair) was reinforced, and a new trial began. Incorrect responses (right during the duller pair, left during the brighter pair) had no consequence, and the component remained in effect until a correct
Table 1 Sequence of procedures and conditions in Experiment 1 and the number of sessions training given in each. All times are in seconds. SPP refers to the probability of occurrence of Stimulus 1.
Procedure A. Multiple concurrent
Condition
1.
2. 3.
Reinforcement Stimulus 2 Stimulus I (bright) (dul) R L R L VI 60 Ext " pt n
Ext
VI 60
p
p
4. B.
Multiple concurrent
5. 6.
7. 8. C. Signal detection
9. 10. 11. 12. 13. 14. 15.
FR 1
Ext
p
Pp pp
FR 1
Ext pp,
FR 1
p
pp
p
p
Ext
Ext
FR 1
pp
p
pp
p
pp
P
"
SPP
Sessions
.5 .7
21
61
.1
20
.9 .3 .5
32 19 48
.8
37
.2 .7 .3 .5 .2 .7 .3 .9
21 26 20 32 16 34 14
52
FREE-OPERANT AND DISCRETE-TRIAL DETECTION PROCEDURES response was emitted and reinforced. The schedules were VI 60-sec on both the left and right keys. These schedules were formed from a randomization of the first 12 intervals of an arithmetic progression. Procedure A was, therefore, a multiple (concurrent VI 60-sec extinction) (concurrent extinction VI 60-sec) schedule, i.e., a mult (conc VI 60-sec Ext) (conc Ext VI 60-sec) schedule. In Procedure B, both schedules were changed from VI 60-sec to continuous reinforcement, such that every correct left- and right-key response was reinforced. Again, incorrect responses had no consequence. Procedure B was, therefore, a multiple (concurrent fixed-ratio 1 extinction) (concurrent extinction fixed-ratio 1) schedule, i.e., a mult (conc FR 1 Ext) (conc Ext FR 1) schedule. In both Procedures A and B, each component terminated in reinforcement, the probability generator was sampled, and a new trial (presentation of Stimulus 1 or Stimulus 2) began. Stimulus-presentation probability (SPP, or the probability of occurrence of the less-intense pair, Stimulus 1) was varied over five experimental conditions (Table 1). The obtained left/right reinforcement ratio covaried with SPP. In other words, when SPP was .9, 90% of the reinforcers were obtained for responses on the left key. Procedure C was an analogue of the standard discrete-trial signal-detection yes-no task. Initially, the two side keys were lit green. A peck on either the left or right key extinguished the two green lights and produced either the two less-intense (SI), or the two moreintense (S2) keylights for 3 sec according to set probabilities (Table 1). These intensities were identical to those of Procedures A and B. Following the 3-sec stimulus presentation, the white lights were extinguished, and the two keys lit red. Correct responses were left-key pecks following presentation of the less-intense stimulus pair, and right-key pecks following presentation of the more-intense stimulus pair. Every correct left- and right-key response produced a 3-sec magazine light and 3-sec access to wheat. Incorrect responses (left-key pecks following the brighter pair and right-key pecks following the duller pair) produced a 3-sec blackout during which all chamber lights were extinguished and responses were ineffective. A new trial (presentation of the two green keys) began after either food reinforcement or
203
blackout had been produced. Under this procedure, SPP (or, the probability of occurrence of the less-intense stimulus pair) was varied from .2 to .9 across five experimental conditions (Table 1). As in the first two procedures, the obtained reinforcement ratio covaried with SPP (McCarthy & Davison, 1979). In addition, a noncorrection procedure was employed. The probability of occurrence of the two stimulus pairs was independent of accuracy on the previous trial. For all three procedures, experimental sessions were conducted seven days a week. For Procedures A and B, daily training sessions continued until either 45 food reinforcers had been obtained or 45 minutes had elapsed. For Procedure C, they continued until either 50 food reinforcers had been obtained or 45 minutes had elapsed. Sessions began and ended in blackout. The data collected were the number of responses emitted and the number of food reinforcers obtained, on both the left and right keys on SI and on S2 trials. Experimental conditions were changed when all birds had met a specified stability criterion five, not necessarily consecutive, times. For Procedures A and B, the criterion required that the median relative number of responses emitted in Stimulus 2 over five sessions be within .05 of the median from the prior five sessions. For Procedure C, the criterion required that the median proportion of correct responses over five sessions be within .05 of the median from the prior five sessions. RESULTS
AND
DISCUSSION
The number of responses emitted and the number of food reinforcers obtained on the left and right keys during Stimulus 1 and Stimulus 2 are shown in Appendix I. These data were summed over the last five sessions of each experimental condition. However, when no responses were emitted in one or more of the four cells of the matrix (Figure 1) over the last five sessions, the data were summed over the last ten sessions of each condition. This procedure was employed to prevent the occurrence of infinite data points (see Appendix I). The data are presented in three sections. The first section deals with performance within each of the three procedures. The second and third sections evaluate stirnulus discriminability and reinforcement sensitivity, respectively, across procedures.
204
DIANNE McCARTHY et al.
Performance during Stimulus 1 and Stimulus 2 Responses were allocated between the left and right keys during SI and S2 presentations in all three procedures as shown in Figures 2, 3, and 4. Here, the logarithms of the ratio of the number of responses emitted on S, trials, log (P,G/Pa,), and on S2 trials, log (Pv/Pz), are shown as a function of the logarithm of the ratio of the number of reinforcers obtained for correct left- and right-key responses, log (R1l:/R2). These plots correspond with Equations 2 and 3, and the data used are those shown in Appendix I. Straight lines were fitted to all the data shown in Figures 2, 3, and 4 by the method of least squares, giving values of slope, a,I and a,. (the sensitivity of behavior to changes in reinforcement), and of intercept, log c log d (a combination of inherent bias and stimulus discriminability). The equations of the fitted lines, the standard deviations of slope and intercept, and the mean-square error are shown on the graphs. Figure 2 shows these data for Procedure A, the mult (conc VI 60-sec Ext) (conc Ext VI 60sec) schedule procedure. The slopes obtained for Equations 2 and 3 in this procedure were not significantly different from each other (Wilcoxon matched-pairs sign-rank, MPSR, test, p > .05; Marascuilo & McSweeney, 1977). The mean slope for S, performance (Equation 2), averaged across birds, was .29, and that for S2 performance (Equation 3) was .18. Estimates of stimulus discriminability, log d (one half the sum of the intercepts), ranged from 1.1 (Bird 64) to 1.87 (Bird 61), with a mean of 1.42 across the six birds. Figure 3 shows response allocation between the left and right keys during S, and S2 presentations for Procedure B, the mult (conc FR 1 Ext) (conc Ext FR 1) schedule procedure. Here, the slope obtained for Equation 2 was significantly greater than that obtained for Equation 3, i.e., a, > a,r., (Wilcoxon MPSR test, p < .05). The mean slope for Si performance, averaged across birds, was .82, and the mean slope for S2 performance was .26. Stimulus discriminability (log d) ranged from 1.09 (Bird 63) to 1.44 (Bird 61), with a mean of 1.26 across all birds. In Procedure C, an analogue of the discrete-
trial yes-no detection task, responses were allocated between the two keys as shown in Figure 4. The slopes of the fitted lines were not significantly different from each other. The mean slope for S, performance, averaged across birds, was .78, and that for S2 performance was .63. The mean discriminability value obtained from this fit was .91 (range .71 to 1.06), a lower value than that obtained for Procedures A and B. In all three procedures, all birds responded more on the left key during S1 presentations (shown by a positive intercept for Equation 2) and more on the right key during S2 presentations (a negative intercept for Equation 3). If the intercepts (log c ± log d) were equal in absolute value, inherent bias (log c) would be zero (Davison & Tustin, 1978). As Figures 2, 3, and 4 show, the intercepts were not equal, with all birds showing some inherent bias. Procedural Effects on Discriminability The above analysis showed that mean discriminability was lower in the signal-detection procedure than in either of the two multipleconcurrent procedures. That is, the intercepts of the fitted lines in Figure 4 (Procedure C), averaged across birds, were smaller, in absolute value, than those in either Figure 2 (Procedure A) or Figure 3 (Procedure B). To assess this difference more adequately, point estimates of stimulus discriminability were obtained for each bird and for each condition within procedures using Equation 5 with the data shown in Appendix I and the reinforcement sensitivity (a,) values obtained by fitting Equations 2 and 3. (Note: the unequal reinforcement-sensitivity values obtained for Equations 2 and 3 in Procedure B [Figure 3] necessitated the use of Equation 5 to estimate discriminability. Thus, to assess correctly procedural effects on discriminability, Equation 5 was used for all three procedures.) These discriminability estimates were averaged for each bird across conditions within each procedure. The mean discriminability estimates and their standard deviations are shown in Figure 5. Differences in the level of stimulus discriminability across procedures were assessed using Wilcoxon MPSR tests. The probabilities of the obtained differences were: A versus B, p = .109; A versus C, p = .016; B versus C, p = .016. With a set at .017 (i.e., .05/3, to control for probability pyramid-
FREE-OPERANT AND DISCRETE-TRIAL DETECTION PROCEDURES
24
0
_0
Y= .53X +1 37
0
16
(.21) (14) MSE -06
0
Y= -.07X+ 181
o
(.21) (14) 0.8 MSE .06
0~~~
61
0
- 62
Y= .23X-193
(.46) (.30)
0
.
MSE .27 B
I
0
-16
I
Y= .19X-1 06 (.33) (.23) MSE .15
. B
-2.4.1 m
-
Y= .17X+ 1.18
0
Y= .72X + 1.63
(.20) (.14)
0
( 56) (.37)
2.4
MSE .06
MSE 41
z
16
l~~
o
z
Ir-
0
Y= .03X-1 01
63
L/)
( 19) (.13) MSE 05
64
Y= .18X-1.32 (.20) (.13) MSE .05
8
L0
.
S
Lu
8 -1-6
r
0
-J
(32) (.21) 0 14 'MSE 1.65
0 0--~
0 0
(.33) (.19)
0
01{83 F
MSE .11
[65 *
0
0
0
I.1
it
-0-6
(.30) ( 18)
MSE 09
MSE .02 0
.661
Y= .26X - 1.18
66
Y=-.18X-1.07 (.13) (.09) :B
-1.2
1
y = .38X + 1 95
0
-0 83
0
0
2.4 Y= 02X+143
C
0
9
9
I
B
-1
0
0
8
LU
0
0 0
0
o
____j
I
-2
z
205
0.6
1.2
-0.6
.~~~ 0
0.6
1.2
LOG OBTAINED REINFORCEMENT RATIO Fig. 2. The logarithm of the ratio of the number of responses emitted on the left and right keys during S1 presentations (unfilled circles) and during S2 presentations (filled circles), as a function of the logarithm of the ratio of the number of reinforcements obtained on the left and right keys in Procedure A, the mult (conc VI 60-sec Ext) (conc Ext VI 60-sec) schedule. These plots correspond with Equations 2 and 3 fitted to the data shown in Appendix I. The best-fitting straight line by the method of least squares, its equation, the standard deviation of the parameters, and the mean square error are shown for each bird and for each stimulus.
206
DIANNE McCARTHY et al.
z
zL 0 z I-
z 0 L/) cL m
L) LJ
Q-
14
0
0.4
0O8-0O8
-04
0
LOG OBTAINED REINFORCEMENT RATIO Fig. 3. The logarithm of the ratio of the number of responses emitted on the left and right keys during S1 presentations (unfilled circles) and during S. presentations (filled circles), as a function of the logarithm of the ratio of the number of reinforcements obtained on the left and right keys in Procedure B, the mult (conc FR 1 Ext) (conc Ext FR 1) schedule. These plots correspond with Equations 2 and 3 fitted to the data shown in Appendix I. The best-fitting straight line, its equation, the standard deviation of the parameters, and the mean square error are shown for each bird and for each stimulus.
FREE-OPERANT AND DISCRETE-TRIAL DETECTION PROCEDURES
207
LI%, z
z
z 0
cx LU)
LI) z 0 0LA)
cxLUL
-J
LOG OBTAINED REINFORCEMENT RATIO Fig. 4. The logarithm of the ratio of the number of responses emitted on the left and right keys following S1 presentations (unfilled circles), and following S2 presentations (filled circles), as a function of the logarithm of the ratio of the number of reinforcements obtained on the left and right keys in Procedure C, the signal-detection procedure, of Experiment 1. These plots correspond with Equations 2 and 3 fitted to the data shown in Appendix I. The best-fitting straight line by the method of least squares, its equation, the standard deviation of the parameters, and the mean square error are shown for each bird and for each stimulus.
ing), discriminability was significantly lower in Procedure C (the signal-detection procedure) than in either Procedures A or B. There was no significant difference in discriminability between the two multiple-concurrent procedures. Procedural Effects on Reinfonrcement Sensitivity The sensitivity of behavior to changes in the obtained reinforcement ratio for each bird in
each procedure was obtained by fitting a leastsquares linear regression line between the logarithm of the left/right response ratio during S, plus the logarithm of the left/right response ratio during S2, [log (Pw/P.r) + log (PI/P,)], and the logarithm of the obtained left/right reinforcement ratio, log (R,1/Rz). This fit corresponds to the bias function (Equation 7). Using this equation, the overall value of reinforcement sensitivity (ar) is one half the ob-
208
DIANNE McCARTHY et al.
tained slopes. The a, values and their standard deviations are shown for each bird in each procedure in Figure 6. (The values shown are, of course, identical to those obtained from one half the sum of the slopes for SI and S2 performance shown in Figures 2, 3, and 4. The advantage of using the bias function here is that it also provides the standard deviations of the slope parameters.) Differences in reinforcement sensitivity across procedures were assessed using Wilcoxon MPSR tests. The probabilities of the obtained differences were: A versus B, p = .016; A versus C, p = .016; B versus C, p = .109. With ca set at .017 (i.e., .05/3), reinforcement sensitivity for Procedure A, the mult (conc VI 60-sec Ext) (conc Ext VI 60-sec) schedule, was significantly lower than that obtained for Procedures B and C at p < .05. The mean reinforcement sensitivities, averaged across procedures, were .20 (Procedure A), .55 (Procedure B), and .75 (Procedure C).
SUMMARY This experiment produced two findings. First, stimulus discriminability (log d) was significantly lower in the discrete-trial signal-detection procedure than in either of the two multiple-concurrent procedures. This result was seen in two ways: the difference in the point estimates of discriminability (Equation 5) in Figure 5 and the difference in the size of the intercepts for Equations 2 and 3 in Figures 2, 3, and 4. The second finding was the lowered reinforcement sensitivity in Procedure A. Interpretation of this latter result is deferred until the General Discussion. The implication of the discriminability measures is that the standard yes-no detection procedure that we used here may not accurately assess the asymptotic ability of the animals to discriminate the stimuli. One possible explanation for this finding relates to the conditions under which the subject emits the choice response. In the two multiple-concurrent procedures (Procedures A and B), the choice response is always emitted in the presence of the stimuli to be discriminated. That is, in methodological terms, the left and right keys are lit by either the duller or the brighter stimulus pair, and the subject's choice response is emitted on one of these two white keys. In the
signal-detection
63
64
: 1*0
A
B
C A B PROCEDURE
C
Fig. 5. Mean estimates of stimulus discriminability (log d), averaged across conditions in each procedure and for each bird in Experiment 1. These mean estimates were obtained using Equation 5 with the data shown in Appendix I. The vertical bars show ±1 standard deviation.
however, the choice response is emitted on one of the two red side keys presented to the animal following presentation of the bright or dull discriminative stimuli. Thus, in this latter procedure, there is a small temporal delay between the presentation of the stimuli and the availability of the choice response. To assess whether the lowered discriminability found in the signal-detection procedure of the present experiment could be due to the delay between stimulus presentation and the availability of the choice-response keys, we conducted a second experiment. The procedure was similar to Procedure C of Experiment 1, but the discriminative stimuli remained in effect until the animals had emitted the choice response. That is, like the two multiple-concurrent procedures, the choice response was now emitted in the presence of the stimuli to be discriminated. We hypothesized that, with this procedural modification, discriminability estimates would be significantly higher than those obtained in the standard detection procedure of the first procedure (Procedure C), experiment (Procedure C), but not signifi-
FREE-OPERANT AND DISCRETE-TRIAL DETECTION PROCEDURES
1. In the signal-detection procedure of Experi1 (Procedure C), these different intensity pairs were presented for 3 sec during which time all responses were ineffective. The white lights were then extinguished, and the two side keys lit red. Choice responses were then ment
62 C-
II I I I -L
-1.
64
F-
kiL
n L/)
1.(
66
Li U-
0.' uJ
A
B
209
C A B PROCEDURE
C
Fig. 6. Estimates of reinforcement sensitivity (a,) obtained using the bias function (Equation 7) with the data shown in Appendix I. These estimates are shown for each bird and for each procedure in Experiment 1. The vertical bars show ±1 standard deviation.
cantly different from those obtained in the two multiple-concurrent procedures. EXPERIMENT 2 METHOD Subjects
As for Experiment 1. Apparatus As for Experiment 1. Procedure A yes-no signal-detection design, similar to Procedure C of Experiment 1 was employed. Initially, the two side keys were lit green. A peck on either the left- or right-green key produced 3-sec blackout. On completion of the blackout, the left and right keys were lit either
by a duller stimulus pair (SI) or by a brighter stimulus pair (S2). The intensities of these stimuli were identical to those of Experiment
emitted on either the left or right keys following presentation of either stimulus pair. In the present experiment, by contrast, the intensity pairs remained in effect until a peck was made on either white side key. Correct responses were, then, left-key pecks during presentation of the duller stimulus pair and rightkey pecks during presentation of the brighter stimulus pair. Every correct left- and right-key response produced a 3-sec magazine light accompanied by 3-sec access to wheat. Incorrect responses (left-key pecks during the brighter pair, right-key pecks during the duller pair) produced 3-sec blackout during which all chamber lights were extinguished and responses were ineffective. The remainder of the procedure was identical to that of Procedure C in Experiment 1. The sequence of experimental conditions and the number of sessions training given in each are shown in Table 2. RESULTS The number of responses emitted and the number of food reinforcers obtained on the left and right keys during S, and S2 presentations are shown in Appendix II. These data were summed over the last five sessions of each experimental condition unless otherwise indicated. Performance during Stimulus 1 and Stimulus 2 was assessed by fitting Equations 2 and 3 to the data shown in Appendix II using leastsquares linear regression analyses. The slopes Table 2 Sequence of experimental conditions in Experiment 2 and the number of sessions training given in each. SPP refers to the probability of occurrence of Stimulus 1. Reinforcement Stimulus 1 Stimulus 2 Condition
1. 2. 3. 4.
L
R
L
R
FRI Ext Ext FRI p " pp" p,, p, , p " " " " p pp,.9 15 5. "Ip pp"
SPP
Sessions
.5
23 16 18 16
.3 .7 .2
DIANNE McCARTHY et al.
210
obtained for Equations 2 and 3 were not significantly different from each other. The mean slope for S, performance was .66, and that for S2 performance was .53. The mean estimate of discriminability (one half the sum of the intercepts) was 1.36, with a range of 1.07 (Bird 63) to 1.64 (Bird 66). Four of the birds showed an inherent bias toward responding on the left key and two birds toward the right key.
Stimulus Discriminability Point estimates of discriminability were obtained for each bird and for each condition using Equation 5 with the data shown in Appendix II. These estimates were averaged across conditions for each bird. The mean discriminability estimates and their standard deviations are shown for each bird in Table 3. These discriminability measures were compared with those obtained in Experiment 1 (Figure 5) using Wilcoxon MPSR tests. The probabilities of the obtained differences were: Experiment 2 versus A, p > .15; Experiment 2 versus B, p = .078; Experiment 2 versus C, p = .016. Again, with a set at .017 (i.e., .05/3), discriminability estimates in Experiment 2 were significantly higher than those obtained in the standard signal-detection task of Experiment 1 (Procedure C). There was no significant difference in stimulus discriminability between either Procedure A or Procedure B (the two multiple-concurrent procedures) and Experiment 2.
Reinforcement Sensitivity The sensitivity of behavior to changes in the obtained reinforcement ratio (ar) for each bird was obtained by fitting the bias function (Equation 7) using the data shown in AppenTable 3 Values of reinforcement sensitivity (a,) obtained from the bias function (Equation 7), and point estimates of discriminability (log d) obtained using Equation 5, averaged across conditions, for each bird in Experiment 2. The standard deviations (SD) of the parameters are shown in parentheses. Bird 61
ar .19
62 63 64
.86 .65
65 66
.58
.73 .79
(SD)
log d
(SD)
(.12) (.22)
1.43 1.38
(.26) (.10)
(.07)
1.06
(.08) (.12) (.38)
1.45 1.20 1.65
(.21) (.10) (.12) (.07)
dix II. Reinforcement sensitivities (one half the obtained slopes) and their standard deviations are shown in Table 3. (This analysis gave identical a, values to those obtained from one half the sum of the slopes of Equations 2 and 3, except for Birds 65 and 66 due to infinite data points in the bias-function analysis. However, the differences are small and in no way affect the overall results.) The reinforcement sensitivities shown in Table 3 were compared with those obtained in Experiment 1 (Figure 6) using Wilcoxon MPSR tests. The probabilities of the obtained differences were: Experiment 2 versus A, p = .016; Experiment 2 versus B, p = .078; Experiment 2 versus C, p = .50. With a set at .017 (i.e., .05/3), reinforcement sensitivity in the mult (conc VI 60-sec Ext) (conc Ext VI 60-sec) schedule of Experiment 1 (Procedure A) was significantly less than that obtained in Experiment 2. There was, however, no significant difference between reinforcement-sensitivity values for either the mult (conc FR 1 Ext) (conc Ext FR 1) schedule (Procedure B) or the standard signal-detection procedure (Procedure C) and Experiment 2.
GENERAL DISCUSSION The present experiments have shown that signal-detection measures of stimulus discriminability (log d) obtained from free-operant multiple-concurrent VI 60-sec Ext schedules (Procedure A) and from discrete-trial multiple-concurrent FR 1 Ext schedules (Procedure B) can provide the same estimate of stimulus discriminability as a discrete-trial yes-no signal-detection task. The results also demonstrated an important limitation to this conclusion: the three types of procedures gave similar discrimninability values only when the stimuli to be discriminated in the signal-detection task were present during the choice (Experiment 2). It appears that the small temporal delay between stimulus presentation and choice that occurred in the yes-no task of Experiment 1 was sufficient to degrade the measure of discriminability. This finding is consistent with recent research (McCarthy, 1981; McKenzie & White, Note 1), which reported estimates of log d (obtained using Equation 6) for delays of up to 30 sec between stimulus presentation and the choice response. If the term "discriminability"
FREE-OPERANT AND DISCRETE-TRIAL DETECTION PROCEDURES is reserved for asymptotic discrimination (delay = 0), Equation 6 is here used to measure discrimination or discriminability degraded by delay. The fall off in discrimination with increasing delay followed a negatively decelerated function, with even short delays sharply decreasing discrimination measures. Discriminability was high in the present experiments, and hence the small temporal delay between stimulus presentation and choice responding in the detection task of Experiment 1 (Procedure C) produced a noticeable loss of discriminability. Had we used a less discriminable pair of stimuli, we probably would not have seen a significant decrease in discriminability with such a short delay as the change in discriminability would be less than the general error variance. We -cannot formally eliminate an alternative explanation for the lower discriminability in the standard detection task of Experiment 1. It concerns the duration of the stimulus presentations, which averaged 60 seconds in Experiment 1, Procedure A, and only 3 seconds in Experiment 1, Procedure C. The correctness of this explanation for the discriminability findings in general depends on the durations of stimulus presentation in Experiment 1, Procedure B, and Experiment 2, on which we collected no data. However, informal observations of the experiment showed that the stimulus durations in these latter two procedures were very short and apparently less than in the detection task of Experiment 1 (Procedure C). It thus appears to us that a further investigation of this explanation would be unprofitable. In addition, it is worthwhile stressing that standard detection-theory noncorrection procedures (Experiment 1, Procedure C, and Experiment 2), and procedures that are more like correction procedures (Experiment 1, Procedures A and B) were used here, but that obtained discriminability differences were unrelated to these procedural differences. The finding of lowered discriminability is important for signal-detection research as well as for the measurement of stimulus effects in free-operant situations. First, this research has validated another method for estimating stimulus discriminability, one which is closely related to traditional methods of measuring stimulus effects in the experimental analysis of behavior. Unfortunately, standard multipleschedule data cannot be used to estimate log d
211
because, in this schedule arrangement, reinforcement and stimulus effects on behavior are not orthogonal. Second, attention has been drawn to a potential problem with the yes-no detection procedure for estimating the discriminability of highly discriminable stimuli. Procedurally, it would seem important to maintain the stimulus presentation during the choice response in order to measure true asymptotic discriminability. It is interesting to note at this point that discriminability was not affected by the very large increase in reinforcement rate between Procedure A of Experiment 1, and Experiment 2. This result is quite contrary to the fall in discriminability with decreasing reinforcement rates or probabilities reported by Nevin, Jenkins, Whittaker, and Yarensky (1982). We offer no reconcilitation of these results here. The sensitivity of behavior allocation to reinforcement allocation was significantly lower in the multiple-concurrent VI 60-sec Ext schedule procedure (Procedure A) than in any of the other procedures. This procedure differed from the others in two ways: first, stimulus presentations averaged 60 seconds in duration and many responses, rather than a single response, were emitted during each presentation. Second, the overall rate of reinforcement was much lower in Procedure A than in any of the other procedures. Taking the first point, the arrangement in Procedure A was a multiple schedule with component durations averaging 60 seconds. In all other procedures, trial durations were short, and the procedures were more similar to concurrent scheduling (Killeen, 1972). Multiple-schedule performances do generally show a lower reinforcement sensitivity (.33 to .45, Lander & Irwin, 1968; Lobb & Davison, 1977) than do concurrent schedules. The difference in reinforcement sensitivity found here is, therefore, consistent with that literature. Regarding the second point, reinforcement sensitivity has been shown not to vary with overall reinforcement rates in concurrent VI VI schedules (Fantino, Squires, Delbruck, & Peterson, 1972). But, research carried out using multiple schedules (Herrnstein & Loveland, 1974) implies that reinforcement sensitivity should be greater at lower obtainedreinforcement rates quite the opposite from the result found here. We favor an explanation of the different reinforcement sensitivities between procedures in terms of the differing
DIANNE McCARTHY et al.
212
multiple and concurrent sensitivities to reinforcement.
REFERENCE NOTE 1. McKenzie, J., & White, K. G. Trace stimulus control. Paper presented at the meeting of the New Zealand Psychological Society, Dunedin, August, 1980.
REFERENCES Baum, W. M. On two types of deviation from the matching law: Bias and undermatching. Journal of the Experimental Analysis of Behavior, 1974, 22,
231-242. Blue, S., Sherman, J. G., & Pierrel, R. Differential responding as a function of auditory stimulus intensity without differential reinforcement. Journal of the Experimental Analysis of Behavior, 1971, 15,
371-377. Davison, M., & McCarthy, D. Reinforcement for errors in a signal-detection procedure. Journal of the Experimental Analysis of Behavior, 1980, 34, 35-47. Davison, M. C., & Tustin, R. D. The relation between the generalized matching law and signal-detection theory. Journal of the Experimental Analysis of Behavior, 1978, 29, 331-336. Fantino, E., Squires, N., Delbruck, N., & Peterson, C. Choice behavior and the accessibility of the reinforcer. Journal of the Experimental Analysis of Behavior, 1972, 18, 35-43. Ferster, C. B., & Skinner, B. F. Schedules of reinforcement. New York: Appleton-Century-Crofts, 1957. Green, D. M., & Swets, J. A. Signal detection theory and psychophysics. New York: Wiley, 1966. Herrnstein, R. J., & Loveland, D. H. Hunger and contrast in a multiple schedule. Journal of the Experimental Analysis of Behavior, 1974, 21, 511-517. Killeen, P. A yoked-chamber comparison of concurrent and multiple schedules. Journal of the Experimental Analysis of Behavior, 1972, 18, 13-22.
Lander, D. G., & Irwin, R. J. Multiple schedules: Effects of the distribution of reinforcements between components on the distribution of responses between components. Journal of the Experimental Analysis of Behavior, 1968, 11, 517-524. Lobb, B., & Davison, M. C. Multiple and concurrent schedule performance: Independence from concurrent and successive schedule contexts. Journal of the Experimental Analysis of Behavior, 1977, 28, 27-39. Marascuilo, L. A., & McSweeney, M. Nonparametric and distribution-free methods for the social sciences. Monterey, Cal.: Brooks/Cole Publishing Co., 1977. McCarthy, D. Toward a unification of psychophysical and behavioral research. New Zealand Psychologist, 1981, 10, 2-14. McCarthy, D., & Davison, M. Signal probability, reinforcement and signal detection. Journal of the Experimental Analysis of Behavior, 1979, 32, 373-386. McCarthy, D., & Davison, M. On the discriminability of stimulus duration. Journal of the Experimental Analysis of Behavior, 1980, 33, 187-211. (a) McCarthy, D., & Davison, M. Independence of sensitivity to relative reinforcement rate and discriminability in signal detection. Journal of the Experimental Analysis of Behavior, 1980, 34, 273-284. (b) McCarthy, D., & Davison, M. Matching and signal detection. In M. L. Commons & J. A. Nevin (Eds.), Quantitative analyses of behavior (Vol. 1). Discriminative properties of reinforcement schedules. Cambridge, Mass.: Ballinger, 1981. Miller, J. T., Saunders, S. S., & Bourland, G. The role of stimulus disparity in concurrently available reinforcement schedules. Animal Learning and Behavior, 1980, 8, 635-641. Nevin, J. A., Jenkins, P., Whittaker, S., & Yarensky, P. Reinforcement contingencies and signal detection. Journal of the Experimental Analysis of Behavior, 1982, 37, 65-79.
Received July 23,1981 Final acceptance October 13, 1981
FREE-OPERANT AND DISCRETE-TRIAL DETECTION PROCEDURES
213
APPENDIX I Number of responses emitted, and number of food reinforcements obtained, on the left and right keys during Stimulus 1 and Stimulus 2 in Experiment 1. The data are summed over the last five sessions of each condition, unless indicated otherwise.
Procedure
A.
Condition
1.
2.
3.
4.
5.
B.
6.
7.
8.
9.
Bird
61 62 63 64 65 66 61 62 63 64 65 66 61 62 63 64 65 66 61 62 63 64 65 66 61 62 63 64 65 66 61 62 63 64* 65 66 61
62 63 64 65 66* 61* 62 63 64 65 66
Responses Stimulus 2 Stimulus I L R L R
3829 3902 3301 5467 3126 3501 5227 4028 3054 5516 951 4055 1095 477 699 726 580 948 7020 7045 5550 7949 3025 5674 2506 2224 1869 2142 1390 2263 99 103 106 213 104 111 355 177 176 176 174 353 101
65
40 25 31 29 26 157 156 154 145 157
66
161
61 62 63 64
24 78 5 199 46 84 88 211 157 344 111 57 26 51 193 148 46 33 218 64 32 535 107 20 31 304 92 85 20 9 10 4 6
3 16 6 17 3 4 3 2 12 15 13 10
7 10
17 11 3
2 9
7 4
4 166 88 349 303 275 128 218 65 732 63 437 89 862 120 846 562 259 13 170 58 54 77 42 24 77 399 471 409 149 4 5 6 6 10 10 1 6 11
2 4 4 4 5 16 10 13 3 l 10 11 3 8 4
2498 2913 2625 5262 2692 2399 2070 1626 1522 2735 1681 1798 5791 4715 5764 8929 4203 7331 477 788 729 770 932 977 3623 4755 3643 6234 3723 4569 117 118 112 238 100 103 78 39 34 44 48 81 331 167 174 177 173
179 61 61 63
73 58 61
Reinforcements R L 129 112 110 115 113 123 155 158 160 156 158 162 25 20 25 20 16 24 208 206 205 206 195 193 78 63 63 63 67 77 99 103 106 213 104 111 355 177 '176 176 174 353 101
40 25 31 29 26 157 156 154 145 157 161
96 113 115 110
112 102 70 67 65 69 67 63 200 205 200 205 209 201 17 19 20 19 30 32 146 162 162 162 158 148 117 118 112 238 100 103 78 39 34 44 48 81 331 167 174 177 173 179 61 61 63
73 58 61
DIANNE McCARTHY et al.
214
Procedure
Condition
Bird
Responses Stimulus 2 Stimulus 1 L R L R
128 61 79 62 46 63 66 64 37 65 80 66 136 61 11. C. 109 62 121 63 124 64 141 65 128 66 39 61 12. 46 62 16 63 28 64 12 65 50 66 172 61 13. 182 62 166 63 151 64 193 65 164 66 61 57 14. 56 62 40 63 64 113 46 65 73 66 61 15. 235 232 62 241 63 64 223 65 222 497 66* Data are summed over the last ten sessions of each condition. 10.
10 4
17 4 30 4 7 40 32 12 20 24 13 20 38 23 42 22 11 6
23 59
4 2 4 8 4 16
17 19 17 13 51 19 19 18 7 8 3 11 5 9 8 3
12 8 15
17
28 55 50 50
11 5 1 12 4 15 5 13 4 10 41
5 4 8 1 9 8 4
11
7
Reinforcements R L
318 145 163 152
128
318
79 46 66
145 163 152
159 130 114 141 129 126 109 122 211 204 234 222 238 200 78 68 84 99 57 86 177 194 210 380 203
37
159
80 136
130 114 141 129 126 109 122 211 204
109 121
124 141 128 39 46 16 28 12
50 172 182 166 151
193 164 57 56 40
234 222 238 200 78 68 84
99 57 86
177 194
113 46
210 380 203
170
73
170
15 18 9 27 28 3
235 232 241 223 222 497
15 18 9 27 28 3
FREE-OPERANT AND DISCRETE-TRIAL DETECTION PROCEDURES
215
APPENDIX II Number of responses emitted, and number of food reinforcements obtained, on the left and right keys during Stimulus 1 and Stimulus 2 in Experiment 2. The data are summed over the last five sessions of each condition, unless indicated otherwise. Responses
Condition
Bird
1.
61 62 63
64 65 66 2.
61 62 63
64 65
Stimulus 1 L R
108 129 140 143 223 268 194
76 82 65 56
4 1 6
2 82 1
7 6 2 4 22 1 2 2
69 66 173 61 177 62 6 189 63 1 187 64 31 165 65 1 66* 372 7 46 4. 61 12 40 62 13 37 63 55 3 64 31 65 29 0 53 66 8 61 229 5. 1 233 62 63 247 1 466 64 73 224 65 0 233 66 Data are summed over the last ten sessions of each condition. 3.
Stimulus 2 L R
9 15 15 14 2
43 4
7 11 5 1 6 1 6
30 5 2 18
7 2 11 8 1 11 1 6 9 11 0
7
142 121 110 107 277 232 175 174 168 185 194 181
77 73 61 63 85 128 204 210 213 195 221 197 21
17 3 34 26 17
Reinforcements L
R
108 129 140 143 223 268 194 76 82 65 56 69 173 177 189
142
187 165 372 46 40
37 55 29 53 229 233 247 466
224 233
121 110 107 277 232 175 174 168 185 194 181 77 73 61 63 85 128 204 210 213 195 221
197 21 17 3 34 26 17


![DEREK R. BOUGHNER, MD, FRCP[C] - Europe PMC](https://m.moam.info/img/260x300/derek-r-boughner-md-frcpc-europe-pmc_5b786d49097c474d6f8b470d.jpg)