Ishibashi et al. BMC Neurosci (2018) 19:33 https://doi.org/10.1186/s12868-018-0433-0
BMC Neuroscience Open Access
RESEARCH ARTICLE
Altered functional connectivity of the default mode network by glucose loading in young, healthy participants Kenji Ishibashi1* , Keita Sakurai2, Keigo Shimoji2, Aya M. Tokumaru2 and Kenji Ishii1
Abstract Background: The functional connectivity of the default mode network (DMN) decreases in patients with Alzheimer’s disease (AD) as well as in patients with type 2 diabetes mellitus (T2DM). Altered functional connectivity of the DMN is associated with cognitive impairment. T2DM is a known cause of cognitive dysfunction and dementia in the elderly, and studies have established that T2DM is a risk factor for AD. In addition, recent studies with positron emission tomography demonstrated that increased plasma glucose levels decrease neuronal activity, especially in the precuneus/posterior cingulate cortex (PC/PCC), which is the functional core of the DMN. These findings prompt the question of how increased plasma glucose levels decrease neuronal activity in the PC/PCC. Given the association among DMN, AD, and T2DM, we hypothesized that increased plasma glucose levels decrease the DMN functional connectivity, thus possibly reducing PC/PCC neuronal activity. We conducted this study to test this hypothesis. Results: Twelve young, healthy participants without T2DM and insulin resistance were enrolled in this study. Each participant underwent resting-state functional magnetic resonance imaging in both fasting and glucose loading conditions to evaluate the DMN functional connectivity. The results showed that the DMN functional connectivity in the PC/PCC was significantly lower in the glucose loading condition than in the fasting condition (P = 0.014). Conclusions: Together with previous findings, the present results suggest that decreased functional connectivity of the DMN is possibly responsible for reduced PC/PCC neuronal activity in healthy individuals with increased plasma glucose levels. Keywords: Resting-state functional MRI, Default mode network, Glucose, Precuneus, Posterior cingulate Background The default mode network (DMN), one of the restingstate brain networks, is characterized by hyperactivity when the brain is not engaged in specific behavioral tasks and low activity when the brain is focused on the external environment [1]. While performing various active tasks including novel, non-self-referential, and goal-directed tasks, the functional connectivity of the DMN consistently decreases [2, 3]. Although the mechanisms are not completely known, the DMN plays an important role in regulating complex cognition and behavior [4–6]. *Correspondence:
[email protected] 1 Research Team for Neuroimaging, Tokyo Metropolitan Institute of Gerontology, 35‑2 Sakae‑cho, Itabashi‑ku, Tokyo 173‑0015, Japan Full list of author information is available at the end of the article
Its functional connectivity is impaired in patients with Alzheimer’s disease (AD) [7], and impairment worsens with disease progression [8]. Furthermore, altered functional connectivity of the DMN is associated with cognitive decline [9, 10]. Interestingly, the DMN functional connectivity can also decrease in patients with type 2 diabetes mellitus (T2DM) [11–13]. Although T2DM, characterized by insulin resistance and increased plasma glucose levels, is intuitively far from AD pathophysiology, T2DM is reportedly associated with cognitive decline and is a risk factor for AD [14]. Although it is unclear why T2DM is a risk factor for AD, the shared vulnerability of the DMN in the two diseases may reveal a functional association between them.
© The Author(s) 2018. This article is distributed under the terms of the Creative Commons Attribution 4.0 International License (http://creativecommons.org/licenses/by/4.0/), which permits unrestricted use, distribution, and reproduction in any medium, provided you give appropriate credit to the original author(s) and the source, provide a link to the Creative Commons license, and indicate if changes were made. The Creative Commons Public Domain Dedication waiver (http://creativecommons.org/ publicdomain/zero/1.0/) applies to the data made available in this article, unless otherwise stated.
Ishibashi et al. BMC Neurosci (2018) 19:33
The functional connectivity in resting-state brain networks is measured by detecting spontaneous fluctuations in the blood-oxygen-level-dependent (BOLD) signals with functional magnetic resonance imaging (fMRI) [15]. Positive BOLD signals are presumably caused by altered cerebral blood flow, an index of neuronal activity [16]. Therefore, the functional connectivity in resting-state brain networks may be associated with neuronal activity [17]. As one of the most fundamental resting-state brain networks, the DMN comprises a set of interconnected brain regions, such as the precuneus/posterior cingulate cortex (PC/PCC), medial prefrontal cortex (MPFC), and lateral parietotemporal cortex (LPTC), with the PC/ PCC being the functional core of the DMN [4, 5]. In AD patients, functional connectivity of the DMN is impaired [7, 8]; glucose metabolism, another index of neuronal activity, is compromised primarily in the PC/PCC [18, 19]. Therefore, in AD patients, decreased functional connectivity of the DMN is possibly associated with reduced neuronal activity in the PC/PCC. Resting-state glucose metabolism, measured by fluorine-18-labeled fluorodeoxyglucose (18F-FDG) PET, is physiologically associated with neuronal activity [20]. Interestingly, recent studies using 18F-FDG PET showed that neuronal activity in the PC/PCC significantly decreases with increased plasma glucose levels in young, healthy individuals [21] as well as in cognitively normal elderly individuals [22–24]. The reduction in PC/PCC neuronal activity has been shown to occur in cognitively normal individuals with plasma glucose levels between 100 and 110 mg/dL [25] as well as in individuals developing insulin resistance [26]. Reversibly increasing and decreasing plasma glucose levels decease and increase PC/PCC neuronal activity, respectively, in cognitively normal individuals with T2DM [27]. Cerebral blood flow can also decrease in the PC/PCC as plasma glucose levels increase [21]. More recently, we measured net glucose metabolism using 18F-FDG PET with arterial blood sampling in young, healthy individuals under fasting and glucose loading conditions, and confirmed that glucose loading can reduce glucose metabolism (i.e., neuronal activity), especially in the PC/PCC [28]. These findings prompt the question of how increased plasma glucose levels decrease neuronal activity, especially in the PC/ PCC. Given the association among the DMN, AD, and T2DM, decreased functional connectivity of the DMN may be responsible for reduced neuronal activity in the PC/PCC. Therefore, we hypothesized that increased plasma glucose levels decrease the functional connectivity of the DMN even in healthy individuals without T2DM and insulin resistance, possibly thus reducing PC/ PCC neuronal activity. To test this hypothesis, we used
Page 2 of 8
resting-state fMRI to compare the functional connectivity of the DMN in young, healthy participants under fasting and glucose loading conditions.
Methods Research participants
The study was conducted in accordance with the tenets of the Declaration of Helsinki, and was approved by the Ethics Committee of the Tokyo Metropolitan Institute of Gerontology. After a detailed explanation of the study, each participant provided written informed consent. The study was composed of 12 young, healthy participants [six males and six females, age: 30.3 ± 4.6 years (mean ± SD), range: 24–36 years]. None of the participants had a history of T2DM, and all were certified to be healthy based on the results of physical and neurological examinations, medical interviews with a neurologist, and MRI findings. Study protocol
Each participant visited the Tokyo Metropolitan Institute of Gerontology twice to undergo a resting-state fMRI under each of two different conditions: fasting and glucose loading. The order in which the participants presented for imaging under the two conditions was randomized. Half of the male and half of the female participants underwent the first and second resting-state fMRI sessions under fasting and glucose loading conditions, respectively. The other participants underwent the two resting-state fMRI sessions in the reverse order. The time interval between the two visits was less than 30 days. In the fasting condition, each participant visited the institute to undergo a resting-state fMRI after fasting overnight for at least 8 h. In the glucose loading condition, each participant visited the institute without having been under any dietary restriction, and was administered 75 g of glucose orally (TRELAN-G75; AY Pharma, Tokyo, Japan) approximately 30 min prior to the resting-state fMRI. The plasma glucose levels, plasma insulin levels, and HbA1c values were measured after each resting-state fMRI, using ultraviolet absorption spectrophotometry, chemiluminescent enzyme immunoassay, and latex agglutination, respectively (SRL, Tokyo, Japan). The homeostasis model assessment of insulin resistance (HOMA-IR) was calculated as an index of insulin resistance using the following formula: HOMA-IR = (fasting glucose (mmol/L) × fasting insulin (μU/mL))/22.5. Magnetic resonance data acquisition
Imaging data were acquired on a Discovery MR 750w 3.0-T scanner (GE Healthcare, Milwaukee, WI) at the Tokyo Metropolitan Institute of Gerontology.
Ishibashi et al. BMC Neurosci (2018) 19:33
High-resolution anatomical data were collected using an SPGR sequence (repetition time = 7.648 ms, echo time = 3.092 ms, flip angle = 11°, matrix size = 196 × 256 × 256, voxel size = 1.2 mm × 1.0547 mm × 1.0547 mm). Whole-brain resting-state fMRI data were collected using an echo planar imaging (EPI) sequence (repetition time = 2500 ms, echo time = 30 ms, flip angle = 73°, slice thickness = 4 mm, matrix size = 64 × 64 × 41, FOV = 192 mm × 192 mm). The participants were instructed to rest quietly with their eyes open and to avoid specific thoughts during the restingstate fMRI sessions. Subsequently, the procedure was manually reviewed to verify that all participants followed the instructions correctly. Resting‑state fMRI data processing and independent component analysis (ICA)
The resting-state fMRI data were processed using the FMRIB Software Library version 5.0.9 (FSL; Oxford, UK) [29–31]. The first 10 volumes (images) were discarded to avoid transient signal changes before magnetization reached a steady state and to allow the participants to become accustomed to the fMRI scanning noise [32]. Then, the following 120 volumes, equivalent to 5 min of resting-state fMRI, were realigned to compensate for motion. Each motion-corrected EPI image was registered to the corresponding high-resolution SPGR image, and transformed into the Montreal Neurological Institute space using a 12-parameter affine transformation and a
Page 3 of 8
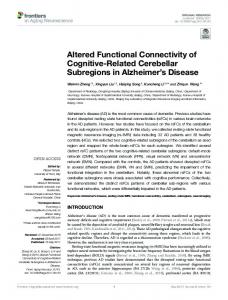
nonlinear transformation. The data were skull-stripped and spatially smoothed using a 5-mm full width at a half maximum Gaussian kernel, and a high-pass temporal filter of 100 s was applied. Probabilistic independent component analysis (ICA) was then performed to identify the functional anatomy of the DMN, and to create a DMN mask for the subsequent seed-based analysis. A multi-session temporal concatenation approach was applied to all echo planar imaging sequence images. This approach allowed for a single 2D ICA run on the concatenated data matrix to be obtained by stacking the 2D data matrices of every data set on top of each other (https://fsl.fmrib.ox.ac.uk/fsl/fslwiki/ MELODIC). FSL Melodic was used to carry out inference on the estimated maps using a mixture model and an alternative hypothesis testing approach. A threshold level of 0.5 was applied to each mixture model probability map. This threshold level implies that a voxel “survives” thresholding as soon as the probability of being in the “active” class exceeds that of being in the “background noise” class, and assumes that the probability of falsenegative and false-positive findings is equal [33, 34]. Of the 25 IC maps created by FSL Melodic, we identified one IC map representing the default mode network (Fig. 1). Seed‑based analysis and statistical analysis
The thresholded IC map, shown in Fig. 1, included the representative components of the DMN: the PC/PCC, the MPFC, and the LPTC. These components were
Fig. 1 Independent component map representing the default mode network. Independent component analysis was performed on all echo planar imaging sequence images using a multi-session temporal concatenation approach implemented in FSL Melodic. The mixture model probability map was transformed into a Z map. The red-yellow scale represents the magnitude of Z values ranging from 2.36 to 16.13
Ishibashi et al. BMC Neurosci (2018) 19:33
extracted from the IC map and used as a mask for the DMN (Fig. 2a). Using the mask for the DMN as a seed, the mean time series across all voxels within the seed was extracted from each EPI image. A first-level analysis was performed for each 4D EPI image. The extracted mean time series was set as a covariate. We added the following variables as nuisance regressors: mean signals of cerebrospinal fluid and white matter, and metrics of motionrelated artifact created by FSL Mcflirt and Motion Outliers [35, 36]. A one-sample t test was then performed as a higher-level analysis for each of the two conditions to assess the within-group functional connectivity of the DMN, using FSL Feat (https://fsl.fmrib.ox.ac.uk/fsl/fslwi ki/FEAT). Z statistic images were thresholded using clusters determined by Z > 2.3 and a corrected cluster significance of P