Yamada et al. Molecular Autism (2016) 7:41 DOI 10.1186/s13229-016-0106-8
RESEARCH
Open Access
Altered functional organization within the insular cortex in adult males with highfunctioning autism spectrum disorder: evidence from connectivity-based parcellation Takashi Yamada1,2†, Takashi Itahashi1†, Motoaki Nakamura1,3, Hiromi Watanabe1, Miho Kuroda1,4,5, Haruhisa Ohta1, Chieko Kanai1, Nobumasa Kato1 and Ryu-ichiro Hashimoto1,2,6,7*
Abstract Background: The insular cortex comprises multiple functionally differentiated sub-regions, each of which has different patterns of connectivity with other brain regions. Such diverse connectivity patterns are thought to underlie a wide range of insular functions, including cognitive, affective, and sensorimotor processing, many of which are abnormal in autism spectrum disorder (ASD). Although past neuroimaging studies of ASD have shown structural and functional abnormalities in the insula, possible alterations in the sub-regional organization of the insula and the functional characteristics of each sub-region have not been examined in the ASD brain. Methods: Resting-state functional magnetic resonance imaging (rs-fMRI) data were acquired from 36 adult males with ASD and 38 matched typically developed (TD) controls. A data-driven clustering analysis was applied to rs-fMRI data of voxels in the left and right insula to automatically group voxels with similar intrinsic connectivity pattern into a cluster. After determining the optimal number of clusters based on information theoretic measures of variation of information and mutual information, functional parcellation patterns in both the left and the right insula were compared between the TD and ASD groups. Furthermore, functional profiles of each sub-region were meta-analytically decoded using Neurosynth and were compared between the groups. Results: We observed notable alterations in the anterior sector of the left insula and the middle ventral sub-region of the right insula in the ASD brain. Meta-analytic decoding revealed that whereas the anterior sector of the left insula contained two functionally differentiated sub-regions for cognitive, sensorimotor, and emotional/affective functions in TD brain, only a single functional cluster for cognitive and sensorimotor functions was identified in the anterior sector in the ASD brain. In the right insula, the middle ventral sub-region, which is primarily specialized for sensory- and auditory-related functions, showed a significant volumetric increase in the ASD brain compared with the TD brain. (Continued on next page)
* Correspondence:
[email protected] † Equal contributors 1 Medical Institute of Developmental Disabilities Research, Showa University, 6-11-11 Kita-karasuyama, Setagaya-ku, Tokyo, Japan 2 ATR Brain Information Communication Research Laboratory Group, 2-2-2 Hikaridai, Seika-cho, Sorakugun, Kyoto, Japan Full list of author information is available at the end of the article © 2016 The Author(s). Open Access This article is distributed under the terms of the Creative Commons Attribution 4.0 International License (http://creativecommons.org/licenses/by/4.0/), which permits unrestricted use, distribution, and reproduction in any medium, provided you give appropriate credit to the original author(s) and the source, provide a link to the Creative Commons license, and indicate if changes were made. The Creative Commons Public Domain Dedication waiver (http://creativecommons.org/publicdomain/zero/1.0/) applies to the data made available in this article, unless otherwise stated.
Yamada et al. Molecular Autism (2016) 7:41
Page 2 of 15
(Continued from previous page)
Conclusions: The results indicate an altered organization of sub-regions in specific parts of the left and right insula of the ASD brain. The alterations in the left and right insula may constitute neural substrates underlying abnormalities in emotional/affective and sensory functions in ASD. Keywords: Autism spectrum disorder, Resting-state functional magnetic resonance imaging, Insula, Connectivitybased functional parcellation
Background Autism spectrum disorder (ASD) has been increasingly conceptualized as a disease of large-scale brain networks [1]. Among multiple nodes that constitute the brain’s networks, several brain regions have emerged as key structures that particularly contribute to abnormal functionalities in the ASD brain. The insular cortex is one such brain region, whose structural and functional abnormalities are frequently reported in the neuroimaging literature of ASD. Structurally, alterations of the gray matter (GM) volume have been identified in the anterior and posterior parts of the right insula in adult ASD [2–4]. Functionally, a comprehensive meta-analysis of functional imaging studies has revealed hypoactivation in the right anterior insula during various social tasks including face recognition and mentalizing [5]. Regarding connectivity, previous resting-state fMRI studies of adolescent and adult ASD have shown reduced functional connectivity (FC) of the anterior, middle, and posterior insula with distant brain regions, including the amygdala and the somatosensory cortex [6–8]. Convergent evidence from these structural, functional, and FC studies strongly prompts more detailed investigations of the insula to advance our understanding of the neural substrates of ASD. Recent progress in anatomical studies has enabled more finely grained investigations into the neural organization of the insula. Traditionally, the insula has been divided into the following three regions: (1) anterior agranular, (2) posterior granular, and (3) precentral dysgranular [9–11]. However, a recent histological study has identified at least three distinct regions within the posterior insula alone [12], indicating the presence of a more fine-grained subdivision of this brain region. Similarly, FC analysis using fMRI data has led to recent progress in understanding the functional anatomy of the insular cortex. The rationale behind the FC approach is that the connectivity pattern of a brain region is a significant determinant of its functional role [13, 14]. FC patterns of the insular cortex have been mainly investigated using resting-state FC analyses or meta-analyses of co-activation patterns obtained in taskbased fMRI studies. Using data-driven clustering methods in which voxels with similar FC patterns were grouped into a functional unit (parcel), Cauda and colleagues have identified two sub-regions of the ventral-anterior and dorsal-posterior insula based on resting-state FC [15] and
co-activation patterns obtained in task-based fMRI studies [16]. On the other hand, a more recent study using data-driven clustering analysis of resting-state FC data supported the tripartite subdivision into dorsalanterior, ventral-anterior, and posterior regions [17]. Based on the fact that each sub-region has a distinct FC pattern, this study used a meta-analytic co-activation tool (Neurosynth) and succeeded in decoding the functional profiles of insular sub-regions using reverse inference from the FC patterns seeded from each subregion [18]. These studies demonstrate the utility of data-driven FC-based clustering methods in the study of insular functional organization, particularly when they are used in combination with meta-analytical tools such as the Neurosynth framework. The aforementioned studies reporting a functional parcellation of the insula confirm the traditional cytoarchitecture-based subdivision scheme of this brain region. However, given more recent evidence indicating an even finer subdivision within the posterior insula, the data-driven FC clustering approach is expected to lead to a more finely grained functional parcellation of this brain region. Indeed, Kelly and colleagues gradually increased the number of parcels in the insula starting at two and examined changes in functional parcellation patterns using resting-state FC data, gray matter structural images, and a task-based fMRI co-activation map [19]. They observed consistent patterns of fine-scale functional parcellation across these three different modalities when using up to nine parcels. Comparing parcellation patterns at multiple scale levels (coarse vs. fine subdivisions) revealed that insular sub-regions are organized in a pseudo-hierarchical fashion, such that an increment in the number of subdivisions results in a finer division of an already existing cluster rather than generating a completely new parcellation pattern. These results indicate that the insular cortex is organized at multiple spatial scales and that finer parcellation patterns may offer additional insights into the functional organization of this structure. In the present fMRI study, we examined the functional organization of the insula in adult males with ASD by applying the data-driven clustering method to restingstate FC data. Although localized alterations in insular gray matter volume, cortical activation, and FC have
Yamada et al. Molecular Autism (2016) 7:41
Page 3 of 15
previously been reported in neuroimaging studies of ASD [6–8], to our knowledge, no study has examined the possibility of an altered organization of functionally heterogeneous insular sub-regions in the ASD brain. In this study, we first examined whether the functional organization of the insula is altered in subjects with ASD compared with typically developed (TD) controls. When we detected significant alterations, we then attempted to identify functions of the affected subregions by applying a meta-analytical decoding tool [18] to FC patterns of insular sub-regions. In this series of analyses, we needed to determine the optimal number of clusters for parcellation. Given previous findings indicating multiple spatial scales of insular organization [19], we expected that finer parcellation schemes would be more sensitive to subtle but significant functional alteration than coarser subdivisions adopted by traditional bi- or tripartite schemes.
Methods Participants
Thirty-six high-functioning adult males with ASD and 38 age-matched TD males participated in this study. The diagnostic procedure to identify patients with ASD was the same as in our previous studies [20–22]. Briefly, an experienced psychiatrist and a clinical psychologist independently interviewed the patients (together with their caregivers when available) for approximately 3 h regarding their developmental history, present illness, life history, and family history. The diagnosis of ASD was made only when there was a consensus between the psychiatrist and clinical psychologist based on the criteria of the Diagnostic and Statistical Manual of Mental Disorders, Fourth Edition (DSM-IV-TR) (American Psychiatric, 2000). In addition, the diagnosis was reconfirmed after at least a 2-month of follow-up period. TD subjects were recruited through advertisements and acquaintances. None of the TD participants reported any
severe medical problems or a neurological or psychiatric history. Except for six TD participants, participants completed the Japanese version of the autism spectrum quotient (AQ) test [23]. Table 1 shows detailed demographic information for the study participants. We confirmed that all of the participants were righthanded using the Edinburgh Handedness Inventory [24]. The intelligence quotient (IQ) scores of all participants with ASD were evaluated using either the Wechsler Adult Intelligence Scale-Third Edition (WAIS-III) or the WAIS-Revised (WAIS-R), while those of TD subjects were estimated using a Japanese version of the National Adult Reading Test (JART) [25]. There were no significant differences between the two groups in age or IQ scores (both p > 0.1). Out of 36 participants with ASD, 24 individuals underwent either (1) Diagnostic Interview for Social and Communicative Disorders (DISCO) only (n = 5), or (2) Autism Diagnostic Observation Schedule (ADOS) only (n = 11), or (3) both (n = 8). The remaining 12 ASD participants did not undergo either of the auxiliary diagnostic tool of DISCO or ADOS. All of the five participants who underwent only the DISCO satisfied the DISCO diagnostic criteria for ASD. Out of the 11 participants who underwent only the ADOS, ten satisfied the ADOS diagnostic criteria for ASD, while one participant had a total ADOS score that was lower than the cut-off score (6 < 7); however, the same subject satisfied the cut-off scores for the “communication” and “social reciprocity” subscales of the ADOS (“communication”: 2 ≥ 2, “social reciprocity”: 4 ≥ 4), and therefore he was regarded as an individual with ASD. All of the eight participants who underwent the DISCO and ADOS satisfied the criteria for ASD for both measures. All participants provided written informed consent. This study was conducted in accordance with the principles of the Declaration of Helsinki and was approved by the Ethics Committee of the Faculty of Medicine of Showa University.
Table 1 The demographic data for the participants TD (n = 38) Age (years)
ASD (n = 36)
Statistics
Mean
SD
Range
Mean
SD
Range
df
P value
32.5
7.3
19–47
29.9
7.1
19–46
72
0.14
Full-scale IQ
109.5
8.4
87.5–119.8
106.2
13.9
83–134
72
0.23
Handedness
92.7
20.3
5.3–100
87.9
24.5
5.9–100
72
0.37
AQ score
15.5
5.6
7–30
36.3
4.9
23–43
66
TD AD sub-region, p = 0.024) (Additional file 1: Figure S1a). When the functional profiles were compared between the AD and AV sub-regions, the AV sub-region was more highly associated with terms related to affection and emotion, such as “reward,” “fear,” “anxiety,” and “affective,” whereas the AD sub-region was more
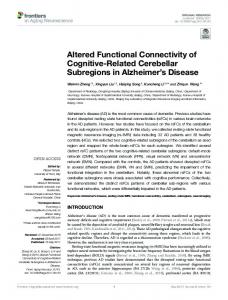
Fig. 5 The meta-analytic decoding of sub-regions in the left anterior sector and posterior ventral sub-regions. a The radar chart that shows the correlation of left anterior ventral (AV) and anterior dorsal (AD) sub-regions in the TD group and the anterior section in the ASD group with the 14 terms of interest. Note that the profile of the ASD anterior sector is more similar to that of the AD sub-region rather than the AV sub-region in the TD group. b The radar chart that shows the correlation of left posterior ventral (PV) sub-region in the TD group and the two parcels within the PV sub-region (PV1 and PV2) with the 14 terms of interest. The profiles of these three sub-regions were highly similar
Yamada et al. Molecular Autism (2016) 7:41
preferably associated with a cognitive terms (“control” and “inhibition”) and sensorimotor terms (“sensorimotor,” “motor,” “tactile,” and “somatosensory”). We next performed a meta-analytic decoding of the function of the PV sub-region in the TD group and functions of the two PV sub-regions in the ASD group. For simplicity, we will label the anterior portion of the PV sub-region in the ASD group as PV1 and the posterior PV as PV2. When comparing the PV sub-region in the TD group with the two PV sub-regions in the ASD group, we observed almost identical functional profiles among these sub-regions (TD PV and ASD PV1: r = 0.96; TD PV and ASD PV2: r = 0.95; ASD PV1 and ASD PV2: r = 1.00). Meta-analytical decoding of the right insular sub-regions
We next examined functional alterations in the right insular sub-regions of the ASD group. We previously noted the visual observation suggesting the extension of the MV sub-region into the more dorsal part of the insula (see the “Visual inspection of functional connectivity-based parcellation” section). We statistically confirmed this observation by using the permutation test and finding a significant group difference (ASD > TD, p = 0.003) (Additional file 1: Figure S1b). Meta-analytic decoding of the MV sub-region revealed that the region was strongly associated with terms related to perceptual processes such as “pain,” “somatosensory,” “auditory,” “speech,” and “heat,” and that such functional profiles were almost identical between the TD and ASD groups (r = 0.99) (Fig. 6a). In addition to the spatial expansion of the MV sub-region, our visual inspection indicated that the position of the C sub-region had shifted in the posterior direction in the ASD group. In order to examine possible functional alterations in this region, we performed metaanalytic decoding of the C sub-region in the two groups and found highly dissimilar patterns (r = 0.45). However,
Page 10 of 15
we observed that the C sub-region in the ASD group was functionally similar to the PV sub-region in the TD group (r = 0.98), which was strongly associated with terms largely related to perceptual (“somatosensory,” “tactile,” and “auditory”) and motor processes. The results are consistent with the observation of the spatial shift of the C sub-region toward the posterior direction in the ASD group. Group differences in individual variability in insula parcellation
Our analysis showed significant differences in functional parcellation patterns between the TD and ASD groups. However, recent studies have suggested that the ASD brain is highly idiosyncratic, indicating that each individual ASD brain may be greatly discrepant from the group mean [40]. Therefore, it may be argued that the interindividual variability in the insula parcellation patterns is larger in the ASD than in the TD and that such enhanced variability might have played a role in the altered parcellation pattern in the ASD. To test this possibility, we calculated the MIs between each individual adjacency matrix of the ASD participants and the group-level similarity matrix (see the “Connectivity-based functional parcellation” section) of the ASD group when the cluster number (k) was optimally set to 8 (eight sub-regions). Similarly, the MIs were also calculated for the TD individuals using the TD group-level similarity matrix. If the parcellation pattern in each individual brain is more idiosyncratic in the ASD group, then the MI should be significantly reduced in the ASD group than in the TD group. However, we did not observe a significant difference in MIs between the ASD and TD groups in either the left or right insula (left insula: t = −1.54, p = 0.13, right insula: t = 0.038, p = 0.97). We also reasoned that the degree of idiosyncrasy in the insular parcellation pattern of an individual might be associated with his or her severity of the ASD symptoms.
Fig. 6 The meta-analytic decoding in the right middle ventral, central, and posterior ventral sub-regions. a The radar chart that shows the correlation of the middle ventral (MV) sub-region in both groups with the 14 terms of interest. b The radar chart shows the correlation of the central (C) and posterior ventral (PV) sub-regions in both groups with the 14 terms of interest
Yamada et al. Molecular Autism (2016) 7:41
To explore this possibility, we first evaluated the degree of idiosyncrasy using the MI values between the adjacency matrix of each ASD individual and the group-level similarity matrix of ASD individuals. These MIs represented the discrepancy from the mean ASD parcellation pattern. Then we computed the correlation between the AQ scores and the MI values, but the correlation was not significant (left insula: r = 0.03, p = 0.85, right insula: r = −0.02, p = 0.90). We also calculated the individual MIs using the group-level similarity matrix of TD individuals, as indices for the discrepancy from the typical (mean TD) parcellation pattern. However, no significant correlation with the total AQ score was found in either the left or right insula (left insula: r = 0.04, p = 0.83, right insula: r = −0.02, p = 0.90). Functional parcellation in the intracalcarine cortex
The same clustering methods as those used for the insula were applied to the control region of the intracalcarine cortex. MI reached the local maximum at k = 7, 8, 9, and 10, and VI reached the local minimum at k = 6 and 7 (Additional file 2: Figure S2). Following the same criteria as that for the insula, we determined an optimal k of 7. Based on visual inspection, the functional parcellation patterns at k = 7 were highly comparable between the TD and ASD groups (Additional file 3: Figure S3). Permutation tests for the volume of each sub-region revealed no significant group differences in any of the seven sub-regions (light blue region: p = 0.36, green region: p = 0.67, orange region: p = 0.55, yellow region: p = 0.58, magenta region: p = 0.55, blue region: p = 0.52, violet region: p = 0.31). The comparable parcellation pattern between groups in the control region indicates that group differences that were identified by our connectivity-based parcellation may be selective to parts of brain regions, including the left and right insula. Replicability of the functional parcellation patterns in the insula
We examined the replicability of the functional parcellation patterns using the leave-one-fold-out method (six folds in each group) (see the “Assessment for the replicability of functional parcellation patterns” section). The means and SEM of MIs between the parcellation pattern for all participants in a group and each of the six parcellation patterns that were generated using the leave-onefold-out method were as follows: TD: 0.88 ± 0.02 (mean ± SEM), ASD: 0.81 ± 0.01 for the left insula; TD: 0.90 ± 0.02, ASD: 0.79 ± 0.01 for the right insula. These high MI values indicate good stability for the parcellation patterns of the left and right insula in both groups. We also examined the replicability of the group differences in the sub-regional volumes that were identified in the left and right insula. In the left insula, the anterior
Page 11 of 15
sub-region of the ASD group was significantly larger than the AD sub-region of the TD group (see the “Metaanalytical decoding of the left insular sub-regions” section). In the right insula, the MV sub-region was significantly larger for the ASD group than the TD group (see the “Meta-analytical decoding of the right insular subregions” section). For these two sub-regions, we subtracted the volume of the ASD group from that of the TD group for each of the six leave-one-fold-out steps. Because the aim of this analysis was to test whether the subtracted value is significantly lower than 0, we performed a one-sample, one-tailed t test using the six samples. As a result, we observed a significant difference for both sub-regions (the left sub-region: t = −2.88, p = 0.017; the right sub-region: t = −2.64, p = 0.023). Therefore, the group differences in the sub-regional volumes were also replicable.
Discussion In this study, we performed an automatic functional parcellation of the insular cortex in adult male ASD by adopting a data-driven clustering method based on resting-state FC patterns of voxels. In the comparison with matched TD brain, we observed notable alterations in specific sub-regions in the left and right insular cortices of ASD brain. These alterations were localized to the anterior sub-regions of the left insula and the middle ventral sub-region of the right insula. In the left insula, whereas the anterior sector contained two functionally differentiated sub-regions in TD brain, only a single functional cluster was identified in the anterior sector in the ASD group. No clear group-difference was observed in the control region of the intracalcarine cortex using the same resting-state FC-based parcellation method. Additional analyses using subsets of the entire dataset confirmed the high stability of the insular parcellation patterns in both groups. Meta-analytical decoding revealed the absence of sub-region specialized for emotional and affective functions in the anterior sector in the ASD brain. The middle ventral sub-region of the right insula, which is primarily specialized for sensory and auditory-related functions, extended into the more dorsal parts of the insula and its volume was significantly enlarged compared with the same region in the TD brain. We thus observe alterations in the functional organization of the left and right insular sub-regions, which may underlie abnormalities in emotional/affective and sensory domains in ASD. The left insula lacks an emotion-related sector in ASD
We found a notable difference in the anterior sector of the left insula when we carried out a group comparison of functional parcellation patterns. Specifically, whereas the anterior sector was parceled into dorsal and ventral
Yamada et al. Molecular Autism (2016) 7:41
sub-regions in the TD group, only a single cluster was identified in the anterior sector in the ASD group. Analysis of the functional profiles of the two sub-regions indicate a functional differentiation in the TD brain, such that the ventral sub-region is characterized by selective involvement in emotional and affective processes, fear, anxiety, and reward, whereas the dorsal sub-region is more strongly involved in cognitive and sensorimotor functions compared with the ventral subregion. On the other hand, the functional profile of the single anterior cluster in the ASD brain closely matched that of the dorsal rather than the ventral sub-region in the TD brain. Therefore, we report that the left anterior insula in ASD is functionally altered and is characterized by the absence of the sub-region for emotional and affective functions. It is notable that such an alteration in functional parcellation was observed in the left insula. Based on anatomical evidence of left-to-right asymmetry in peripheral autonomic efferent neurons and homeostatic afferent neurons, as well as a review of neuroimaging literature, an influential model of the insula posits that the left insula is associated with parasympathetic (“affiliative”) functions, while the right side is associated with sympathetic (“aroused”) functions. This idea provides the neurobiological foundation for the functional laterality of emotion. According to this model, the left anterior insula is more strongly involved in “positive (energy enrichment)” emotions. Consistent with this view, previous fMRI studies of neurotypical populations demonstrated the left-lateralized activation of the anterior insula during the viewing of pleased facial expressions [41] and when mothers viewed their own child [42] and experienced maternal and romantic love [43]. These observations indicate a dichotomy of emotion, so that the left anterior insula may be viewed as critical for group-oriented (affiliative) emotions as opposed to individual-oriented emotions. Our observation of the absence of the anterior subregion for emotional and affective functions in ASD may predict abnormalities in group-oriented emotions. Consistently, a recent model of ASD focused on the concept of “social motivation” and proposed that the core problems of ASD may be explained by extremely diminished social motivation [44]. According to previous surveys, half of the adults with ASD report having no particular friends [45] and score significantly lower on items in the friendship questionnaire that concern attitudes toward interpersonal relationships, such as pleasure in close friendship and interest in people [46]. Therefore, the functional alteration in the anterior section of the left anterior insula may provide a neurological basis for the lack of group-oriented emotion and behavior in ASD.
Page 12 of 15
The right insula has an enlarged sensory and auditoryrelated section in ASD
We identified a significant alteration of functional parcellation patterns in the right insula. Specifically, we observed an increase in the volume of the middle ventral sub-region, which is specialized for auditory-related and other sensory functions. Convergent evidence from anatomical, electrophysiological, brain lesion, and neuroimaging studies indicate that the insular cortex is involved in multimodal sensory functions, including somatosensory, olfactory, visceral, and auditory functions [47]. In particular, previous reports have highlighted a critical role for the insula in various aspects of auditory function, including auditory attention, music, the processing of novel auditory stimuli, temporal processing, and visualauditory integration [47]. Our analyses of the functional profiles of insular sub-regions indicate that the middle ventral sub-region is specifically associated with such auditory and sensory functions. Given the functional profiles of the above insular subregions, it is plausible that the volumetric expansion of the right middle ventral sub-region is associated with sensory abnormalities in ASD, including those in the auditory domain. Indeed, atypical sensory reactivity, including altered auditory sensitivity, has recently been recognized as a core symptom of ASD under the new diagnostic criteria of DSM-5 [48]. In addition to evidence for auditory hypersensitivity revealed by clinical questionnaires [49, 50], recent behavioral experiments have revealed a more detailed picture of the altered auditory processing in ASD. Although individuals with ASD have been shown to be impaired in some auditory functions, such as auditory attention reorienting and the modulation of auditory perception [51], it is notable that they outperform TD subjects in a number of auditory functions, such as auditory stream segregation [52] and the perception of pitch [53] and time [54]. Abnormalities in sensations other than audition have been also reported in the previous literature [55, 56]. Although we acknowledge the need for further investigation to establish the functional significance of the volumetric enlargement of the right middle ventral sub-region, our observations raise the interesting possibility that this alteration may involve parts of the neural mechanisms underlying altered sensation in ASD. Limitations
We acknowledge a few limitations of the present study. Firstly, the present study restricted recruitment to adult males. This restriction was made because several studies have reported effects of age [57] and sex [58] on functional connectivity, at least for neurotypical populations. Given the possibility that age and sex may be critical factors for the etiological and phenotypic heterogeneity
Yamada et al. Molecular Autism (2016) 7:41
of ASD [59], we need to carry out further studies targeting specific populations excluded in the present study. Secondly, we determined the optimal cluster number k by the combined use of VI and MI. However, the choice of the optimal k may be an inherent problem in any data-driven clustering analysis, given that the gold standard for the selection of this value has not yet been established. Indeed, previous studies have adopted a variety of methods for determining the optimal k value, such as using a combination of percent agreement and VI [19], VI only [36], validation indicator [17], and Dice’s coefficient between test and re-test data [33]. Among all of the possible measures, we selected MI and VI, because the combined use of the two measures allows for the estimation of the three critical features of clustering solutions: similarity, dissimilarity, and stability. Although we acknowledge some uncertainty in our analysis, we note that our method unequivocally determined the optimal k for each hemisphere and that the k = 8 was optimal even when the TD data was used (Additional file 4: Figure S4). These results indicate the validity and robustness of our method, at least for the current dataset. Thirdly, in contrast to the task-related fMRI design, it may be argued that the resting-state FC study alone does not allow us to directly test hypotheses about the relationship between particular brain regions and their functions. To overcome this general limitation of the resting-state FC study, we have adopted the metaanalytical decoding method of Neurosynth, which uses meta-analysis of co-activation data in the fMRI literature and performs a reverse inference regarding the functions of the sub-region of interest from an FC pattern seeding that sub-region. Although this approach has been gaining credibility in recent fMRI studies [17, 60], we still acknowledge the need of the hypothesis-driven approaches, such as task-related fMRI studies, to establish the links between alterations in specific insular subregions and abnormal functions in the ASD brain. The present findings based on data-driven approaches are expected to provide specific hypotheses in designing such hypothesis-driven studies in the future. Fourthly, only one control region was used to show that the functional alterations that we observed in the organization of the insula are not present in functionally intact brain regions in individuals with ASD. Although this remains a limitation of the study, at least in the intracalcarine cortex, we were able to show that the functional parcellation pattern in the ASD group was highly comparable to that of the TD group in visual inspection and in volumes of the corresponding subregions that were revealed using permutation test. Although more control regions may be needed, using the intracalcarine cortex as a control region has raised the specificity of our findings for the insula.
Page 13 of 15
Conclusions To conclude, the present study uses data-driven clustering analysis of the multi-voxel resting state FC data to reveal altered functional parcellation in the insular cortex of the ASD brain. With the combined use of meta-analytic decoding analysis, we observed localized alterations in sub-regional organization in each side of the insula in ASD. In the left insula, two anterior sub-regions were merged into a single sub-region in which selective involvement in affective and emotional functions was absent. In the right insula, the middle ventral sub-region for auditory-related and sensory functions was significantly increased in volume. Such alterations in functional organization in the insular cortex may constitute neural abnormalities that underlie emotional/affective and sensory problems in ASD. Additional files Additional file 1: Figure S1. The statistical test for between-group difference in the sub-regional volume using the permutation procedure. The histograms illustrate the null distribution of volume differences between groups (in voxels) induced by the permutation procedure in the left anterior dorsal (AD) sub-region (the anterior sector in ASD) (a) and in the right middle ventral (MV) sub-region (b). The red dashed vertical line indicates the observed volume differences between correctly labeled TD and ASD groups. The negative values indicate that the sub-region is smaller in TD brain compared to the corresponding sub-region in ASD. (PDF 650 kb) Additional file 2: Figure S2. Determination of the optimal number of clusters based on VI and MI in intracalcarine cortex. The intracalcarine cortex was selected as a control region. The VI and MI values are shown for every clustering solution for k values ranging from 2 to 10. Arrows indicate either local minima of VI or local maxima of MI. Dashed lines denote the optimal number of solutions as determined using both VI and MI. The error bars denote standard errors of the mean for 100 repetitions of the split-half procedure (see the “Estimation of the optimal number of clusters” section). “n.s.” indicates no statistically significant difference between points. (PDF 334 kb) Additional file 3: Figure S3. The patterns of functional parcellation in the intracalcarine cortex in TD and ASD. Figures show the parcellation patterns at the optimal cluster number (k) of 7. Each figure is presented in axial and magnified axial views. The color of each intracalcarine sub-region reflects the color of the corresponding sub-region in the TD and ASD groups. Note the highly comparable parcellation patterns between groups. (PDF 355 kb) Additional file 4: Figure S4. VI and MI values for clustering solutions (k = 2 to 10) using only TD participants. The dashed line denotes the optimal number of solutions based on the same criteria as in Fig. 2. The error bars are standard errors of the mean. Each kind of arrows points to the optimal number of solutions based on “similarity” and “dissimilarity” criteria. “n.s.” indicates that the MI or VI values are not significantly different between the 2 bracketed points. (PDF 1125 kb)
Abbreviations AD: Anterior dorsal; ADOS: Autism Diagnostic Observation Schedule; AFNI: Analysis of Functional NeuroImages; AQ: Autism spectrum quotient; ASD: Autism spectrum disorder; AV: Anterior ventral; C: Center; DISCO: Diagnostic Interview for Social and Communicative Disorders; DSM: Diagnostic and Statistical Manual of Mental Disorders; DVARS: D referring temporal derivative and VARS referring the root mean squared; FC: Functional connectivity; FD: Framewise displacement; fMRI: Functional magnetic resonance imaging; GM: Gray matter; IQ: Intelligence quotient; JART: Japanese version of the National Adult Reading Test; MD: Middle dorsal; MI: Mutual information; MNI: Montreal Neurological Institute;
Yamada et al. Molecular Autism (2016) 7:41
MV: Middle ventral; PD: Posterior dorsal; PV: Posterior ventral; ROI: Region of interest; rs-fMRI: Resting-state functional magnetic resonance imaging; SD: Standard deviation; SPM: Statistical Parametric Mapping; TE: Echo time; TD: Typically developed; TR: Repetition time; VI: Variation of information; WAIS: Wechsler Adult Intelligence Scale Acknowledgements This study is the result of “Development of BMI Technologies for Clinical Application” carried out under the Strategic Research Program for Brain Sciences by the Ministry of Education, Culture, Sports, Science and Technology of Japan. This work was also supported by the Japan Society for the Promotion of Science (JSPS) Grant-in-Aid for Scientific Research (C) (16K10236 to T.Y.), a Grant-in-Aid for Young Scientists (B) (16K17363 to T.I.), and a Grant-in-Aid for Scientific Research on Innovative Areas (23118003; Adolescent Mind & Self-Regulation to R.H.) from the Ministry of Education, Culture, Sports, Science, and Technology of Japan. Authors’ contributions TY and TI conceived of the study, performed the analysis, and drafted and revised the manuscript. TY, TI, MN, HW, HO, CK, and RH participated in the data acquisition. MK, TY, MN, HW, HO, and CK were in charge of the clinical assessment. NK participated in the design of the study and supervised the study. MN, MK, HW, HO, CK, and NK revised the manuscript for important intellectual content. RH participated in its design, coordination, and analysis and helped to write and revise the manuscript. All authors read and approved the final manuscript. Competing interests The authors declare that they have no competing interests. Author details 1 Medical Institute of Developmental Disabilities Research, Showa University, 6-11-11 Kita-karasuyama, Setagaya-ku, Tokyo, Japan. 2ATR Brain Information Communication Research Laboratory Group, 2-2-2 Hikaridai, Seika-cho, Sorakugun, Kyoto, Japan. 3Kinko Hospital, Kanagawa Psychiatric Center, 2-5-1 Serigaya, Yokohama, Kanagawa, Japan. 4Child Mental Health-care Center, Fukushima University, 1 Kanayagawa, Fukusima-shi, Fukushima, Japan. 5 Department of Child Neuropsychiatry, Graduate School of Medicine, The University of Tokyo, 7-3-1 Hongou, Bunkyo-ku, Tokyo, Japan. 6Department of Language Sciences, Graduate School of Humanities, Tokyo Metropolitan University, 1-1 Minami-Osawa, Hachioji-shi, Tokyo, Japan. 7Research Center for Language, Brain and Genetics, Tokyo Metropolitan University, 1-1 Minami-Osawa, Hachioji-shi, Tokyo, Japan.
Page 14 of 15
7.
8.
9. 10. 11.
12.
13. 14.
15. 16.
17.
18.
19.
20.
21.
Received: 6 April 2016 Accepted: 27 September 2016 22. References 1. Menon V. Large-scale brain networks and psychopathology: a unifying triple network model. Trends Cogn Sci. 2011;15:483–506. 2. Cauda F, Geda E, Sacco K, D’Agata F, Duca S, Geminiani G, Keller R. Grey matter abnormality in autism spectrum disorder: an activation likelihood estimation meta-analysis study. J Neurol Neurosurg Psychiatry. 2011;82:1304–13. 3. Ecker C, Suckling J, Deoni SC, Lombardo MV, Bullmore ET, Baron-Cohen S, Catani M, Jezzard P, Barnes A, Bailey AJ, et al. Brain anatomy and its relationship to behavior in adults with autism spectrum disorder: a multicenter magnetic resonance imaging study. Arch Gen Psychiatry. 2012; 69:195–209. 4. Kosaka H, Omori M, Munesue T, Ishitobi M, Matsumura Y, Takahashi T, Narita K, Murata T, Saito DN, Uchiyama H, et al. Smaller insula and inferior frontal volumes in young adults with pervasive developmental disorders. Neuroimage. 2010;50:1357–63. 5. Di Martino A, Ross K, Uddin LQ, Sklar AB, Castellanos FX, Milham MP. Functional brain correlates of social and nonsocial processes in autism spectrum disorders: an activation likelihood estimation meta-analysis. Biol Psychiatry. 2009;65:63–74. 6. Di Martino A, Yan CG, Li Q, Denio E, Castellanos FX, Alaerts K, Anderson JS, Assaf M, Bookheimer SY, Dapretto M, et al. The autism brain imaging data exchange: towards a large-scale evaluation of the intrinsic brain architecture in autism. Mol Psychiatry. 2014;19:659–67.
23.
24. 25.
26. 27.
28. 29.
30.
Ebisch SJ, Gallese V, Willems RM, Mantini D, Groen WB, Romani GL, Buitelaar JK, Bekkering H. Altered intrinsic functional connectivity of anterior and posterior insula regions in high-functioning participants with autism spectrum disorder. Hum Brain Mapp. 2011;32:1013–28. von dem Hagen EA, Stoyanova RS, Baron-Cohen S, Calder AJ. Reduced functional connectivity within and between ‘social’ resting state networks in autism spectrum conditions. Soc Cogn Affect Neurosci. 2013;8:694–701. Augustine JR. The insular lobe in primates including humans. Neurol Res. 1985;7:2–10. Augustine JR. Circuitry and functional aspects of the insular lobe in primates including humans. Brain Res Brain Res Rev. 1996;22:229–44. Mesulam MM, Mufson EJ. Insula of the old world monkey. I. Architectonics in the insulo-orbito-temporal component of the paralimbic brain. J Comp Neurol. 1982;212:1–22. Kurth F, Eickhoff SB, Schleicher A, Hoemke L, Zilles K, Amunts K. Cytoarchitecture and probabilistic maps of the human posterior insular cortex. Cereb Cortex. 2010;20:1448–61. Passingham RE, Stephan KE, Kotter R. The anatomical basis of functional localization in the cortex. Nat Rev Neurosci. 2002;3:606–16. Uddin LQ, Kinnison J, Pessoa L, Anderson ML. Beyond the tripartite cognition-emotion-interoception model of the human insular cortex. J Cogn Neurosci. 2014;26:16–27. Cauda F, D’Agata F, Sacco K, Duca S, Geminiani G, Vercelli A. Functional connectivity of the insula in the resting brain. Neuroimage. 2011;55:8–23. Cauda F, Costa T, Torta DM, Sacco K, D’Agata F, Duca S, Geminiani G, Fox PT, Vercelli A. Meta-analytic clustering of the insular cortex: characterizing the meta-analytic connectivity of the insula when involved in active tasks. Neuroimage. 2012;62:343–55. Chang LJ, Yarkoni T, Khaw MW, Sanfey AG. Decoding the role of the insula in human cognition: functional parcellation and large-scale reverse inference. Cereb Cortex. 2013;23:739–49. Yarkoni T, Poldrack RA, Nichols TE, Van Essen DC, Wager TD. Large-scale automated synthesis of human functional neuroimaging data. Nat Methods. 2011;8:665–70. Kelly C, Toro R, Di Martino A, Cox CL, Bellec P, Castellanos FX, Milham MP. A convergent functional architecture of the insula emerges across imaging modalities. Neuroimage. 2012;61:1129–42. Itahashi T, Yamada T, Watanabe H, Nakamura M, Jimbo D, Shioda S, Toriizuka K, Kato N, Hashimoto R. Altered network topologies and hub organization in adults with autism: a resting-state fMRI study. PLoS One. 2014;9:e94115. Watanabe H, Nakamura M, Ohno T, Itahashi T, Tanaka E, Ohta H, Yamada T, Kanai C, Iwanami A, Kato N, Hashimoto R. Altered orbitofrontal sulcogyral patterns in adult males with high-functioning autism spectrum disorders. Soc Cogn Affect Neurosci. 2014;9:520–8. Yamada T, Ohta H, Watanabe H, Kanai C, Tani M, Ohno T, Takayama Y, Iwanami A, Kato N, Hashimoto R. Functional alterations in neural substrates of geometric reasoning in adults with high-functioning autism. PLoS One. 2012;7:e43220. Wakabayashi A, Baron-Cohen S, Wheelwright S, Tojo Y. The autism-spectrum quotient (AQ) in Japan: a cross-cultural comparison. J Autism Dev Disord. 2006;36:263–70. Oldfield RC. The assessment and analysis of handedness: the Edinburgh inventory. Neuropsychologia. 1971;9:97–113. Matsuoka K, Uno M, Kasai K, Koyama K, Kim Y. Estimation of premorbid IQ in individuals with Alzheimer’s disease using Japanese ideographic script (Kanji) compound words: Japanese version of National Adult Reading Test. Psychiatry Clin Neurosci. 2006;60:332–9. Cox RW. AFNI: software for analysis and visualization of functional magnetic resonance neuroimages. Comput Biomed Res. 1996;29:162–73. Behzadi Y, Restom K, Liau J, Liu TT. A component based noise correction method (CompCor) for BOLD and perfusion based fMRI. Neuroimage. 2007;37:90–101. Carp J. Optimizing the order of operations for movement scrubbing: comment on Power et al. Neuroimage. 2013;76:436–8. Power JD, Barnes KA, Snyder AZ, Schlaggar BL, Petersen SE. Spurious but systematic correlations in functional connectivity MRI networks arise from subject motion. Neuroimage. 2012;59:2142–54. Di Martino A, Zuo XN, Kelly C, Grzadzinski R, Mennes M, Schvarcz A, Rodman J, Lord C, Castellanos FX, Milham MP. Shared and distinct intrinsic functional network centrality in autism and attention-deficit/hyperactivity disorder. Biol Psychiatry. 2013;74:623–32.
Yamada et al. Molecular Autism (2016) 7:41
31. Zuo XN, Ehmke R, Mennes M, Imperati D, Castellanos FX, Sporns O, Milham MP. Network centrality in the human functional connectome. Cereb Cortex. 2012;22:1862–75. 32. Barnes KA, Nelson SM, Cohen AL, Power JD, Coalson RS, Miezin FM, Vogel AC, Dubis JW, Church JA, Petersen SE, Schlaggar BL. Parcellation in left lateral parietal cortex is similar in adults and children. Cereb Cortex. 2012;22:1148–58. 33. Nebel MB, Joel SE, Muschelli J, Barber AD, Caffo BS, Pekar JJ, Mostofsky SH. Disruption of functional organization within the primary motor cortex in children with autism. Hum Brain Mapp. 2014;35:567–80. 34. Nelson SM, Cohen AL, Power JD, Wig GS, Miezin FM, Wheeler ME, Velanova K, Donaldson DI, Phillips JS, Schlaggar BL, Petersen SE. A parcellation scheme for human left lateral parietal cortex. Neuron. 2010;67:156–70. 35. Meilă M. Comparing clusterings—an information based distance. J Multivar Anal. 2007;98:873–95. 36. Kahnt T, Chang LJ, Park SQ, Heinzle J, Haynes JD. Connectivity-based parcellation of the human orbitofrontal cortex. J Neurosci. 2012;32:6240–50. 37. Kelly C, Uddin LQ, Shehzad Z, Margulies DS, Castellanos FX, Milham MP, Petrides M. Broca’s region: linking human brain functional connectivity data and non-human primate tracing anatomy studies. Eur J Neurosci. 2010;32:383–98. 38. Dakin S, Frith U. Vagaries of visual perception in autism. Neuron. 2005;48: 497–507. 39. Gliga T, Bedford R, Charman T, Johnson MH, Team B. Enhanced visual search in infancy predicts emerging autism symptoms. Curr Biol. 2015;25: 1727–30. 40. Hahamy A, Behrmann M, Malach R. The idiosyncratic brain: distortion of spontaneous connectivity patterns in autism spectrum disorder. Nat Neurosci. 2015;18(2):302–9. 41. Jabbi M, Swart M, Keysers C. Empathy for positive and negative emotions in the gustatory cortex. Neuroimage. 2007;34:1744–53. 42. Leibenluft E, Gobbini MI, Harrison T, Haxby JV. Mothers’ neural activation in response to pictures of their children and other children. Biol Psychiatry. 2004;56:225–32. 43. Bartels A, Zeki S. The neural correlates of maternal and romantic love. Neuroimage. 2004;21:1155–66. 44. Chevallier C, Kohls G, Troiani V, Brodkin ES, Schultz RT. The social motivation theory of autism. Trends Cogn Sci. 2012;16:231–9. 45. Howlin P, Goode S, Hutton J, Rutter M. Adult outcome for children with autism. J Child Psychol Psychiatry. 2004;45:212–29. 46. Baron-Cohen S, Wheelwright S. The Friendship Questionnaire: an investigation of adults with Asperger syndrome or high-functioning autism, and normal sex differences. J Autism Dev Disord. 2003;33:509–17. 47. Bamiou D-E, Musiek FE, Luxon LM. The insula (Island of Reil) and its role in auditory processing. Brain Res Rev. 2003;42:143–54. 48. American Psychiatric Association. Diagnostic and statistical manual of mental disorders. 5th ed. Washington: American Psychiatric Publisher; 2013. 49. Takayama Y, Hashimoto R, Tani M, Kanai C, Yamada T, Watanabe H, Ono T, Kato N, Iwanami A. Standardization of the Japanese version of the Glasgow Sensory Questionnaire (GSQ). Res Autism Spectr Disord. 2014;8:347–53. 50. Tavassoli T, Hoekstra RA, Baron-Cohen S. The Sensory Perception Quotient (SPQ): development and validation of a new sensory questionnaire for adults with and without autism. Mol Autism. 2014;5:29. 51. Orekhova EV, Stroganova TA. Arousal and attention re-orienting in autism spectrum disorders: evidence from auditory event-related potentials. Front Hum Neurosci. 2014;8:34. 52. Lin IF, Yamada T, Komine Y, Kato N, Kashino M. Enhanced segregation of concurrent sounds with similar spectral uncertainties in individuals with autism spectrum disorder. Sci Rep. 2015;5:10524. 53. Bonnel A, Mottron L, Peretz I, Trudel M, Gallun E, Bonnel A-M. Enhanced pitch sensitivity in individuals with autism: a signal detection analysis. J Cogn Neurosci. 2003;2:226–35. 54. Stewart ME, Griffiths TD, Grube M. Autistic traits and enhanced perceptual representation of pitch and time. J Autism Dev Disord. 2015. epub ahead of print. PMID: 26189179. 55. Duerden EG, Taylor MJ, Lee M, McGrath PA, Davis KD, Roberts SW. Decreased sensitivity to thermal stimuli in adolescents with autism spectrum disorder: relation to symptomatology and cognitive ability. J Pain. 2015;16:463–71.
Page 15 of 15
56. Yasuda Y, Hashimoto R, Nakae A, Kang H, Ohi K, Yamamori H, Fujimoto M, Hagihira S, Takeda M. Sensory cognitive abnormalities of pain in autism spectrum disorder: a case-control study. Ann Gen Psychiatry. 2016;15:8. 57. Dosenbach NU, Nardos B, Cohen AL, Fair DA, Power JD, Church JA, Nelson SM, Wig GS, Vogel AC, Lessov-Schlaggar CN, et al. Prediction of individual brain maturity using fMRI. Science. 2010;329:1358–61. 58. Filippi M, Valsasina P, Misci P, Falini A, Comi G, Rocca MA. The organization of intrinsic brain activity differs between genders: a resting-state fMRI study in a large cohort of young healthy subjects. Hum Brain Mapp. 2013;34:1330–43. 59. Ecker C, Murphy D. Neuroimaging in autism—from basic science to translational research. Nat Rev Neurol. 2014;10:82–91. 60. Pauli WM, O’Reilly RC, Tal Y, Wager TD. Regional specialization within the human striatum for diverse psychological functions. Proc Natl Acad Sci U S A. 2016;113:1907–12.
Submit your next manuscript to BioMed Central and we will help you at every step: • We accept pre-submission inquiries • Our selector tool helps you to find the most relevant journal • We provide round the clock customer support • Convenient online submission • Thorough peer review • Inclusion in PubMed and all major indexing services • Maximum visibility for your research Submit your manuscript at www.biomedcentral.com/submit