An electrochemical model was developed to describe alternating current ac impedance experimental studies conducted on lithium-ion positive electrodes.
Journal of The Electrochemical Society, 152 共7兲 A1409-A1417 共2005兲
A1409
0013-4651/2005/152共7兲/A1409/9/$7.00 © The Electrochemical Society, Inc.
Alternating Current Impedance Electrochemical Modeling of Lithium-Ion Positive Electrodes Dennis Dees,a Evren Gunen,b,* Daniel Abraham,a,** Andrew Jansen,a,** and Jai Prakashb,** a
Argonne National Laboratory, Electrochemical Technology Program, Chemical Engineering Division, Argonne, Illinois 60439-4837, USA Department of Chemical Engineering, Illinois Institute of Technology, Chicago, Illinois, USA
b
An electrochemical model was developed to describe alternating current 共ac兲 impedance experimental studies conducted on lithium-ion positive electrodes. The model includes differential mass and current balances for the positive electrode’s composite structure, as well as details of the oxide-electrolyte interface. A number of specialized experiments were conducted to help define the parameter set for the model. The electrochemical ac impedance model was used to examine aging effects associated with the positive electrode. © 2005 The Electrochemical Society. 关DOI: 10.1149/1.1928169兴 All rights reserved. Manuscript submitted November 18, 2004; revised manuscript received January 19, 2005. Available electronically June 10, 2005.
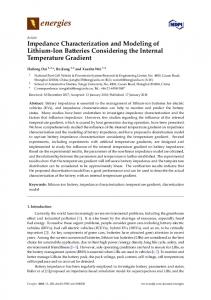
Various analytical diagnostic tools1-3 are being used to study high-power lithium-ion battery technology for hybrid electric vehicle applications under the U.S. Department of Energy’s Advanced Technology Development Program.4 Also under this program, a series of electrochemical studies is being conducted to examine the performance and aging characteristics of these batteries, which indicate that the positive electrode is the main contributor to the cell’s overall electrochemical performance degradation during aging.1,4-7 Therefore, we focus our attention on the positive electrode. The present modeling effort is directed toward associating changes that are seen in the post-test analytical diagnostic studies with the electrochemical performance degradation observed during testing. The positive electrode under study has a composite structure made of a layered nickel oxide 共LiNi0.8Co0.15Al0.05O2兲 active material, a carbon black and graphite additive for distributing current, and a PVDF binder all on an aluminum current collector. A representative scanning electron microscopy 共SEM兲 image 共Fig. 1兲 shows spherical secondary oxide particles, approximately 10 m in diameter, which are composed of faceted, approximately 0.2-0.5 m primary particles. The electrolyte is 1.2 M LiPF6 dissolved in a mixture of EC and EMC, and a Celgard microporous membrane is used as the separator. The negative electrode has a composite coating of graphite and PVDF binder all on a copper current collector. The experimental impedance and capacity data are mainly obtained on two types of cells: 共i兲 approximately 1 A h, cylindrically wound 18650 cells that provided most of the accelerated aging data,5,6 and 共ii兲 planar test cells with a Li-Sn microreference electrode that provided impedance data for the individual electrodes during cell aging.1,7 Model Description and Development Many investigators have used electrochemical impedance spectroscopy 共EIS兲 to study lithium-ion cells. References 8-12 represent a partial list of contemporary references pertaining to the study of lithium-ion positive electrode materials. The majority of the modeling of the EIS studies has been based on equivalent circuit models.13 Several investigators have used electrochemical models to study porous electrodes as briefly discussed in the work of Devan et al.14 Of these, Doyle et al. developed an electrochemical ac impedance model for a lithium-ion cell,15,16 on which the present study builds. Similarly to Doyle’s study, concentrated solution theory is used to describe the salt transport through the electrolyte; volumeaveraged transport equations account for the porous separator and composite electrode structure.17-19 The electrolyte transport equations in this study, given by Eq. 1 through 3 in Table I, varied
* Electrochemical Society Student Member. ** Electrochemical Society Active Member.
slightly in that they are based on the volume-averaged velocity of the electrolyte.19,20 Also given in Table I is the remaining current expressions 共Eq. 4 and 5兲 needed for the cells’ overall current balance, and the equations used to describe the electrochemical kinetics 共Eq. 6兲 and lithium transport in the oxide active material 共Eq. 8兲. Equation 6 is simply the classical Butler-Volmer reaction expression for a porous electrode, where U is the electrochemical reaction’s thermodynamic voltage and UR represents the voltage loss, given by Eq. 7, caused by the electrical contact resistance between the oxide and the carbon matrix. Table II contains a description of the nomenclature used in Table I. In a manner similar to Doyle and others,13,14,21 each of the dependent variables in the above equations is assumed to be equal to a constant steady-state quantity plus a small perturbation variable. As an example, the expansion of the salt concentration in the electrolyte is given in Eq. 9, where the constant value is indicated by the zero superscript and the perturbation variable is indicated by the tilde. The parameters that are a function of the dependent variables must also be expanded in the perturbation variables, as shown for the electrolyte salt diffusion coefficient 共D兲 in Eq. 10 c = c0 + ˜c = c0 + c⬘e jt = c0 + 共cR + jcI兲e jt D = 兩D兩c=c0 +
冉冏 冏 冊 dD dc
c=c0
˜c + ¯
关9兴 关10兴
The equations given in Table I are then linearized by dropping all terms that are second order or higher in the perturbation variables. The perturbation variables are further assumed to be sinusoidal in time with a frequency omega 共兲, as represented in Eq. 9 by the product of the prime variable and the exponential of the complex 共 j = 冑−1兲 variable in time 共t兲. It is important to note here that the prime variables can be complex, as shown in Eq. 9 with the R and I subscripted variables, and can depend on position, but not time. Substitution of the fully expanded dependent variables into the linearized equations results in each equation having a real and imaginary part that are coupled and must be solved simultaneously. Again, as an example, the real part of the electrolyte salt diffusion equation 共Eq. 1兲 is given by Eq. 11 and the imaginary part is given by Eq. 12 0 = cI +
o 0 d2cR 共1 − c ¯Ve兲共1 − 兩t+兩c=c0兲 di2R 兩D兩c=c0 2 + dx dx z + +F
0 = −cR +
o 0 d2cI 共1 − c ¯Ve兲共1 − 兩t+兩c=c0兲 di2I 兩D兩c=c0 2 + dx dx z + +F
关11兴
关12兴
The bulk transport equations and interfacial equations are coupled through the pore-wall flux density variable 共 jn兲. Electrode kinetics 共Eq. 6兲, thermodynamics, and diffusion of lithium in the
Journal of The Electrochemical Society, 152 共7兲 A1409-A1417 共2005兲
A1410
Figure 1. SEM micrograph showing the oxide particles, graphite, and acetylene black in the cathode laminate. The approximately 10 m diameter secondary oxide particle is made up of smaller “primary” particles.
active particles 共Eq. 8兲 are included as usual in electrochemical models.17,19 The unique feature of this work lies in the treatment of the oxide active material and the oxide-electrolyte interface. The detailed theoretical description of the oxide active materialelectrolyte interface, commonly referred to as the solid electrolyte interface or SEI, is based on post-test analytical diagnostic studies.1 The LiNi0.8Co0.15Al0.05O2 particles are known to have a thin surface LixNi1−xO layer, which has electronic and ionic properties that are different from the oxide bulk.1 Furthermore, surface films formed by interaction of the oxide particle with the electrolyte and combined with the polymer binder are observed on the particle surfaces. A TEM micrograph of the interface 共see Fig. 2兲 shows the surface films and LixNi1−xO layer on the oxide. Figure 2 also includes the physical model of the interface which parallels the micrograph. The surface film is assumed to be an ill-defined mixture of organic and
inorganic material through which lithium ions from the electrolyte must either diffuse or migrate across, or both, to react electrochemically at the surface of the oxide. The lithium is then assumed to diffuse through the oxide surface layer and into the bulk oxide material of the particle. The post-test studies have estimated the thickness of the oxide surface layer and film to be on the order of tens of nanometers. The interfacial portion of the model also includes a double-layer capacity added in parallel with the Butler-Volmer kinetic expression 共Eq. 6兲. Further, a localized electronic resistance 共Eq. 7兲 between the current carrying carbon and the oxide electrochemical interface is incorporated into the model. Capacitive effects, associated with the current carrying carbon and the film on the oxide, are also included for completeness. Based on the description above, the impedance from the kinetic and capacitive effects are relatively straightforward to include. The particle impedance from the diffusion of the lithium in the oxide material is given by Eq. 13
Zs =
冢
− Ks
dUb dcsb
z+F冑Dsi j
冢冑
1 + Ks
⫻
Ks
冣
冑
冉冑 冊 冉冑 冊 冉冑 冊 冉冑 冊
Dsb tanh ␦b Dsi
Dsb tanh ␦b Dsi
j tanh ␦i Dsb
j Dsi
j + tanh ␦i Dsb
j Dsi
冣
关13兴
In Eq. 13, the diffusion of lithium in the oxide is assumed to be one-dimensional and follows Fick’s law 共Eq. 8兲, with the characteristic lengths for the bulk material and interfacial layer denoted ␦b and ␦i, respectively. The bulk material and interfacial layer of the oxide particle are assumed to have unique properties, where Dsb and
Table I. Transport and electrochemical reaction equations used in model. Eq. no. 1
Equations
Description
¯ 兲共1 − to 兲i 兴 1 关共1 − cV c c e + 2 D + = t x x x z + +F
Concentrated solution volume-averaged binary electrolyte salt diffusion
2 i2 = −
共 兲
共
4 5
i1 = −eff
in = i0
7 8
兲
i2 = Fz+ajn x I = i1 + i2
3
6
兲共
t+o ln f ± 1 c s+ ⌽2 + 1+ − RT F n+ z++ x ln c c x
冦
冉 冊冉 c cref
冋 冋
␣A
Volume-averaged electrolyte current balance Total cell current density
⌽1 x
cT − cS cT − cS,ref
Ohm’s law for concentrated solution binary electrolyte
Ohm’s law for electronically conducting matrix
冊冉 冊 ␣A
cS
␣C
cS,ref
册
␣ AF 共⌽1 − ⌽2 − U − UR兲 − RT ␣ CF exp − 共⌽1 − ⌽2 − U − UR兲 RT exp
UR = Pz+Fjn
cS = ⵜ · 共DS ⵜ cS兲 t
册
ⴱ
冧
Butler-Volmer electrochemical reaction kinetic expression
Electronic contact resistance between oxide particle and carbon matrix Lithium diffusion in active material
Journal of The Electrochemical Society, 152 共7兲 A1409-A1417 共2005兲
A1411
Table II. Nomenclature used in Table I. Symbol
Description
Symbol
Description
a c cS cT
t+0 T U UR
D
Specific interfacial area Electrolyte salt concentration Lithium concentration in active material Maximum lithium concentration in active material Salt diffusion coefficient in electrolyte
Cation transference number Temperature Oxide open circuit potential Electronic oxide particle contact resistance potential loss Partial molar volume of the electrolyte
Ds f± F i1 i2 io in I jn n R si t
Oxide lithium diffusion coefficient Electrolyte salt activity coefficient Faraday’s constant Superficial electronic current density Superficial ionic current density Kinetic exchange current density Transfer current per unit of interfacial area Superficial total cell current density Pore-wall flux density Electrons transferred in electrochemical reaction Universal gas constant Stoichiometric coefficient Time
¯V e x z+ ␣ A, ␣ C p eff + ⌽1 ⌽2
Cell coordinate Cation charge number Transfer coefficients Oxide and carbon electronic contact resistance Effective electrode electronic conductivity Volume fraction of electrolyte Electrolyte tortuosity Cations per salt molecule Ions per salt molecule Electrolyte conductivity Potential of electronically conducting matrix Electrolyte potential
Dsi are the lithium diffusion coefficients and Ks is the partition coefficient for the lithium in the oxide and is given by Eq. 14 csb Ks = csi
关14兴
In Eq. 14, csb and csi are the equilibrium concentrations of lithium in the bulk material and interfacial layer of the oxide particle, respectively. Finally, it is assumed that the thermodynamic voltage, denoted as U, of both the bulk material and interfacial layer are related by Eq. 15 Ui共csi兲 = Ub共Kscsi兲
关15兴
Several simplifying assumptions were made to account for the impedance of the film on the oxide particle, given by Eq. 16. First, the film is assumed to act as a well-supported electrolyte with the lithium ions, denoted with a plus subscript, being a minor species19
Zf =
冉
− s+RT␦ f ␦f + f nF2c+0D+z+
j␦2f 4D+
j␦2f 4D+
关16兴
Second, the diffusion and migration are considered one-dimensional and the activity coefficients of all species were neglected. In Eq. 16, ␦ f is the film thickness and f is the film conductivity. D+ is the lithium-ion diffusion coefficient, and c+0 is the lithium-ion concentration at the film electrolyte interface in equilibrium with the electrolyte. The complex physical and chemical structure makes an accurate description of the film very difficult. However, Eq. 16 captures the salient features of the lithium ion transport phenomena through the film and contains more parameters than can unambiguously be determined, which is discussed further below. The relationship between electrochemical active area per unit electrode volume 共a兲 and the lithium diffusion length in the oxide active material depends on the assumed model of the oxide/ electrolyte microstructure. Examination of the positive electrode 共Fig. 1兲 indicates that the oxide consists of a relatively narrow distribution of approximately 10 m diameter secondary particles made up of submicron primary particles.1 The spherical shape of the secondary oxide particles has led some investigators to assume a spherical diffusion geometry.15,17 Verbrugge has shown for dc simulations that assuming either a radial or Cartesian coordinate lithium diffusion equation for the active material does not significantly affect the results.22 While the same conclusion may not follow for these ac impedance studies, in the present work a relatively simple relationship is assumed, given by Eq. 17 ␦s =
Figure 2. High-resolution TEM image showing the surface film, and LixNi1−xO type layer on the oxide particles along with the corresponding physical model of the solid electrolyte interface.
冉冑 冊 冊 冉冑 冊 tanh
s a
关17兴
Where. ␦s is the sum of the interfacial and bulk oxide characteristic lengths, and s is the oxide volume fraction in the electrode. Doyle took into account the distributed nature of the composite electrode structure by including a particle size distribution of the active material in the electrode. In the present work the possibility of multiple fractions of active material having unique characteristics and properties acting in parallel has been included in a manner similar to Darling and Newman.23 The pore-wall flux density variable 共 jn兲 is actually a sum of individual oxide fractions making up the total amount of oxide active material in the positive electrode. Each oxide fraction contains the same interfacial model, but can be as-
A1412
Journal of The Electrochemical Society, 152 共7兲 A1409-A1417 共2005兲
signed a unique set of parameters. The resulting expressions describing the interfacial and lithium diffusional impedance of the oxide are all analytical and can be written in a closed form. The interfacial expressions combined with the linearized differential mass and current balance equations result in a system of coupled differential equations that was solved numerically using a partial differential equation solver 共FLEXPDE兲 over the frequency range of interest. The model solution results in what are essentially potential, current, and concentration perturbation amplitude distributions 共e.g., cR and cI in Eq. 9兲 that can easily be converted into a complex impedance. Because people are more familiar with complex impedance plots, the theoretical results in this paper do not include the distribution of perturbation variables. Determination of Model Parameters The level of complexity of the electrochemical ac impedance model made determining all of its approximately 35 parameters independently a challenge. More than half of the parameters were set by cell construction, obtained from the literature, or estimated. The positive electrode open circuit voltage curve 共U兲 was determined from the slow cycling of button cells using the positive as the working electrode and lithium as the counter.1 The ionic conductivity of the electrolyte 共兲 is reported by Ding et al.24 Diffusion, Hittorf, and concentration cell studies were performed on a range of electrolyte salt concentrations to obtain a complete set of transport and thermodynamic parameters for the electrolyte 共D, t+0, and f ±兲.25 Underlying these electrolyte measurements, as well as the electrolyte transport equations, is the assumption that the mixture of carbonate solvents acts a single pseudosolvent. Following the Bruggeman equation, the electrode tortuosity 共兲 is assumed to be equal to the square root of the inverse of the electrode porosity.19 The electronic conductivity of the positive electrode 共eff兲 was estimated from the literature to be 0.3 ⍀−1cm−1.26 Considering the bulk conductivity of graphite and carbon, this value is considered reasonable.27 The electronic conductivity is not often measured, especially when the electrode is flooded with electrolyte. It is generally assumed to be acceptable if the utilization of the active material is high. The lack of experimental measurements, the difficulty in prediction, and the variation in materials and processing has resulted in considerable variation in the literature of the assumed electrode electronic conductivity.17,28,29 The estimated electronic conductivity of the positive electrode used in this work is more than two orders of magnitude higher than the effective ionic conductivity of the positive electrode, and high enough to effectively eliminate significant potential gradients in the carbon phase. As long as the electronically conducting phase is more conductive than the ionic phase, the current distribution in the electrode tends to be highest on the separator side, assuming all other factors are equal 共e.g., state of charge兲. Therefore, the results reported below would not significantly change even if the electronic conductivity was reduced by more than an order of magnitude. However, as the electronic conductivity of the electrode approaches and becomes less than the ionic conductivity, there is a corresponding shift in the current distribution towards the current collector side of the electrode. In general, for this case the fitted parameters for the model would have to be modified, but from limited studies with lower assumed electronic conductivities the conclusions drawn in this work are not expected to change. The parameters in the model that cannot be reasonably measured or estimated, most of which were associated with SEI phenomena, were determined from the reference electrode cell measurements.A typical complex impedance plot 共100 kHz to 10 mHz兲 for the positive electrode at 60% state of charge is given in Fig. 3a. The highfrequency minimum relates to the ohmic portion of the electrode impedance and includes contributions from the electronic conductivity of the electrodes and ionic conductivity of the electrolyte solution, as well as any electronic contact resistances associated with the cell hardware, current collectors, and electrode materials. The
Figure 3. Typical experimental positive electrode ac impedance curve at room temperature and 60% state of charge: 共a兲 100 kHz to 10 mHz; 共b兲 100 kHz to 1 mHz.
midfrequency arc 共100 kHz to 1 Hz兲 is generally associated with interfacial phenomena in the SEI region. While the overall shape of the midfrequency arc is obscured by the distributed effects of the porous positive electrode, at least two smaller arcs are visible, one with a maximum at about 10 kHz and another at about 100 Hz. As discussed below, each of these arcs can be associated with a separate interfacial phenomenon whose time constant corresponds to the frequency at which it occurs. The low-frequency 共⬍1 Hz兲 Warburg impedance tail can be attributed to bulk diffusional effects in the cell. This includes the diffusion of salt in the electrolyte and lithium in the oxide active material. The low-frequency limit for the data in Fig. 3a was chosen to correspond to the maximum time constant normally encountered in hybrid electric vehicle applications. The very low-frequency complex impedance results, shown in Fig. 3b, while sometimes difficult and always time consuming to obtain, are quite useful because it mostly relates to the diffusion in the oxide active material alone.
Journal of The Electrochemical Society, 152 共7兲 A1409-A1417 共2005兲
A1413
Figure 4. Electrode area specific impedance from 1 s constant current pulse.
In fitting the model to the positive electrode interfacial impedance, it became apparent that an adequate fit could be obtained with multiple parameter sets. While there is no fundamental reason that one or two of the interfacial phenomena discussed above would be more significant than the others, based on the present study and previous literature work8,9,30 two different scenarios were determined to be the most plausible. In one scenario the interfacial impedance is dominated by diffusion of lithium across the interface, which includes the thin oxide surface layer as well as the film on the oxide. The other scenario assumes that the interfacial impedance is dominated by classical electrochemical kinetics 共i.e., the impedance effects follow the Butler-Volmer kinetic expression兲. Establishing which scenario is more likely would make the fitting process easier and add to the overall confidence in the model. A series of current pulse experiments was conducted to help resolve whether either of these scenarios was applicable to the interfacial phenomena. The current pulse experiments involved applying a series of progressively increasing currents in 1 s pulses to the cell, while monitoring the change of cell and electrode voltages during each of the pulses. The change in electrode voltage from just before the current pulse to the voltage at the end of the 1 s current pulse was divided by the pulse current density to obtain the electrode area specific impedance. Based on impedance studies 共e.g., Fig. 3兲, limiting the pulse time to 1 s allowed enough time for the interfacial effects to be measured without significant interference from the bulk diffusional effects in the cell. Theoretically, if the interfacial effects follow the Butler-Volmer kinetic expression, then the measured area specific impedance from the pulse should decrease with increasing current density. At high currents the Butler-Volmer kinetic expression reduces to Tafel kinetics, which has a decreasing current-voltage slope 共i.e., electrode area specific impedance兲 with increasing current density. Conversely, diffusional impedance effects tend to increase slightly with current till the mass transfer limitation is approached, at which time the impedance rises dramatically. Therefore, if the interfacial effects were dominated by diffusion, then the measured area specific impedance from the pulse should increase with increasing current density. This differing impedance behavior as a function of current density between diffusional and kinetic effects can be used to help elucidate the interfacial phenomena. The results from the current pulse experiments taken on fresh cells, shown in Fig. 4, indicated that the interfacial effects of the negative electrode appeared to be dominated by kinetics, while the positive electrode exhibited a diffusional dominated behavior. It is important to recognize that the pulse experiments would not necessarily be conclusive if neither phenomenon dominated at the inter-
Figure 5. Comparison between electrochemical model and experiment for the positive electrode ac impedance 共100 kHz to 1 mHz兲 at 60% state of charge.
face. The qualitative analysis of the experimental data in Fig. 4 presented here was very useful in guiding the interfacial parameter fitting, but a much more in-depth electrochemical model is needed to fully analyze the experimental results. Fitting the electrochemical model to the low-frequency positive electrode Warburg impedance also proved to be a challenge. A bimodal particle distribution of oxide particles in the electrode was assumed. These two particle sizes were further assumed to only differ in active area and lithium diffusion length in the bulk oxide. This final assumption was important to help minimize the parameter set. The fit of the low-frequency ac impedance data indicated that approximately 40% of the oxide had a characteristic lithium diffusion length of 1.0 m and the remainder had a diffusion length of 2.6 m. Based on the oxide particle size measurements, these two characteristic lengths are assumed to be related to the extent to which the electrochemical reaction penetrates into the secondary particle. The fit between theory and experiment is given in Fig. 5 for the positive electrode ac impedance. The fit is good for the interfacial impedance portion of the curve 共i.e., the circular arc兲, as well as for the very low-frequency Warburg impedance data. The fit at the elbow of the Warburg impedance data could be improved by making small adjustments to the number and amount of particle size fractions or possibly by including radial diffusive effects for the lithium in the oxide particles. For completeness, the fitted parameters for the interfacial effects and lithium diffusion in the oxide particles are reported in Table III. One should use some degree of caution in making conclusions from the parameters in Table III. First, they are dependent on the experimental results, which can vary with time as discussed below. Second, the experimental results can be fitted with multiple parameter sets, based on the initial assumptions as described above. Also, the parameters are all based on an assumed electrochemically active area, which is estimated from the secondary particle size. Regardless of these assumptions, valuable information on positive electrode impedance changes can be obtained by varying these parameter values.
Journal of The Electrochemical Society, 152 共7兲 A1409-A1417 共2005兲
A1414
Table III. Model parameters for solid electrolyte interface. Symbol
Units
Description
Value
Dsi
cm2 /s
3.5 ⫻ 10−10
Dsb
cm2 /s
␦i
nm
Oxide layer lithium diffusion coefficient Bulk oxide lithium diffusion coefficient Oxide layer thickness Lithium partition coefficient for oxide Film lithium diffusion coefficient Film conductivity Film thickness Lithium film concentration Kinetic exchange current density Kinetic double layer capacitance Film capacitance Oxide/carbon electronic contact resistance Carbon additive capacitance
Ks D+
cm2 /s
f ␦f c+
⍀−1cm−1 nm M
io
2
mA/cm
Cd
f /cm2
Cf p
f /cm2 ⍀cm2
Cc
f /cm2
8.0 ⫻ 10−10 10 23 3.2 ⫻ 10−10 8.0 ⫻ 10−6 40 0.63 60
Figure 7. Simulation of the positive electrode ac impedance 共100 kHz to 10 mHz兲 at 60% state of charge, showing the effect of a factor of 5 reduction in the lithium diffusion coefficient through the film on the oxide.
10 10 0
0
Results and Discussion The high-power lithium-ion cells show impedance rise and capacity loss on accelerated aging.5,6 Studies in reference electrode cells indicate that the positive electrode is the main contributor to cell impedance increase.1,7 Furthermore, the change in impedance can be mainly attributed to an increase in the electrode’s interfacial impedance for cells that show up to 25% power fade. Typical increases in the cell’s interfacial arc in the range of 5-10 ⍀ cm2 with a capacity fade of 10-15% have been observed. The electrochemical ac impedance model was used to examine aging effects associated with the positive electrode by determining the impact of various parameter changes on the interfacial impedance. For cells that are aged beyond 25% power fade the positive electrode continues to exhibit increasing interfacial impedance and capacity loss, as well as an increase in the low-frequency Warburg impedance. It is beyond the scope of the present paper to discuss these high-power fade aging effects in any great detail. Obviously, changing any of the parameters associated with the interfacial phenomena has a direct impact on the interfacial impedance. For simplicity and other reasons, not all the interfacial param-
Figure 6. Simulation of the positive electrode ac impedance 共100 kHz to 10 mHz兲 at 60% state of charge, showing the effect of a factor of 5 reduction in the lithium diffusion coefficient through the oxide surface layer.
eters were varied during this study. Post-test examination of the positive electrode indicates that there was not a significant change in the interfacial layer thicknesses 共i.e., ␦ f and ␦i兲, so those parameters were not changed.1 Also, Ks and c+0 were held constant. While they are fitted parameters connected with the interfacial diffusional processes, they actually reflect thermodynamic information of the oxide layer and film on the oxide. This fact in itself does not prevent them from changing, but they would not be expected to change as dramatically as, say, the diffusion coefficients. The assumed dominance of diffusional effects at the interface makes the interfacial diffusion coefficients 共i.e., Dsi and D+兲 have a particularly strong influence on the interfacial impedance, but even with that bias it takes nearly an order of magnitude change in a diffusion coefficient to exhibit the change in impedance experimentally observed during aging. Figure 6 shows the effect on the positive electrode impedance of reducing the lithium diffusion coefficient through the oxide surface layer by a factor of 5, and Fig. 7 shows the corresponding effect for reducing the lithium diffusion coefficient through the film. In Fig. 6 and all subsequent figures the baseline impedance curve is the model simulation shown in Fig. 5, over the frequency range from 100 kHz to 10 mHz, that uses the interfacial parameters given in Table III. Even greater changes in the film conductivity 共 f 兲 and kinetic exchange current density 共io兲 are needed to have a significant impact on the interfacial impedance of the positive electrode. Figure 8 gives the effect on the positive electrode impedance of reducing the film conductivity by two orders of magnitude, and Fig. 9 gives the corresponding effect for the exchange current density. The primary reason that a relatively large change in the interfacial parameters is needed to have a significant impact on the positive
Figure 8. Simulation of the positive electrode ac impedance 共100 kHz to 10 mHz兲 at 60% state of charge, showing the effect of a two orders of magnitude reduction in the lithium conductivity through the film on the oxide.
Journal of The Electrochemical Society, 152 共7兲 A1409-A1417 共2005兲
Figure 9. Simulation of the positive electrode ac impedance 共100 kHz to 10 mHz兲 at 60% state of charge, showing the effect of a two orders of magnitude reduction in the kinetic exchange current density.
electrode’s impedance results from the ratio of the electrochemically active area to the geometric area, which is estimated to be about 10. This fact, combined with the redistribution of current in the positive electrode, which occurs as the interfacial impedance increases, tends to dilute the effect of the interfacial parameter changes.19 Small changes in the interfacial parameters not having a significant effect on the electrode impedance is generally a good thing. Nevertheless, since significant increases in the interfacial impedance are observed, one has to consider the likelihood of the large change in any one parameter. Because the relative changes needed in the interfacial diffusion coefficients are the least, one may preferentially suspect those parameters. However, the kinetic exchange current density is likely to be extremely sensitive to the characteristics of the SEI and can vary orders of magnitude, making it an important parameter also. Another factor that could adversely affect the positive electrode’s interfacial impedance is the isolation of some of the oxide from the electronically conducting carbon matrix. As discussed above, experimental studies indicate that there is some capacity loss associated with cell ageing. Figure 10 shows the simulation of the change in the impedance curve for a 20% loss of positive electrode capacity. Two cases are considered in Fig. 10, one where the isolation of all oxide particles occurs equally and the other where only the finer oxide particles 共i.e., the oxide particles with the shorter characteristic diffusion length兲 are isolated. As one may expect, isolation of the finer oxide particles exclusively has the greatest impact on the interfacial impedance because of the higher surface area of the finer particles. Close examination of the impedance curves in Fig. 10 indicate that there will also be a corresponding small change in the
Figure 10. Simulation of the positive electrode ac impedance 共100 kHz to 10 mHz兲 at 60% state of charge, showing the effect of a 20% capacity fade resulting from the electronic isolation of fine and average 共i.e., both fine and coarse兲 particles.
A1415
Figure 11. Simulation of the positive electrode ac impedance 共100 kHz to 10 mHz兲 at 60% state of charge, showing the effect of a drop in the electrode electronic conductivity 共0.3 to 0.001 ⍀−1 cm−1兲.
low-frequency Warburg impedance, but this change may be difficult to discern experimentally. The effect of the electronically conducting carbon matrix on the interfacial resistance may not be immediately obvious. Orders-ofmagnitude reduction in the electronic conductivity of the positive electrode 共eff兲 can have an impact on the interfacial impedance because of the associated change in the electrode current distribution. Simulations indicate that there is little change in the interfacial impedance, while there is a much more significant shift in the highfrequency intercept of the impedance curve, as shown in Fig. 11. An increase in the contact resistance between the electronically conducting matrix and the oxide active material 共 p兲 could also contribute to positive electrode impedance, as shown in Fig. 12. Because this is an electronic connection the capacitive effects associated with it would normally be considered small when compared to typical double-layer capacitances. However, because the carbon matrix can have an electrochemical double-layer capacitance 共Cc兲 associated with it, an increase in the electronic resistance between the carbon and the oxide can manifest itself as an increase in the interfacial impedance of the positive electrode 共see Fig. 12兲. Degradation of the electrolyte within the pores of the positive electrode can impact the electrode’s impedance. Similarly, changes in the composite structure of the electrode can also affect the impedance. Both of these possibilities are examined in Fig. 13, where a change in electrode impedance is shown resulting from an order of
Figure 12. Simulation of the positive electrode ac impedance 共100 kHz to 10 mHz兲 at 60% state of charge, showing the effect of an increase in the oxide and carbon electronic resistance 共0 to 10 ⍀ cm2兲, with and without a carbon double capacitance 共100 f /cm2兲.
A1416
Journal of The Electrochemical Society, 152 共7兲 A1409-A1417 共2005兲
Figure 13. Simulation of the positive electrode ac impedance 共100 kHz to 10 mHz兲 at 60% state of charge, showing the effect of an order of magnitude increase in the electrode’s tortuosity.
magnitude increase in the electrode’s tortuosity. There is a significant increase in the interfacial impedance, but also an increase in the Warburg diffusion impedance. Finally, the impact of a direct loss of electrochemically active area is examined in Fig. 14. As discussed above, reducing the active area implicitly increases the diffusion length of lithium in the oxide. Therefore, a loss of electrochemical active area would increase the interfacial impedance, but the increase would be accompanied by an increase in the Warburg diffusional impedance. Figure 14 shows that a significant fraction of the electrochemical area must be lost before a significant increase in the interfacial impedance occurs. Conclusions The electrochemical model developed in this study was effectively applied to ac impedance data obtained from lithium-ion positive electrodes. The number of parameters in the model made it necessary to conduct a series of specialized experiments to minimize the parameters obtained by fitting. One such investigation was the 1 s high-current pulse experiments. The pulse studies indicated that the interfacial effects of the positive electrode are dominated by diffusion early in life. This result helped guide the fitting of interfacial parameters in the model to the impedance data for the positive electrode. Fitting the low-frequency Warburg impedance to experimental data revealed that the active oxide material in the electrode exhibited behavior consistent with two characteristic diffusion lengths. In using the electrochemical ac impedance model to examine aging effects associated with the positive electrode, three possible
Figure 14. Simulation of the positive electrode ac impedance 共100 kHz to 10 mHz兲 at 60% state of charge, showing the effect of a 50% decrease in the electrochemically active area.
sources for the observed interfacial impedance increase were identified. First, changes in the electrolyte-oxide interfacial structure or properties could have a significant impact on the interfacial impedance. This is likely the primary source of the interfacial impedance increase. Further, the size of the parameter changes needed to account for the impedance increase suggests that there is a general degradation of the interfacial properties. Second, a loss of positive electrode capacity, particularly isolation of the finer oxide particles, would also cause the interfacial impedance to increase. Loss of electrode capacity can at best only be a minor contributor to the positive electrode’s interfacial impedance. Finally, a large increase in the resistance between the electronically conducting carbon matrix and oxide active material could result in an increase in the positive electrode interfacial impedance, provided the carbon matrix has a significant double-layer capacitance associated with it. A loss of electrochemically active area, degradation of electrolyte properties, or a change in electrode microstructure can also give rise to an increase in the positive electrode’s interfacial impedance. However, the associated change in the electrode’s low-frequency Warburg impedance would suggest that these effects probably are only significant in cells with more than 25% power fade. Acknowledgments Support from the Office of FreedomCAR and Vehicle Technologies, Tien Duong, Manager, Energy Storage R&D, at the U.S. Department of Energy, is gratefully acknowledged. Argonne National Laboratory assisted in meeting the publication costs of this article.
References 1. D. P. Abraham, J. Knuth, D. W. Dees, A. N. Jansen, E. Sammann, R. Haasch, R. D. Twesten, and S. MacLaren, in Power Sources for Transportation Applications, A. R. Landgrebe, Editor, The Electrochemical Society Proceedings Series, Pennington, NJ, In press. 2. D. P. Abraham, R. D. Twesten, M. Balasubramanian, J. Kropf, D. Fischer, J. McBreen, I. Petrov, and K. Amine, J. Electrochem. Soc., 150, A1450 共2003兲. 3. D. P. Abraham, R. D. Twesten, M. Balasubramanian, I. Petrov, J. McBreen, and K. Amine, Electrochem. Commun., 4, 620 共2002兲. 4. T. Q. Duong, Energy Storage Research and Development, 2003 Annual Progress Report, FreedomCAR and Vehicle Technologies Program, Energy Efficiency and Renewable Energy, U.S. Department of Energy, May 2004. 5. I. Bloom, S. A. Jones, V. S. Battaglia, G. L. Henriksen, J. P. Christopherson, R. B. Wright, C. D. Ho, J. R. Belt, and C. G. Matloch, J. Power Sources, 124, 538 共2003兲. 6. I. Bloom, S. A. Jones, G. L. Henriksen, V. S. Battaglia, C. G. Matloch, J. P. Christopherson, J. R. Belt, C. D. Ho, and R. B. Wright, in Power Sources for Transportation Applications, A. R. Landgrebe, Editor, The Electrochemical Society Proceedings Series, Pennington, NJ, In press. 7. D. P. Abraham, S. D. Poppen, A. N. Jansen, J. Liu, and D. W. Dees, Electrochim. Acta, 49, 4763 共2004兲. 8. M. D. Levi, G. Salitra, B. Markovsky, H. Teller, D. Aurbach, U. Heider, and L. Heider, J. Electrochem. Soc., 146, 1279 共1999兲. 9. F. Nobili, R. Tossici, F. Croce, B. Scrosati, and R. Marassi, J. Power Sources, 94, 238 共2001兲. 10. E. Barsoukov, D. H. Kim, H.-S. Lee, M. Yakovleva, Y. Gao, and J. F. Engel, Solid State Ionics, 161, 19 共2003兲. 11. K. Dokko, M. Mohamedi, M. Umeda, and I. Uchida, J. Electrochem. Soc., 150, A425 共2003兲. 12. K. M. Shaju, G. V. Subba Rao, and B. V. R. Chowdari, Electrochim. Acta, 48, 2691 共2003兲. 13. Impedance Spectroscopy Emphasizing Solid Materials and Systems, J. R. Macdonald, Editor, John Wiley & Sons, New York 共1987兲. 14. S. Devan, V. R. Subramanian, and R. E. White, J. Electrochem. Soc., 151, A905 共2004兲. 15. M. Doyle, J. P. Meyers, and J. Newman, J. Electrochem. Soc., 147, A99 共2000兲. 16. J. P. Meyers, M. Doyle, R. M. Darling, and J. Newman, J. Electrochem. Soc., 147, A2930 共2000兲. 17. T. Fuller, M. Doyle, and J. Newman, J. Electrochem. Soc., 141, 1 共1994兲. 18. P. De Vidts and R. E. White, J. Electrochem. Soc., 144, 1343 共1997兲. 19. J. Newman and K. Thomas-Alyea, Electrochemical Systems, John Wiley & Sons, New York 共2004兲. 20. J. Newman and T. W. Chapman, AIChE J., 19, 343 共1973兲. 21. R. Pollard and T. Comte, J. Electrochem. Soc., 136, 3734 共1989兲. 22. M. W. Verbrugge and B. J. Koch, J. Electrochem. Soc., 150, A374 共2003兲. 23. R. Darling and J. Newman, J. Electrochem. Soc., 144, 4201 共1997兲. 24. M. S. Ding, K. Xu, S. S. Zhang, K. Amine, G. L. Henriksen, and T. R. Jow, J. Electrochem. Soc., 148, A1196 共2001兲.
Journal of The Electrochemical Society, 152 共7兲 A1409-A1417 共2005兲 25. E. Gúnen, Ph.D. Thesis, Illinois Institute of Technology, Chicago, IL 共2003兲. 26. R. Dominko, M. Gaberšček, J. Drofenik, M. Bele, and J. Jamnik, Electrochim. Acta, 48, 3709 共2003兲. 27. Carbon and Graphite Handbook, C. L. Mantell, Editor, John Wiley & Sons, New York 共1968兲. 28. D. B. Baker and M. W. Verbrugge, J. Electrochem. Soc., 146, 2413 共1999兲.
A1417
29. W. B. Gu and C. Y. Wang, in Lithium Batteries, R. A. Marsh, Z. Ogumi, J. Prakash, and S. Surampudi, Editors, PV 99-25, p. 748, The Electrochemical Society Proceedings Series, Pennington, NJ 共1999兲. 30. M. G. S. R. Thomas, P. G. Bruce, and J. B. Goodenough, J. Electrochem. Soc., 132, 1521 共1985兲.