sensors Article
American Sign Language Alphabet Recognition Using a Neuromorphic Sensor and an Artificial Neural Network Miguel Rivera-Acosta 1 , Susana Ortega-Cisneros 1, * and Federico Sandoval-Ibarra 1 1 2
*
ID
, Jorge Rivera 2
ID
Advanced Studies and Research Center (CINVESTAV), National Polytechnic Institute (IPN), Zapopan 45019, Mexico;
[email protected] (M.R.-A.);
[email protected] (F.S.-I.) CONACYT-Advanced Studies and Research Center (CINVESTAV), National Polytechnic Institute (IPN), Zapopan 45019, Mexico;
[email protected] Correspondence:
[email protected]; Tel.: +52-333-777-3600 (ext. 1069)
Received: 24 July 2017; Accepted: 13 September 2017; Published: 22 September 2017
Abstract: This paper reports the design and analysis of an American Sign Language (ASL) alphabet translation system implemented in hardware using a Field-Programmable Gate Array. The system process consists of three stages, the first being the communication with the neuromorphic camera (also called Dynamic Vision Sensor, DVS) sensor using the Universal Serial Bus protocol. The feature extraction of the events generated by the DVS is the second part of the process, consisting of a presentation of the digital image processing algorithms developed in software, which aim to reduce redundant information and prepare the data for the third stage. The last stage of the system process is the classification of the ASL alphabet, achieved with a single artificial neural network implemented in digital hardware for higher speed. The overall result is the development of a classification system using the ASL signs contour, fully implemented in a reconfigurable device. The experimental results consist of a comparative analysis of the recognition rate among the alphabet signs using the neuromorphic camera in order to prove the proper operation of the digital image processing algorithms. In the experiments performed with 720 samples of 24 signs, a recognition accuracy of 79.58% was obtained. Keywords: feature extraction; contour detection; hand posture recognition
1. Introduction Deafness is a very important problem that affects people both economically and socially because all communication between individuals is through languages. Its main objective is to share information between a transmitter and a receiver using various channels (speech, writing, or gestures). Most of the population uses speech communication; thus, the integration of deaf people into society is very difficult because of the general lack of knowledge of sign languages. According to the World Health Organization, there are 360 million people worldwide with hearing loss, of which 32 million are children [1], which represents approximately 5% of the population. Therefore, it is a global problem. Research into sign language translation could solve many of the problems that deaf people face every day, allowing a flow of communication between any person and those with hearing disabilities. For the hand postures recognition problem, the hand contour is often used because it simplifies real-time performance. All of the current related work can be globally sorted into software and hardware based solutions. Several works can be found for the software based platforms, such as [2], which uses contours to obtain characteristic points to reduce the computation time, which is a similar approach to the system presented in this work; however, their interesting points extraction algorithms
Sensors 2017, 17, 2176; doi:10.3390/s17102176
www.mdpi.com/journal/sensors
Sensors 2017, 17, 2176
2 of 17
require many steps, such distance calculation between all of the pixels with the object contour, and some other full-frame scanning operations. Ghassem et al. [3] proposed a method to extract global hand features using the external shape, obtaining contour points between two consecutive convex hull vertices. However, their feature extraction method is not robust. In [4], an algorithm is used to represent objects in images with a fixed number of sample points, but they use 100 sample points to generate the descriptor of every contour, making their classification step very computationally complex. Lahamy and Lichti [5] presented a real-time hand posture recognition using a range camera that gives visual and distance data, using the closest pixels to the camera for hand area segmentation and a voxel representation on every incoming image to compare it with a database for classification. They reported a recognition rate of 93.88%; however, they used only 12 postures, avoiding consideration of the most similar American Sign Language (ASL) signs, e.g., “A”, “B”, “E”, among others. In addition, it was implemented on a desktop computer with software (sequential nature) and their hand descriptors contain a lot of data, which makes it computationally inefficient. Some researchers use more than one digital camera to obtain a 3D perception [6]. Although it has an accuracy of 95%, the high computer requirements and the marked gloves make it uncomfortable for real applications. Recently, the Microsoft Kinect® has been widely used [7–9] because of its ability to obtain depth information, which is very valuable for cropping the hand areas, if they overlap the face, allowing real-time applications, but a 53% of accuracy in ASL alphabet classification is reported, which is low nowadays. Additionally, the Kinect device requires a personal computer with the proper drivers installed. Cao Dong et al. [10] proposed a system that uses depth images with a Kinect device to create a hand skeleton for ASL alphabet recognition using a Random Forest learning model, reaching an accuracy near 90%. However, they require a colored glove to generate the training dataset. In [11], an FSL (French Sign Language) translation system is implemented as a web platform, whose application is wide because of the current availability of the internet, but their system uses a sign search engine based on an encoding of the FSL signs and is not based on image processing. Besides the power consumption and the many computational resources required, these programmed systems have a sequential nature; accordingly, the system could present a higher latency, making efficient real-time applications difficult. These research projects represent a huge advance in hand posture recognition tasks, but they are not intended to be applied in embedded platforms as most of them require a full computer, special colored gloves, and more than one sensor. Increasing the parallelism in the algorithms decreases the execution time. A common method for parallelizing the algorithms in software is to implement them in a Graphics Processing Unit (GPU) [12,13], although managing a GPU requires many computer resources and it cannot be used without an operating system with the proper drivers installed. For the hardware based solution, the algorithm is custom designed in hardware such as the Field-Programmable Gate Array (FPGA) used in this work, offering the possibility of parallelizing the algorithm and improving the execution time without dramatically increasing the resources needed [14]. This device allows for designing and developing complex systems with high parallelization and pipelining levels, while simultaneously implementing a microprocessor that executes software, all in a single chip. Hence, the hardware-based solution is more suitable for improving algorithm execution and gaining a significant reduction in computational complexity. In [15,16], systems are proposed to recognize 24 ASL alphabet signs implemented in a FPGA using frame-based Red-Green-Blue (RGB) cameras; nevertheless, the need of a colored glove makes it uncomfortable for practical applications and the usage of periodical cameras means that these systems require more operations for a single frame, including the need for full-frame scanning operations. Wang et al. [17] propose different models of neural networks using stochastic logic for the implementation of human postures classification systems in FPGA. There is another option in camera sensors that can be used for ASL recognition—the neuromorphic camera, which has an event-based behavior that only upgrades the pixel value when there is a light change in the scene. This particularity offers the advantage of not requiring periodical
Sensors 2017, 17, 2176
3 of 17
operations; in other words, if there is no movement in the scene, the system does not process any data. There are previous approaches for gesture detection using the Dynamic Vision Sensor (DVS) (the same used in the system presented in this manuscript), such as [18], where is presented an event-based gesture recognition system, which processes the event stream using a natively event-based processor from International Business Machines called TrueNorth, they use a temporal filter cascade to create spatio-temporal frames that are the input data to a CNN (Convolutional Neural Network) implemented in the event-based processor, and they reported an accuracy of 96.46%. In [19], a method is proposed to recognize the three hand poses in the game of Rock-Paper-Scissors, and the DVS128 sensor is used to capture frames. For the classification, they use a Bayesian network reporting an accuracy of 89%. Jun Haeng Lee et al. [20] proposed a gesture classification method with two DVSs to obtain a stereo-vision system, they use spike neurons to process the incoming events and an HMM (Hidden Markov Model) based classification stage, and they distinguish between 11 different gestures with movement. Taking advantage of the non-periodical behavior of the DVS, it is viable to increase parallelism in the algorithms improving the system speed when implemented in FPGA. The novel signature algorithm presented here is more suitable for implementation in digital hardware and does not require a full scanning of the image like the algorithms used in [16], increasing its importance. For the classification of the signs, a feedforward neural network was designed, which has resulted in a very good method for solving pattern recognition problems, yielding very good results. Additionally, this Artificial Neural Network (ANN) is easily implemented in digital hardware because it is mainly composed of simple operations such as addition and multiplication. Therefore, in this work, we propose an ASL alphabet recognition system implemented in an Altera DE2-115 board that counts with the USB host port required for the communication with the DVS and a proper video deployment port. It is used only one event-based neuromorphic camera. The proposed system does not require any special gloves, color specific background or a desktop computer. Moreover, it includes a novel algorithm to obtain the signatures using the contour. This algorithm is designed for applications in ASL alphabet classification tasks, and the ANN, which is fully implemented in the FPGA. This makes our system suitable for embedded applications, which results in a major portability, including high speed processing with low computational cost implementing customized hardware. As an overall result, this system could be focused as a smartphone accessory. The remainder of this paper is organized as follows: Section 2 contains a brief explanation of the system presented in this work and the requirements to replicate the experiments. The neuromorphic camera behavior is presented in Section 3. All of the image processing algorithms applied in this work are fully explained in Section 4. The classification system, including the hardware required to implement all of the ANN, is presented in Section 5, followed by the synergy between the hardware accelerators and the processor designed in the FPGA in Section 6. In Section 7, the results obtained in the simulations of the proposed algorithms for every of the 24 ASL signs and the response of the experiments performed with the overall system in a confusion matrix are presented. Section 8 contains the conclusions of the obtained results as well as a comparison with previously proposed hand posture recognition systems, including the future work and its relevance. 2. Experimental Methods The system presented in this paper is fully implemented in a FPGA. It classifies 24 of the ASL alphabet signs using the external contour of the hand in images received from a neuromorphic sensor. It consists of three main sub-systems, the first dedicated to communicating with the camera sensor and receiving the events, the second is the image processing algorithms, including noise filtering and edge sorting, and the last step is the classification using a system composed of a dynamic neurons, static ANN, data adjusting algorithms, and a comparator. As can be seen in Figure 1, the experiments have been performed in a controlled environment, with the sensor placed at approximately 30 cm from the hand user. Since the neuromorphic camera detects changes in the scene luminosity, a white light
Sensors 2017, 17, 2176
4 of 17
lamp synchronized with the system focused on the user hand has an on–off controller to ensure the light changes in the hand. This guarantees that all of the pixels of the hand will exceed their internal threshold Sensors 2017,sending 17, 2176 the event. 4 of 17
Figure 1. Experimental Figure 1. Experimental setup. setup.
3. Neuromorphic Sensor 3. Neuromorphic Sensor The neuromorphic sensor, also called DVS [21], is a sensorial system that consists of a silicon The neuromorphic sensor, also called DVS [21], is a sensorial system that consists of a silicon retina retina formed by pixels in a matrix. The DVS used in this research has a size of 128 × 128 formed by pixels in a matrix. The DVS used in this research has a size of 128 × 128 independent pixels. independent pixels. This matrix array is a sensorial retina and every pixel contains asynchronous This matrix array is a sensorial retina and every pixel contains asynchronous neuromorphic circuitry. neuromorphic circuitry. These pixels are sensitive to dynamic luminosity changes in the scene These pixels are sensitive to dynamic luminosity changes in the scene presented to the DVS; in other presented to the DVS; in other words, their neuromorphic circuitry allows them to not send data words, their neuromorphic circuitry allows them to not send data until an event occurs (changes in until an event occurs (changes in the scene). Such behavior gives the sensor the peculiarity of very the scene). Such behavior gives the sensor the peculiarity of very low power consumption, since the low power consumption, since the data traffic only exists when an event occurs. Therefore, the DVS data traffic only exists when an event occurs. Therefore, the DVS sends little redundant information in sends little redundant information in contrast to the conventional digital cameras, which contrast to the conventional digital cameras, which periodically transmit images in frames. Each event periodically transmit images in frames. Each event carries information, such as the event polarity, carries information, such as the event polarity, the coordinates in the matrix, and a timestamp value. the coordinates in the matrix, and a timestamp value. The event polarity indicates the type of transition occurring in the pixel, where a dark to light The event polarity indicates the type of transition occurring in the pixel, where a dark to light transition is called a positive event (ON), and a light to dark is a negative event (OFF). Every event is transition is called a positive event (ON), and a light to dark is a negative event (OFF). Every event is represented by 32 bits, which are arranged in four bytes. These bytes contain information about pixel represented by 32 bits, which are arranged in four bytes. These bytes contain information about pixel position, event polarity and timestamp. position, event polarity and timestamp. Neuromorphic Sensor Communication System Neuromorphic Sensor Communication System The neuromorphic sensor used in this research can be controlled through USB protocol [22], The the neuromorphic sensor used in this researchand canLinux be controlled through USB although DVS developers only provide Windows drivers; thus, part of thisprotocol research[22], was although the DVS developers only provide Windows and Linux drivers; thus, part of this research to migrate the driver into C code for a processor implemented in the FPGA. In order to communicate was to driverthe into C code for aa softcore processor implemented in the FPGA. to with themigrate DVS andthe manage whole system, processor was implemented withIna order SDRAM communicate with the DVS and manage whole system, softcore processor was implemented (Synchronous Dynamic Random Access the Memory) as data aand instructions memory that shares with a SDRAM (Synchronous Dynamic Random Access Memory) as data and instructions memory a 100 Mhz oscillator with the softcore microprocessor. that shares a 100 Mhz oscillator with the softcore microprocessor. The sensorial sub-system consists of a processor with its SDRAM embedded into the FPGA The sub-systemthe consists a processor with its controller SDRAM embedded intodifferential the FPGA platform sensorial used to implement system.ofThe On-The-Go USB generates the platform used to implement the system. The On-The-Go USB controller generates the differential signals and some communication stages imposed by the USB protocol and the neuromorphic sensor, signals and some communication stages imposed by the USB protocol and the neuromorphic sensor, as can be seen in Figure 2. as can be seen in Figure 2.
with a SDRAM (Synchronous Dynamic Random Access Memory) as data and instructions memory that shares a 100 Mhz oscillator with the softcore microprocessor. The sensorial sub-system consists of a processor with its SDRAM embedded into the FPGA platform used to implement the system. The On-The-Go USB controller generates the differential and some communication stages imposed by the USB protocol and the neuromorphic sensor,5 of 17 Sensorssignals 2017, 17, 2176 as can be seen in Figure 2.
Figure 2. Events reception system block diagram.
Figure 2. Events reception system block diagram.
4. Image Generation and Processing AllSensors of the information sent by the DVS consists of a set of basic events generated by 2017, 17, 2176 5 ofthe 17 retina Sensors 2017, 17, 2176 5 of 17 chip as noted above; therefore, the system needs to decode every event as well as create and process 4. Image Generation and Processing the image.4. Image WhenGeneration there is and onlyProcessing background noise, the period between incoming events is longer All of the information sent by the DVS of by a set of silicon basic events generated by thewhen retina there is because few dynamic luminosity changes are consists detected the retina. In contrast, All of the information sent by the DVS consists of a set of basic events generated by the retina chip as noted above; therefore, the system needs to decode every event as well as create and process movementchip in the hand, many events generated the every retina, representing a major increase in the as noted above; therefore, theare system needs to by decode event as well as create and process the image. When there is only background noise, the period between incoming events is longer the image. When there is only background noise, theWhen periodthis between incoming is longer USB bus traffic, reducing the period between events. happens, theevents system will store and because few dynamic luminosity changes are detected by the silicon retina. In contrast, when there is because few dynamic luminosity changes are detected by the siliconrepresents retina. In contrast, when there is count all of the incoming events within a period of 50 ms, which a theoretical movement in the hand, many events are generated by the retina, representing a major increaserate in theof 20 fps. movement in the hand, many events are generated by the retina, representing a major increase in the Then, itUSB creates the image andthe processes it. bus traffic, reducing period between events. When this happens, the system will store and USB bus traffic, reducing the period between events. When this happens, the system will store and
count all all of the incoming events which represents representsaatheoretical theoretical rate count of the incoming eventswithin withinaaperiod periodof of 50 50 ms, ms, which rate of of 20 20 fps.fps. 4.1. Noise Filter Then, it creates thethe image and Then, it creates image andprocesses processesit.it.
The first step in the image processing stage is to reduce the noise as much as possible in order 4.1. Noise Filter 4.1. Noise Filter to decrease useless information, and every image received by the system is submitted to a filter. TheThe first step in in thethe image the noise noiseas asmuch muchasaspossible possible order first step imageprocessing processingstage stageis is to to reduce the in in order to to This process eliminates pixels with few around the image. These are decrease useless information, andevery everyneighbors image received received by the isissubmitted toto aevents filter. This decrease useless information, and image the system system submitted a filter. This usually unwanted noise, and this filter is performed using the Equation (1) (See Figure 3): process eliminates pixels with few neighbors around the image. These events are usually unwanted process eliminates pixels with few neighbors around image. These events are usually unwanted noise, filter performedusing usingthe theEquation Equation (1) (1) (See noise, andand thisthis filter is is performed (See Figure Figure3): 3):
I (x, y) = 1̅ (̅ ifx,y) Σ Σ I(x + i,I(xy+ + j) ≥ i = j = {−1, 0, 1}. j) ≥≥5, 5, (x,y) = =11ififΣΣΣΣI(x + i,i, yy ++ j) 5, ii == jj=={−1,0,1}. {−1,0,1}. I(x-1,y-1)
I(x-1,y-1) I(x-1,y)
I(x-1,y)
I(x-1,y+1)
I(x-1,y+1)
I(x,y-1)
I(x+1,y-1)
I(x,y)
I(x+1,y)
I(x,y+1)
I(x+1,y+1)
I(x,y-1) I(x,y)
I(x,y+1)
(1)(1)
(1)
I(x+1,y-1) I(x+1,y)
I(x+1,y+1)
Figure 3. Pixelnoise noise filter filter neighborhood. Figure 3. Pixel neighborhood.
Figure 3. Pixel noise filter neighborhood. The resulting image in Figure 4c has very few noisy events and its shape is clear; therefore, it The resulting imageand in Figure 4c has very few few noisy events andand its its shape is isclear; Thebe resulting image in Figure 4c hassorted. very noisy events shape clear;therefore, therefore,ititmust be must tracked every contour pixel
be tracked and every tracked must and every contour pixelcontour sorted.pixel sorted.
(a)
(b)
(c)
Figure 4. Image filtering of “A” sign, (a) ASL alphabet (a)to event transition and events(b) (c) sign; (b) raw data sent by the neuromorphic sensor; (c) image after filtering.
Figure 4. Image to event transition and events filtering of “A” sign, (a) ASL alphabet sign; (b) raw Figure 4. Image to event transition and events filtering of “A” sign, (a) ASL alphabet sign; (b) raw data dataThis sentfilter by the neuromorphic sensor; afterfor filtering. eliminates few events, but(c)itimage is useful decreasing the time required to execute the sent by thealgorithm neuromorphic next for edgesensor; tracing.(c) image after filtering.
This filter eliminates few events, but it is useful for decreasing the time required to execute the Contour Detection next4.2. algorithm for edge tracing. The second image processing stage consists of an edge tracing algorithm, used to decrease
4.2.redundant Contour Detection information. In this step, most of the irrelevant events are eliminated. Figure 5 shows that the only information is stage the ASL sign external shape.tracing Prior toalgorithm, this stage, used an ASL is The second image preserved processing consists of an edge to sign decrease represented by approximately 7000 events, but, after this, it is represented by approximately 500 pixels. redundant information. In this step, most of the irrelevant events are eliminated. Figure 5 shows that
Sensors 2017, 17, 2176
6 of 17
Sensors 2017, 17, 2176
6 of 17
This filter eliminates few events, but it is useful for decreasing the time required to execute the next algorithm for edge tracing. 4.2. Contour Detection The second image processing stage consists of an edge tracing algorithm, used to decrease redundant information. In this step, most of the irrelevant events are eliminated. Figure 5 shows that the only information preserved is the ASL sign external shape. Prior to this stage, an ASL sign is Sensors 2017, 17,by 2176 6 of 17 represented approximately 7000 events, but, after this, it is represented by approximately 500 pixels. (a)
(b)
(c)
Figure 5. “A” ASL alphabet sign process: (a) ASL alphabet sign; (b) Dynamic Vision Sensor events; (c) resulting image.
The process used to obtain the external shape of every image received by the system is called the Moore–Neighbor algorithm [23]. The idea behind its process is simple, but the implementation is complex. An important term for the understanding of this algorithm is the Moore Neighborhood of a pixel, consisting of the eight pixels that share a side or corner with the pixel, which are called P1, P2, P3, P4, P5, P6, P7,(a)and P8, as can be seen in (b) Figure 6c. (c) The first step of this algorithm is to find the Start Pixel P; it can be found by checking every pixel Figure 5. “A” “A”ASL ASLalphabet alphabetsign sign process: ) ASL alphabet (b) Dynamic Vision Sensor Figure 5. process: (a)(a ASL sign;sign (b); Dynamic Vision Sensor events; from any image corner in any constant direction untilalphabet the pointer reaches the first object pixel shown ; events (c) resulting image. (c) resulting image. 6a1. in the first step of Figure Once the Start Pixel is found, a set of steps must be performed. Depending on the Moore– The process used to obtain the external shape of every image received by the system is called Thefrom process used tolast obtain the external shape of every received by the every systemMoore– is called Neighbor which the contour pixel was accessed, theimage pointer must check the Moore–Neighbor algorithm [23]. The idea behind its process is simple, but the implementation is the Moore–Neighbor algorithm [23]. The idea behind its process is simple, but the implementation Neighbor in a constant direction (clockwise or anticlockwise). For example, for the step (a1) in is complex. An important term for the understanding of this algorithm is the Moore Neighborhood of complex. important term for thefrom understanding of this algorithm is the Moore Neighborhood Figure 6, theAn Start Pixel was accessed its Moore–Neighbor P6; thus, Moore–Neighbors P7, of a pixel, consisting of the eight pixels that share a side or corner with the pixel, which are called P1, pixel, ofP5 themust eightbe pixels that in share side or corner with object the pixel, which are called P8,a P1, P2,consisting P3, P4, and checked thataorder until the next pixel is found. Then,P1, theP2, P2, P3, P4, P5, P6, P7, and P8, as can be seen in Figure 6c. P3, P4,repeats P5, P6,until P7, and P8, as can be seenisin Figure 6c. process a stopping criterion found. The first step of this algorithm is to find the Start Pixel P; it can be found by checking every pixel from any image corner in any constant direction until the pointer reaches the first object pixel shown (1) (2) (3) (4) in the first step of Figure 6a1. Once the Start Pixel is found, a set of steps must be performed. Depending on the Moore– Neighbor from which the last contour pixel was accessed, the pointer must check every Moore– P P P P P1 for P2 the P3 step (a1) in Neighbor in a constant direction (clockwise or anticlockwise). For example, (a) P8 P P4 Figure 6, the Start Pixel was accessed from its Moore–Neighbor P6; thus, the Moore–Neighbors P7, P7 P6 P5 P8, P1, P2, P3, P4, and P5 must be checked in that order until the next object pixel is found. Then, the process repeats until a stopping criterion is found. P
P
P
(1)
(2)
(c)
P
(3)
(b)
(4)
; Figure 6. 6. Moore–Neighbor (MN) algorithm demonstration, (a) starting stepssteps for MN algorithm Figure Moore–Neighbor (MN) algorithm demonstration, (a) starting for MN algorithm; (b)(b) lastlast steps for MN algorithm including stopping criterion; (c) Moore neighborhood of a pixel P. steps P for MN algorithm including stopping criterion; (c) Moore neighborhood of a pixel P. P
P
P
P1 P2 P3 (a) P8 second P P4 time, as The stopping criterion of this algorithm is when the Start Pixel is reached for the The first step of this algorithm is to find the Start Pixel P; it can be found by P7 checking P6 P5 every pixel
can be seen in the last step of Figure 6b1, or when the only object pixel is that from which it was from any image corner in any constant direction until the pointer reaches the first object pixel shown accessed. This last stopping criterion represents an open contour. in the first step of Figure 6a1. (c) P image is represented P P The resulting byP very few pixels, as can be seen in Figure 5c. This Once the Start Pixel is found, a set of steps must be performed. Depending on the Moore–Neighbor (b) hardware required to implement the ANN to carry out the represents a huge reduction in the digital from which the last contour pixel was accessed, the pointer must check every Moore–Neighbor in ASL alphabet classification, but is not enough to design an efficient classification system. a constant (clockwise(MN) or anticlockwise). For example, for the step in Figure 6, the ;Start Figure direction 6. Moore–Neighbor algorithm demonstration, (a) starting steps(a1) for MN algorithm There is still redundant information that must be eliminated to properly perform the Pixel(b) was accessed from its Moore–Neighbor P6; thus, the Moore–Neighbors P7, P8, P1, P2, last steps for MN algorithm including stopping criterion; (c) Moore neighborhood of a pixel P. P3, P4, classification through the ANN. and P5 must be checked in that order until the next object pixel is found. Then, the process repeats untilThe a stopping criterion is of found. stopping criterion this algorithm is when the Start Pixel is reached for the second time, as 4.3. Characteristic Pixel Extraction can be seen in the last step of Figure 6b1, or when the only object pixel is that from which it was In order to last design an efficient system withan low computational cost, the quantity of events accessed. This stopping criterion represents open contour. representing each ASL sign is must be decreased without of the object and The resulting image represented by very fewdegrading pixels, as the canshape be seen in Figure 5c. its This characteristics. Therefore, a set of processing stages was developed to reduce the number of pixels represents a huge reduction in the digital hardware required to implement the ANN to carry out the ASL alphabet classification, but is not enough to design an efficient classification system. There is still redundant information that must be eliminated to properly perform the
Sensors 2017, 17, 2176
7 of 17
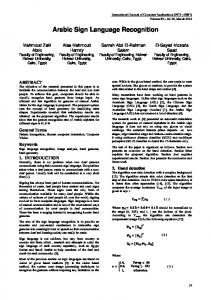
The stopping criterion of this algorithm is when the Start Pixel is reached for the second time, as can be seen in the last step of Figure 6b1, or when the only object pixel is that from which it was accessed. This last stopping criterion represents an open contour. The resulting image is represented by very few pixels, as can be seen in Figure 5c. This represents a huge reduction in the digital hardware required to implement the ANN to carry out the ASL alphabet classification, but is not enough to design an efficient classification system. There is still redundant information that must be eliminated to properly perform the classification through the ANN. 4.3. Characteristic Pixel Extraction In order to design an efficient system with low computational cost, the quantity of events 7 ofits 17 ASL sign must be decreased without degrading the shape of the object and characteristics. Therefore, a set of processing stages was developed to reduce the number of pixels representing every every contour, contour, which which will will be be called called characteristic characteristic pixels. pixels. With With the the purpose purpose of of reducing reducing representing characteristic pixels of every shape, an elimination criterion that allows deleting irrelevant characteristic pixels of every shape, an elimination criterion that allows deleting irrelevant information information without the contour must be selected. without affecting the affecting contour features mustfeatures be selected. The final final characteristic characteristic pixels pixels quantity quantity directly directly affects affects the the digital digital hardware hardware complexity complexity The implemented in the classification stage. Thus, some experiments were performed in order to find find the the implemented in the classification stage. Thus, some experiments were performed in order to minimum pixel quantity while maintaining the features of all the ASL alphabet signs. The first step minimum pixel quantity while maintaining the features of all the ASL alphabet signs. The first step is to to find find the the elimination elimination criterion. criterion. Therefore, Therefore, it it is is necessary necessary to to detect detect aa pattern pattern that that appears appears in in all all is ASL alphabet signs. Most of the sign shapes have vertical features, for example, the arm direction, ASL alphabet signs. Most of the sign shapes have vertical features, for example, the arm direction, finger contours, contours, angles, angles, and and the the distance distance between between them, them, as ascan canbe beseen seenin inFigure Figure7.7. finger Sensors 2017, 17, each 2176 representing
Figure Sign Language alphabet community used, used, including letters from A to Y excluding Figure 7.7.American American Sign Language alphabet community including letters from A to Y letter J. excluding letter J.
This is is the the reason reason for for selecting selecting the the vertical vertical derivate derivate as as the the first first evaluation evaluation criterion, criterion, by by calculating calculating This the vertical slope of the entire contour, all of the vertical vertex pixels of any shape can be found. the vertical slope of the entire contour, all of the vertical vertex pixels of any shape can be found. The contour contour slope slope is is calculated calculated using using Equation Equation (2), (2), where where PP represents represents the the characteristic characteristic pixels pixels The array and and nn is is the the size size of of the the characteristic characteristic array: array: array Slope = (Pi+1(y) – Pi(y))/(Pi+1(x) – Pi(x)), 1 ≤ i < n. (2) Slope = (Pi+1 (y) - Pi (y))/(Pi+1 (x) - Pi (x)), 1 ≤ i < n. (2) In Figure 8, where violet and blue arrows represent negative and positive slopes, respectively, In Figure 8, where violet and blue represent negative andsign positive slopes, respectively, the main vertices are characterized for arrows being found in vertical slope changes; thus, by storing the main vertices are characterized for being found verticalwithout slope sign changes; thus, by storing these points, the quantity of characteristic pixels is in reduced losing the main shape of the these points, the quantity of characteristic pixels is reduced without losing the main shape of the line. line. With this elimination criterion, the quantity of characteristic pixels is reduced to approximately 15. Using this compact characteristic array of pixels, it is feasible to classify the ASL signs.
The contour slope is calculated using Equation (2), where P represents the characteristic pixels array and n is the size of the characteristic array: Slope = (Pi+1(y) – Pi(y))/(Pi+1(x) – Pi(x)), 1 ≤ i < n.
(2)
In Figure 8, where violet and blue arrows represent negative and positive slopes, respectively, 8 of 17 the main vertices are characterized for being found in vertical slope sign changes; thus, by storing these points, the quantity of characteristic pixels is reduced without losing the main shape of the line. this elimination criterion, the quantity of characteristic pixels is reduced to approximately WithWith this elimination criterion, the quantity of characteristic pixels is reduced to approximately 15. 15. Using compact characteristic array of pixels, is feasible to classify signs. Using thisthis compact characteristic array of pixels, it isitfeasible to classify the the ASLASL signs. Sensors 2017, 17, 2176
Figure8. 8.Vertical Vertical slope slope of of aa curved curved line. line. Figure
Despite this elimination eliminationmethodology methodologybeing being effective in reducing unnecessary information, it Despite this effective in reducing unnecessary information, it does does not guarantee the quantity of characteristic pixels, obtaining 5 and in the not guarantee the quantity of characteristic pixels, obtaining between 5between and 30 pixels in 30 thepixels experiments, experiments, 13 in the case of a “U” sign, shown in Figure 9. Since this data is the input for the 13 in the case of a “U” sign, shown in Figure 9. Since this data is the input for the classification system, classification it is necessary that be of the size, a it is necessarysystem, that every characteristic pixelevery array characteristic be of the samepixel size, aarray requirement forsame this ANN. Sensors 2017, 17, 2176 8 of 17 requirement for this ANN.
(a)
(b)
(c)
Figure 9. result using the vertical slopeslope algorithm, (a) American Sign Language alphabet Figure 9. Shape Shapereduction reduction result using the vertical algorithm, (a) American Sign Language ; ; sign (b) output image of edge tracing algorithm (c) data representation after vertical slope algorithm. alphabet sign; (b) output image of edge tracing algorithm; (c) data representation after vertical slope algorithm.
4.4. Characteristic Array Adjusting 4.4. Characteristic Arraythe Adjusting In order to select best size of the characteristic array, a series of experiments was performed withIn different pixel using between and 20ofcharacteristic The size order tocharacteristic select the best sizequantities, of the characteristic array,10 a series experiments points. was performed selection criterion is the minimum quantity of points necessary to maintain the main features all with different characteristic pixel quantities, using between 10 and 20 characteristic points. Theofsize the ASL alphabet signs. The artificial neural network will be implemented in digital hardware in the selection criterion is the minimum quantity of points necessary to maintain the main features next thus, alphabet a larger characteristic needs a larger ANN,will requiring more hardware for its of allstage; the ASL signs. The array artificial neural network be implemented in digital implementation, and, as a consequence, more power will be consumed; therefore, redundant hardware in the next stage; thus, a larger characteristic array needs a larger ANN, requiring more information particularly harmfuland, to this hardware forisits implementation, as asystem. consequence, more power will be consumed; therefore, As can be seen in Figure 10b, using a size 20,system. regions with a high density of characteristic redundant information is particularly harmful to of this pixels are created (surrounded in green), representing redundant information, only one of pixels those As can be seen in Figure 10b, using a size of 20, regions with a high density ofas characteristic pixels gives(surrounded the information that representing this point is redundant part of theinformation, main shape.asThe resources are created in green), onlyhardware one of those pixels required for 20 characteristic pixels do not fit in our FPGA with our ANN architecture. Furthermore, gives the information that this point is part of the main shape. The hardware resources required for after the vertical pixels slope algorithm, most the ASL symbols’ characteristic pixels (CP) array after contains 20 characteristic do not fit in ourofFPGA with our ANN architecture. Furthermore, the no more than 20 CP; therefore, more time would be required to add pixels in order to fulfill the size vertical slope algorithm, most of the ASL symbols’ characteristic pixels (CP) array contains no more requirement (e.g., 20 to 50).time In the otherbe hand, using characteristic pixels, the main shape of all the than 20 CP; therefore, more would required to10 add pixels in order to fulfill the size requirement signs is maintained and well distributed, with very few crowded areas observed in some signs, and (e.g., 20 to 50). In the other hand, using 10 characteristic pixels, the main shape of all the signs is so this is the selected size. As noted above, the resulting size of the characteristic array is not maintained and well distributed, with very few crowded areas observed in some signs, and so this guaranteed; nevertheless, onlyabove, three possible casessize mayofoccur: the quantity of characteristic pixels is is the selected size. As noted the resulting the characteristic array is not guaranteed; greater, less or equal to 10.
pixels gives the information that this point is part of the main shape. The hardware resources required for 20 characteristic pixels do not fit in our FPGA with our ANN architecture. Furthermore, after the vertical slope algorithm, most of the ASL symbols’ characteristic pixels (CP) array contains no more than 20 CP; therefore, more time would be required to add pixels in order to fulfill the size requirement (e.g., 20 to 50). In the other hand, using 10 characteristic pixels, the main shape of all the Sensors 2017, 17, 2176 9 of 17 signs is maintained and well distributed, with very few crowded areas observed in some signs, and so this is the selected size. As noted above, the resulting size of the characteristic array is not guaranteed; nevertheless, only three cases occur:ofthe quantity ofpixels characteristic pixels is nevertheless, only three possible casespossible may occur: themay quantity characteristic is greater, less or greater, equal to less 10. or equal to 10.
(a)
(b)
(c)
Figure 10. Size selection: (a) “B” ASL alphabet sign; (b) image processing result with 20 characteristic Figure 10. Size selection: (a) “B” ASL alphabet sign; (b) image processing result with 20 characteristic pixels; (c) image processing result with 10 characteristic pixels. pixels; (c) image processing result with 10 characteristic pixels.
In the first case, less representative pixels should be eliminated, as they belong to high-density In thethis, first an case, less representative pixels should be eliminated, as they pixels, belongand to high-density areas. For algorithm calculates the distance between all subsequent then one of areas. For this, an algorithm calculates the distanceThis between all subsequent pixels, and then one of the the two closest characteristic points is eliminated. is repeated until a size of 10 is reached. two closest is eliminated. This isarray repeated until a size is reached.mentioned Figure characteristic 11 graphicallypoints represents the resulting in each cycle of of the10previously Figure17,112176 graphically representspoints the resulting array in each cycle the previously reducing The eliminated are surrounded by red, theofshape on the left mentioned represents Sensors 2017,algorithm. 9 of 17 reducing algorithm. The eliminated points are surrounded by red, the shape on the left represents the and the the result result of of the the vertical vertical slope slope algorithm algorithm with with 12 12 characteristics characteristics pixels, pixels, and the shape shape on on the the right right Figure Figure 11c 11c represents represents the the input input for for the the ANN. ANN.
(a)
(b)
(c)
Figure 11. Characteristic array down adjusting, (a) characteristic array of size 12; (b) characteristic Figure 11. Characteristic array down adjusting, (a) characteristic array of size 12; (b) characteristic array of of size size 11; 11; final characteristic array size array (c)(c) final characteristic array ofof size 10.10.
For the second case, where the array size is smaller than 10, pixels must be added in order to For the second case, where the array size is smaller than 10, pixels must be added in order to fulfill the requirements of the size imposed by the ANN. For this case, the image is separated into a fulfill the requirements of the size imposed by the ANN. For this case, the image is separated into finite number of sections, and the frontiers between those sections are marked with a violet vertical a finite number of sections, and the frontiers between those sections are marked with a violet vertical lines (See Figure 12). Although the quantity of sections can be changed, the more sections there are, lines (See Figure 12). Although the quantity of sections can be changed, the more sections there are, the more operations are needed. the more operations are needed. Figure 12 represents the Y sign of ASL. It was sectioned into three parts, with the purpose of recognizing which part has a lower quantity of characteristic pixels. Then, pixels are added to this section. Added pixels are selected from the obtained array in the contour detection algorithm explained in Section 4.2, and the only requirement is that the added pixel belongs to the section with fewer
(a)
(b)
(c)
Figure 11. Characteristic array down adjusting, (a) characteristic array of size 12; (b) characteristic array of size 11; (c) final characteristic array of size 10. Sensors 2017, 17, 2176
10 of 17
For the second case, where the array size is smaller than 10, pixels must be added in order to fulfill the requirements of the size imposed by the ANN. For this case, the image is separated into a finite number pixels. of sections, the the frontiers between those sections withofa violet vertical characteristic Thisand allows system to drastically reduce are themarked probability creating high lines (See Figure 12).density Although theDuring quantity sections can be changed, the more sections there that are, characteristic pixels areas. theofdevelopment of this algorithm, it was discovered the more operations are needed. some main features lost in the vertical slope algorithm were restored in this pixel addition process.
(a)
(b)
(c)
Figure 12. 12. Characteristic Characteristic array array adjustment, adjustment, (a) (a) characteristic characteristicarray arrayof ofsize size8;8; characteristic array Figure (b)(b) characteristic array of ; of size 9 (c) final characteristic array of size 10. size 9; (c) final characteristic array of size 10.
Figure 12 represents the Y sign of ASL. It was sectioned into three parts, with the purpose of Figure 13 shows the process used to adjust the characteristic array size of the L sign to 10, recognizing which part has a lower quantity of characteristic pixels. Then, pixels are added to this adding pixels to the section with fewer points. As noted above, the main feature of the L sign is also section. Added pixels are selected from the obtained array in the contour detection algorithm Sensors 2017, 17, 2176 10 of 17 restored during this process, increasing the importance of this pixel addition criterion. explained in Section 4.2, and the only requirement is that the added pixel belongs to the section with fewer characteristic pixels. This allows the system to drastically reduce the probability of creating high characteristic pixels density areas. During the development of this algorithm, it was discovered that some main features lost in the vertical slope algorithm were restored in this pixel addition process. Figure 13 shows the process used to adjust the characteristic array size of the L sign to 10, adding pixels to the section with fewer points. As noted above, the main feature of the L sign is also restored during this process, increasing the importance of this pixel addition criterion.
(a)
(b)
(c)
Figure 13. 13. Feature characteristic array of size 8; 8; (b)(b) characteristic array of size 9; (c) Figure Featurerestoration, restoration,(a)(a) characteristic array of size characteristic array of size 9; final characteristic array of size 10. (c) final characteristic array of size 10.
Remark 1. This algorithm can be used to extract the signature of any object with vertical features, e.g., the ASL alphabet symbols, and standing people, requiring previously a proper segmentation stage. Remark 1. This algorithm can be used to extract the signature of any object with vertical features, e.g., the ASL alphabet symbols, and standing people, requiring previously a proper segmentation stage. 5. Classification System The main purpose of this system is to classify the ASL alphabet based on the characteristic array 5. Classification System of the image; thus, a pattern recognition network is designed in hardware and implemented in a FPGA. ANNs consist finite number of basicthe artificial neuronsbased that exchange data. The array static The main purposeof of athis system is to classify ASL alphabet on the characteristic neuron is the most basic block of the ANN implemented in this system, and its structure is presented of the image; thus, a pattern recognition network is designed in hardware and implemented in a FPGA. in Figure 14. of The output function f depends on exchange the application of static the ANN and the ANNs consist a finite number of basic artificialprimarily neurons that data. The neuron is the connections of the neuron. most basic block of the ANN implemented in this system, and its structure is presented in Figure 14. The output function f depends primarily on the application of the ANN and the connections of the neuron. The output equation of a static neuron is: a = f[Σ(Wk × Pk ) + b].
Figure 14. Implemented static neuron architecture.
The output equation of a static neuron is:
(3)
neuron is the most basic block of the ANN implemented in this system, and its structure is presented alphabet symbols, and standing people, requiring previously a proper segmentation stage. in Figure 14. The output function f depends primarily on the application of the ANN and the connections of theSystem neuron. 5. Classification The main purpose of this system is to classify the ASL alphabet based on the characteristic11array of 17 of the image; thus, a pattern recognition network is designed in hardware and implemented in a FPGA. ANNs consist of a finite number of basic artificial neurons that exchange data. The static Another artificial implemented in thisinsystem is called theitsdynamic (DN), neuron is the type mostofbasic blockneuron of the ANN implemented this system, and structureneuron is presented which has a delayed behavior and the capacity of storing information; the input of the DN is sequential, in Figure 14. The output function f depends primarily on the application of the ANN and the as can be seenofinthe Figure 15. connections neuron. Sensors 2017, 17, 2176
Figure 14. Implemented static neuron architecture.
The output equation of a static neuron is: a = f[Σ(Wk × Pk) + b].
(3)
Another type of artificial neuron implemented in this system is called the dynamic neuron (DN), which has a delayed behavior and the capacity of storing information; the input of the DN is Figure 14. Implemented static static neuron neuronarchitecture. architecture. 14. Implemented sequential, as can be seen inFigure Figure 15. The output equation of a static neuron is: a = f[Σ(Wk × Pk) + b].
(3)
Another type of artificial neuron implemented in this system is called the dynamic neuron (DN), which has a delayed behavior and the capacity of storing information; the input of the DN is sequential, as can be seen in Figure 15.
Figure 15. Implemented dynamic neuron architecture.
The equation of of aa dynamic dynamic neuron neuron is: is: The output output equation
Sensors 2017, 17, 2176
11 of 17
a(t) = W1 × P(t) + W2 × P(t − 1). (4) a(t) = W1 × P(t) + W2 × P(t − 1). (4) 5.1. Classification System Specification 5.1. Classification Systemthe Specification In order to reduce size of the static neural network and digital ports of the main processor, a
Figure 15. Implemented dynamic neuron architecture. dynamic neuron was implemented preceding the static ANN. that the input theprocessor, dynamic In order to reduce the size of the static neural network andNote digital ports of the for main must be sequential (property that allowsthe to control the dynamic neuron usingfor only 32-bit aneuron dynamic neuron was implemented preceding static ANN. Note that the input theone dynamic The output equation of a dynamic neuron is: data bus). neuron must be sequential (property that allows to control the dynamic neuron using only one 32-bit In Figure 16, an example is a(t) presented where of = W1 × P(t) + W2the × P(tfirst − 1). row represents the number (4) data bus). characteristic the second and third rowsthe represent X- and the Y-coordinate each pixel, In Figure pixels, 16, an example is presented where first rowthe represents number of of characteristic respectively, andand the third last rows row DNI (Dynamic Neuron Input) represents therespectively, input data and for the the pixels, the second represent the X- and Y-coordinate of each pixel, dynamic neuron. last row DNI (Dynamic Neuron Input) represents the input data for the dynamic neuron.
Figure 16. 16. Dynamic neuron neuron input input arrangement. arrangement. Figure
Table 1 shows a time representation of the process performed by the dynamic neuron, where Table 1 shows a time representation of the process performed by the dynamic neuron, where valid valid data ticks represent the product of a valid X–Y coordinate of each of the 10 characteristic points. data ticks represent the product of a valid X–Y coordinate of each of the 10 characteristic points. The resulting characteristic array is presented in Table 1. As can be seen, the quantity of data The resulting characteristic array is presented in Table 1. As can be seen, the quantity of data was was reduced to half, and, consequently, the hardware necessary to implement the static pattern reduced to half, and, consequently, the hardware necessary to implement the static pattern recognition recognition ANN will be drastically lower. ANN will be drastically lower. Table 1. Dynamic neuron time representation.
Time(t) 1 2 3 4
P(t) 0 465 18 76
P(t−1) 0 0 465 18
a(t) 0 1658.7 1103.5 311.33
Valid Data √ √
Sensors 2017, 17, 2176
12 of 17
Table 1. Dynamic neuron time representation. Time(t)
P(t)
P(t-1)
a(t)
Valid Data
1 2 3 4 5 6 7 8 9 10 11 12 13 14 15 16 17 18 19 20
0 465 18 76 89 45 124 53 153 42 215 29 257 44 296 0 327 153 239 464
0 0 465 18 76 89 45 124 53 153 42 215 29 257 44 296 0 327 153 239
0 1658.7 1103.5 311.33 487.33 359.43 542.90 466.19 664.23 491.77 860.81 583.97 981.58 731.34 1154.2 661.55 1166.5 1276.6 1194.5 2189.3
√ √ √ √ √ √ √ √ √ √
The implemented pattern recognition ANN consists of two layers with 10 and 24 neurons. Figure 17 shows the structure of the ANN implemented in the system presented in this paper, and all of the outputs of the first layer are connected to all of the 24 neurons of the output layer. Sensors 2017, 17, 2176 12 of 17
Figure 17. 17. Implemented Implemented Artificial Artificial Neural Neural Network Network architecture. architecture. Figure
The second layer is the output connection of the ANN, which consists of 24 static neurons, The second layer is the output connection of the ANN, which consists of 24 static neurons, where each neuron output represents the similarity of the input to each of the 24 ASL alphabet signs. where each neuron output represents the similarity of the input to each of the 24 ASL alphabet signs. 5.2. ANN ANN Implementation Implementation in in Digital Digital Hardware Hardware 5.2. Usually,the theimage imageprocessing processing algorithms require a very resolution the thus, data; Usually, algorithms dodo notnot require a very highhigh resolution in theindata; thus, floating-point representation is avoided in order to reduce hardware requirements.This Thisisis why why floating-point representation is avoided in order to reduce hardware requirements. fixed-point representation is commonly used in image processing FPGA implementations; it allows fixed-point representation is commonly used in image processing FPGA implementations; it allows carrying out out many many fixed-point fixed-point arithmetic arithmetic operations operations with with relatively relatively little little hardware. hardware. The The word word length length carrying used isis32 32bits, bits,where wheremost mostsignificant significant sign 16 least significant are fraction used bitbit is is thethe sign bitbit andand thethe 16 least significant bits bits are fraction bits. bits. The bits of the integer section will be decreased because this system does not require big values. The bits of the integer section will be decreased because this system does not require big values. The dynamic dynamicneuron neuronconsists consists mainly of two 32 registers bit registers connected in series in to order to The mainly of two 32 bit connected in series in order obtain obtain the delayed as seen can be in 18. Figure 18. the delayed input asinput can be in seen Figure The logic behind static neurons is simpler because of its combinational behavior, but the hardware required to implement it is substantially larger. Figure 19 shows the block diagram of a static neuron, composed of combinational hardware; some tests will be performed to analyze the consequences of reducing the parallelism in these neurons.
Figure 18. Dynamic neuron hardware.
The logic behind static neurons is simpler because of its combinational behavior, but the
fixed-point representation is commonly used in image processing FPGA implementations; it allows carrying out many fixed-point arithmetic operations with relatively little hardware. The word length used is 32 bits, where most significant bit is the sign bit and the 16 least significant bits are fraction bits. The bits of the integer section will be decreased because this system does not require big values. The dynamic neuron consists mainly of two 32 bit registers connected in series in order to Sensors 2017, 17, 2176 13 of 17 obtain the delayed input as can be seen in Figure 18.
Figure 18. Dynamic neuron hardware.
The logic behind static neurons is simpler because of its combinational behavior, but the hardware required to implement it is substantially larger. Figure 19 shows the block diagram of a static neuron, composed of combinational hardware; some tests will be performed to analyze the consequences of reducing the parallelism these neurons. Figure 18. 18. in Dynamic neuron hardware. hardware. Figure Dynamic neuron The logic behind static neurons is simpler because of its combinational behavior, but the hardware required to implement it is substantially larger. Figure 19 shows the block diagram of a static neuron, composed of combinational hardware; some tests will be performed to analyze the consequences of reducing the parallelism in these neurons. Figure 19. 19. Static Static neuron neuron hardware. hardware. Figure
5.3. ANN ANN Training Training 5.3. The training trainingof of ANN was performed a desktop and the resulting The thethe ANN was performed using ausing desktop computercomputer and the resulting parameters parameters were storedinside in registers inside the FPGA. were stored in registers the FPGA. Figure 19. Static neuron hardware. of 720 input images was used, 30 For the training of the pattern recognition ANN, a community For the training of the pattern recognition ANN, a community of 720 input images was used, 30 for for every ASL and sign,alland all images to 10 characteristic pixels represented by 10 Xevery ASL sign, images reducedreduced to 10 characteristic pixels represented by 10 X- coordinates 5.3. ANN Training coordinates and 10 Y-coordinates, using the abovementioned and 10 Y-coordinates, using the abovementioned algorithms. algorithms. The training of the ANN was performed using a desktop computer and the resulting 6. Hardware–Software Hardware–Software Interface 6. parameters were storedInterface in registers inside the FPGA. Sensors 2017, 17, 2176 13 of30 17 For the training of the pattern recognition ANN, a is community of 720 input was used, The processor processorused usedto to communicate communicate withthe the DVS is also also used used to to control control theimages ANN implemented implemented The with DVS the ANN for every ASL sign, and all images reduced to complexity 10 characteristic represented by 10also Xin hardware. hardware. This represents a reduction the for thepixels network usage, which in represents reduction in theincomplexity for thebetween network usage, which increases increases the This performance ofathe whole system. The connection the ANN and also the processor coordinates and 10 Y-coordinates, using the abovementioned algorithms. the performance the whole system. The connection the two ANN andbuses. the processor is achieved is achieved usingofonly four digital buses, two addressbetween buses and data The inputs and the using only four digital buses, two address buses and two data buses. The inputs and the outputs of outputs of the ANN are redirected using a demultiplexer and a multiplexer, respectively, as shown 6. Hardware–Software Interface the ANN are in Figure 20. redirected using a demultiplexer and a multiplexer, respectively, as shown in Figure 20. The processor used to communicate with the DVS is also used to control the ANN implemented in hardware. This represents a reduction in the complexity for the network usage, which also
Figure 20. 20. System System interconnection. interconnection. Figure
This allows controlling all of the neurons in a relatively simple manner, and the software This allows controlling all of the neurons in a relatively simple manner, and the software required required to manipulate it is substantially simpler as well. Figure 21 shows the block diagram of the to manipulate it is substantially simpler as well. Figure 21 shows the block diagram of the classification classification system implemented in the FPGA, which contains the software implemented functions system implemented in the FPGA, which contains the software implemented functions including the including the data adjusting, sigmoid function and data compression (inside the processor block in data adjusting, sigmoid function and data compression (inside the processor block in Figure 21) and Figure 21) and hardware blocks (outside the processor block in Figure 21). hardware blocks (outside the processor block in Figure 21).
Figure 20. System interconnection.
This allows controlling all of the neurons in a relatively simple manner, and the software required to manipulate it is substantially simpler as well. Figure 21 shows the block diagram of the classification system implemented in the FPGA, which contains the software implemented functions Sensorsincluding 2017, 17, 2176 14 of 17 the data adjusting, sigmoid function and data compression (inside the processor block in Figure 21) and hardware blocks (outside the processor block in Figure 21).
Figure 21. Classification system data flow. Figure 21. Classification system data flow.
7. Experimental Results
7. Experimental Results
In order to know the precision of the image processing algorithms, we performed some
In order to with know theofprecision the processing algorithms, wethe performed experiments a total 720 imagesof(30 for image every ASL sign image) different from training setsome experiments with a total of 720with images (30 for every ASL signand image) from the training under controlled conditions no background movements using different the method detailed in Sensors 2017,controlled 17, 2176 14 of in 17 section two of thisconditions paper. set under with no background movements and using the method detailed section two of this paper. Figure 22 shows graphics with the signatures obtained in the image processing stage for the Figure 22 shows graphics with the signatures obtained in the image processing stage for the ASL alphabet signs, whose vectors are the input for the classification system. As shown in Figure 22, ASL alphabet signs, whose vectors are the input for the classification system. As shown in Figure 22, the letters “Q” and “L” have few similarities with other ASL sign arrays. the letters “Q” and “L” have few similarities with other ASL sign arrays.
Figure 22. ASL ASLalphabet alphabet signs signature used including letters A excluding to Y excluding J, Figure 22. signs signature used including letters fromfrom A to Y letter J,letter where where the X-axis represents the 20 X–Y coordinates of the 10 characteristic pixels in the format the X-axis represents the 20 X–Y coordinates of the 10 characteristic pixels in the format (X1, Y1, X2, (X1, Y1,X10, X2, Y2, . , X10, and the Y-axis the coordinates. value of the coordinates. Y2, …, Y10). .and the Y10) Y-axis represent therepresent value of the
These graphs represent the results obtained in simulations of the 20 X–Y pair coordinates for a single ASL alphabet sign. In the confusion matrix (Table 2), where columns represents target and rows represent system response, we can see that the best cases are the letters “L”, “Q”, and “T”, mainly because these signs
Sensors 2017, 17, 2176
15 of 17
These graphs represent the results obtained in simulations of the 20 X–Y pair coordinates for a single ASL alphabet sign. In the confusion matrix (Table 2), where columns represents target and rows represent system response, we can see that the best cases are the letters “L”, “Q”, and “T”, mainly because these signs have very few similarities with the others and their vertical features. Conversely, the worst case is the letter “B”, with only a 30% accuracy. Table 2. Confusion matrix. A
B
C
D
E
F
G
H
I
K
L
M N
O
P
Q
R
S
T
U
V
W X
Y
A 25 B 0 C 0 D 0 E 0 F 0 G 0 H 0 I 0 K 0 L 0 M 1 N 0 O 1 P 0 Q 0 R 0 S 2 T 0 U 0 V 0 W 0 X 0 Y 1
0 9 0 5 0 0 0 0 1 0 0 7 0 4 0 0 1 0 0 3 0 0 0 0
1 0 0 1 0 0 2 0 0 2 0 0 0 0 0 0 0 0 0 0 0 0 0 3 0 0 1 1 0 0 0 3 0 2 0 0 0 0 0 3 0 0 0 0 29 0 0 1 0 0 1 0 0 0 0 0 0 0 0 0 0 0 0 0 0 0 0 20 0 0 0 1 0 0 0 0 2 0 0 0 0 1 0 4 0 0 0 0 0 0 22 0 0 0 0 0 0 1 0 2 0 0 0 0 0 1 0 0 0 0 0 1 1 23 0 0 0 0 0 1 0 2 0 0 0 0 0 0 0 0 0 1 0 0 0 0 27 1 0 0 0 0 0 1 0 0 0 0 0 0 0 0 0 0 0 0 0 0 1 24 0 0 0 0 0 0 0 0 0 0 0 2 0 0 0 0 0 0 0 0 0 0 22 0 0 0 3 0 0 0 1 0 0 0 0 0 0 0 0 0 0 0 0 0 0 27 0 0 0 0 1 0 0 0 0 0 7 0 0 0 0 0 0 0 0 0 0 0 30 0 0 0 0 0 0 0 0 0 0 0 0 0 0 1 4 2 0 0 1 0 0 23 0 3 0 0 0 1 0 0 0 0 0 1 0 0 1 0 0 0 1 0 0 0 17 0 0 0 0 0 0 1 0 0 4 0 0 0 2 3 0 0 1 0 0 0 0 19 0 0 0 0 0 0 0 1 0 0 0 0 0 0 0 0 0 0 0 0 0 0 29 0 0 0 0 0 0 0 0 0 0 0 0 0 1 3 0 0 0 0 0 0 0 30 0 0 0 0 0 0 0 0 0 1 0 0 0 0 0 0 0 0 0 0 0 0 26 0 0 3 0 0 4 0 0 0 0 0 0 0 0 0 0 0 0 1 0 0 0 27 0 0 0 0 0 0 0 0 0 0 0 0 0 0 0 0 6 0 0 0 0 0 30 0 0 0 0 0 0 4 0 0 0 0 0 0 0 0 0 0 0 0 2 0 0 16 0 0 1 0 0 0 0 0 0 0 1 3 0 0 0 0 0 0 0 0 0 0 22 1 0 0 0 0 0 0 0 0 0 0 0 0 0 0 0 0 0 0 0 0 1 28 1 0 0 0 0 0 0 0 0 0 0 0 2 0 0 0 1 0 0 0 0 0 20 0 0 0 0 0 0 0 1 0 0 0 0 0 0 0 0 1 0 0 0 0 0 28
The overall accuracy percentage is around 80%, which is an acceptable result for the simplicity and easy implementation of the algorithms and the low resolution of the available neuromorphic sensor. The results obtained of the whole classification system are very dependent on the sign presented. The letter “B” was misclassified with many different signs, which we attribute to two factors: the low resolution of the DVS and the need for more robust characteristic pixel classification algorithms. Nevertheless, this is the first work that uses a Dynamic Vision Sensor with the proposed algorithms for the classification task, while proving that good results can be obtained using a non-frame-based sensor, reducing the need to periodically process images. Some previously presented systems [8] reported an accuracy around 53% using Microsoft Kinect for depth information. Kumar et al. achieved an accuracy as high as 90.80%, but they use two different sensors and their system was implemented in software requiring a computer, while other presented systems require specially colored gloves [15]. 8. Conclusions Hearing loss is a problem that affects 5% of the world population. Many efforts have been made to improve both the accuracy and the performance of the hand posture recognition tasks, but almost all of them require computers with operating system, making them unsuitable for embedded applications, which represents a more realistic approach because of the mobility of those platforms. For this reason, this work focuses on the development of a system in a FPGA, which can be implemented
Sensors 2017, 17, 2176
16 of 17
in an embedded platform with very low computational requirements. Additionally, the usage of the DVS with the abovementioned algorithms is a novel approach for ASL alphabet recognition, which significantly reduces redundant processing. The novel algorithms developed for this system were specially designed for American Sign Language classification using contours, which have proven to be very efficient for obtaining the feature vector for classifying the ASL alphabet using artificial neural networks. These vectors are also very suitable for use as a training set for the ANN, so few neurons are required for its implementation. The system accuracy is acceptable, considering the few operations required by its algorithms; the process performed to classify every image requires only one full image scan in the noise filtering step, which drastically reduces the operations required and the time taken to process an input image. With respect to RGB image processes such as gray scaling, morphological operations, and kernel based algorithms requiring full scanning and processing of the image, this has repercussions not only on the time needed for its algorithms, but also on the memory, which must be resized according to the input image. The accuracy of the overall system can be improved when the aforementioned main weaknesses are solved, noise filter stage is not robust enough to ensure a fast edge tracing process, leading to a bigger delayed response mainly because of this reason. Most of the lost symbol features are eliminated in the vertical slope algorithm because they are not vertical features. This results in a weak signature extraction in some ASL symbols, which affects the ANN training performance as well as the overall accuracy. Due to the nature of the signature extraction algorithm, it is not invariant to moderate orientation changes of the ASL symbol. Nevertheless, the images obtained for testing the system presented an angular variation of approximately ±8◦ . However, if this algorithm is applied to more rotation variant applications, it should be improved to decrease rotation sensitivity. There are still some tests and modifications to be made in order to increase the accuracy while maintaining the system simplicity. For example, changing the fixed point format could reduce required hardware. Adding more characteristic pixel selection criteria could lead to a more robust events processing stage, so horizontal features can be captured, yielding to a robust algorithm against hand rotations. An algorithm for detecting the time for the initial and final frames in the neuromorphic sensor for real-time application is another issue that remains. Other ANN architectures are being tested, including Convolutional Neural Network (CNN), and this architecture processes the input data without requiring pre-processing, avoiding in that way the noise filter. The Recurrent Neural Network (RNN), which has a sequential nature, therefore, is more suitable for the asynchronous spikes stream sent by the DVS. Acknowledgments: M.R-A. would like to thank CONACYT for supporting his work with grant number 336595. Author Contributions: M.R.-A. and S.O.-C. conceived and designed the experiments; M.R.-A. and F.S.-I. performed the experiments; M.R.-A. and J.R. analyzed the data; M.R.-A. wrote the paper. Conflicts of Interest: The authors declare no conflict of interest.
References 1. 2. 3.
4. 5.
World Health Organization. Deafness and Hearing Loss. Available online: http://www.who.int/ mediacentre/factsheets/fs300/en/ (accessed on 5 July 2017). Cong, Y.; Christian, F. Shape-based object matching using interesting points and high-order graphs. PRL 2016, 83, 251–260. [CrossRef] Ghassem, T.S.; Amirhassan, M.; Nasser, G.A. Rapid hand posture recognition using adaptive histogram template of skin and hand edge contour. In Proceedings of the 2010 6th Iranian MVIP, Isfahan, Iran, 27–28 October 2010. Junwei, W.; Xiang, B. Shape matching and classification using height functions. PRL 2012, 33, 134–143. [CrossRef] Hervé, L.; Derek, D.L. Towards real-time and rotation-invariant American Sign Language alphabet recognition using a range camera. Sensors 2012, 12, 14416–14441. [CrossRef]
Sensors 2017, 17, 2176
6.
7.
8. 9. 10. 11. 12.
13.
14. 15.
16. 17.
18. 19. 20. 21. 22. 23.
17 of 17
Watcharin, T.; Suchin, A.; Chuchart, P. American Sign Language recognition using 3D geometric inviariant feature and ANN classification. In Proceedings of the 2014 7th BMEiCON, Fukuoka, Japan, 26–28 November 2014. [CrossRef] Kin, F.L.; Kylee, L.; Stephen, L. A web-based sign language translator using 3D video processing. In Proceedings of the 2011 14th International Conference on NBiS, Tirana, Albania, 7–9 September 2011. [CrossRef] Nicolas, P.; Richard, B. Spelling it out: Real-time ASL fingerspelling recognition. In Proceedings of the 2011 IEEE International Conference on ICCVW, Barcelona, Spain, 6–13 November 2011. Pradeep, K. Himaanshu, Coupled HMM-based multi-sensor data fusion for sign language recognition. PRL 2016, 86, 1–8. [CrossRef] Cao, D.; Ming, C.L.; Zhaozheng, Y. American Sign Language alphabet recognition using microsoft kinect. In Proceedings of the 2015 IEEE Conference on CVPRW, Boston, MA, USA, 7–12 June 2015. [CrossRef] Mohammed, Z.; Zehira, H. An online reversed French Sign Language dictionary based on a learning approach for signs classification. PRL 2015, 67, 28–38. [CrossRef] Jaime, S.; Andrew, F.; Mat, C. Real-time human pose recognition in parts from single depth images. In Proceedings of the 2011 IEEE Conference on CVPR, Colorado Springs, CO, USA, 20–25 June 2011. [CrossRef] Cem, K.; Furkan, K.; Yunus, E.K. Randomized decision forests for static and dynamic hand shape classification. In Proceedings of the 2012 IEEE Computer Society Conference on CVPRW, Providence, RI, USA, 16–21 June 2012. [CrossRef] Byungik, A. Real-time video object recognition using convolutional neural network. In Proceedings of the 2015 International Joint Conference on ICJNN, Killarney, Ireland, 12–17 July 2015. [CrossRef] Sridevi, K.; Sundarambal, M.; Muralidharan, K.; Josephine, R.L. FPGA implementation of hand gesture recognition system using neural networks. In Proceedings of the 2017 11th International Conference on ISCO, Coimbatore, India, 5–6 January 2017. [CrossRef] Hiroomi, H.; Keishi, K. Novel FPGA implementation of hand sign recognition system with SOM-Hebb classifier. IEEE Trans. Circuits Syst. Video Technol. 2015, 25, 153–166. [CrossRef] Wang, X.; Chen, W.; Ji, Y.; Ran, F. Gesture recognition based on parallel hardware neural network implemented with stochastic logics. In Proceedings of the 2016 International Conference on ICALIP, Shanghai, China, 11–12 July 2016. [CrossRef] Arnon, A.; Dharmendra, M.; Tobi, D. A low power, fully event-based gesture recognition system. In Proceedings of the CVPRW, Honolulu, HI, USA, 22–25 July 2017; pp. 7243–7252. Eun, Y.; Jun, H.; Tracy, M. Dynamic vision sensor camera based bare hand gesture recognition. In Proceedings of the 2011 IEEE Symposium on CIMSIVP, Paris, France, 11–15 April 2011. [CrossRef] Jun, H.; Tobi, D.; Michael, P. Real-time gesture interface based on event-driven processing from stereo silicon retinas. IEEE TNNLS 2014, 25. [CrossRef] IniLabs. Available online: http://siliconretina.ini.uzh.ch/wiki/doku.php?id=userguide#user_guides_for_ dvs128_and_dvs128_paer_dynamic_vision_sensors (accessed on 23 May 2016). Universal Serial Bus Specification. Available online: http://www.usb.org/developers/docs/usb20_docs/ #usb20spec (accessed on 18 September 2017). McGill University. Available online: http://www.imageprocessingplace.com/downloads_V3/root_ downloads/tutorials/contour_tracing_Abeer_George_Ghuneim/index.html (accessed on 14 November 2016). © 2017 by the authors. Licensee MDPI, Basel, Switzerland. This article is an open access article distributed under the terms and conditions of the Creative Commons Attribution (CC BY) license (http://creativecommons.org/licenses/by/4.0/).


![[PDF] Learn the American Sign Language Alphabet: A ... - Google Sites](https://m.moam.info/img/260x300/pdf-learn-the-american-sign-language-alphabet-a-go_6477e08d097c474e708c30f3.jpg)