public services emerge as critical determinants of contentious politics, thus shedding light ... of low quality public s
AmericasBarometer Insights: 2013 Number 93
Prosperity and Protest in Brazil: The Wave of the Future for Latin America? By Mason Moseley
[email protected] Vanderbilt University Matthew Layton
[email protected] Vanderbilt University Executive Summary. Results from the 2012 AmericasBarometer Survey indicate that the current protests in Brazil are truly unprecedented in the country’s recent history. However, the 2012 data from Brazil also reveal certain trends in socioeconomic development and disenchantment with government performance that have created an environment ripe for the emergence of contentious demonstrations. In a regional analysis of protest participation, rising education levels, increased use of social media, and widespread dissatisfaction with public services emerge as critical determinants of contentious politics, thus shedding light on the recent demonstrations in Brazil. More generally, these findings suggest that across Latin America, the past decade of strong economic growth, advances in education and increased access to social media may portend a new era of protests in countries such as Chile, Uruguay, and Peru that have enjoyed similar periods of rapid socio-economic development amidst high levels of citizens dissatisfaction with public services.
The Insights Series is co-edited by Jonathan Hiskey, Mitchell A. Seligson and Elizabeth J. Zechmeister with administrative, technical, and intellectual support from the LAPOP group at Vanderbilt. www.AmericasBarometer.org
Putting the Brazilian Protests in Perspective Mason Moseley and Matthew Layton
W
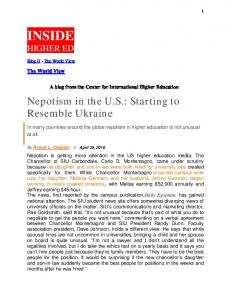
ith all eyes on Brazil during the recent Confederation’s Figure 1. Protest in the Americas, 2012 Cup—the precursor to next summer’s World Cup—the country 17.7% Bolivia 16.8% Haiti emerged as a picture of social 13.1% Peru disarray. What began on June 6 as a 12.7% Paraguay local conflict over a hike in public 11.1% Chile transportation costs in São Paulo 8.9% Guyana 8.7% Colombia evolved into a nationwide indictment 8.2% Nicaragua of low quality public services, 8.0% Dom. Rep. widespread political corruption, and 7.9% Argentina worsening inflation. These 7.8% Trinidad & Tobago extraordinary mass demonstrations 7.6% Uruguay 7.2% Guatemala are the largest and most contentious 7.0% Ecuador in Brazil since 1992, when protestors 6.9% United States called for and eventually achieved the 6.4% Honduras deposal of a sitting president.1 As 5.3% Canada 5.0% Belize hundreds of thousands of 4.9% Costa Rica demonstrators took to the streets 4.7% Brazil throughout the month of June, it 3.8% Suriname appeared that the “country of the 3.8% Mexico 3.7% Venezuela future” had now become embroiled in 3.6% Panama a highly contentious present. 3.6% El Salvador Jamaica 2.3% What led to this explosion of protests 0 5 10 15 20 in Brazil? Was there any way to Participated in a protest predict that Latin America’s most 95% Confidence Interval (Design-Effects Based) notable economic and political success Source: © AmericasBarometer by LAPOP story of the 2000s was on the verge of entering such a tumultuous period? Finally, what might these protests in Brazil Recent Protest Participation in imply for the rest of Latin American and Brazil Caribbean countries? In this Insights report, we look to the 2012 AmericasBarometer survey for As most commentators have noted, the events answers.2 of June are unprecedented in the recent history of Brazil. As recently as 2012, Brazil registered one of the lowest rates of protest participation in region, with only 4.7 percent of Brazilians claiming they had taken part in a protest rally or public demonstration in the previous year.3 This rate places Brazil well behind fellow 1 Notably, that president, Fernando Collor, has revitalized middle‐income South American countries like his political career and is now a senator for the state of Argentina and Chile, and even behind the Alagoas. United States and Canada. 2 Funding for the 2012 round mainly came from the United States Agency for International Development (USAID). Important sources of support were also the Inter-American Development Bank (IADB), the United Nations Development Program (UNDP), and Vanderbilt University. Prior issues in the Insights Series can be found at: http://www.vanderbilt.edu/lapop/insights.php. The data on which they are based can be found at http://www.vanderbilt.edu/lapop/survey-data.php
41,632 persons were asked the question PROT3: “In the last 12 months, have you participated in a demonstration or protest march?” The non-response rate was 0.51 for the whole sample.
3
© 2013, Latin American Public Opinion Project, Insights Series www.AmericasBarometer.org
Page 1
Putting the Brazilian Protests in Perspective Mason Moseley and Matthew Layton Because protest participation has been so low in Brazil—since the AmericasBarometer began in Brazil in 2006, it has never recorded a rate of over 6 percent—it would seem difficult to glean much from predictors of past participation. Below we look to other socioeconomic trends that might have made Brazil a ticking time bomb for contentious political activity.
Explaining the Current Protests
Figure 2. Satisfaction with Public Services in the Americas, 2012 Ecuador
60.0
Panama
59.1
Costa Rica
57.3
Nicaragua
57.3
Argentina Paraguay Mexico Suriname Honduras El Salvador Venezuela Dom. Rep.
54.8 54.3 53.8 52.9 52.8 52.8 51.3 50.9
50.7 Belize 50.4 Uruguay “Resource mobilization” theory argues that 48.8 Bolivia 47.6 Guyana protest movement formation depends both on 47.0 Guatemala 46.8 the existence of a particular grievance and Peru 45.7 Jamaica contentious actors’ access to the 44.4 Colombia 44.3 organizational resources that allow for a Chile 41.7 Brazil movement’s dissemination and growth 41.0 Haiti 40.4 (McCarthy and Zald 1977; Jenkins 1983). In Trinidad & Tobago other words, in addition to the presence of 0 10 20 30 40 50 60 Satisfaction with Public Services some motivating issue, potential protestors 95% Confidence Interval (Design-Effects Based) must also possess the tools necessary to Source: © AmericasBarometer by LAPOP foment and consolidate their movement by spreading it to additional actors. This (about 36% of GDP), and the perception that approach dispels the notion that protestors are citizens are paying rich country taxes for poor extremists in pursuit of drastic reforms and is country services.4 backed by substantial empirical evidence (e.g. Norris 2002, Norris et al. Figure 2 summarizes 2005, Dalton et al. 2010, While the current protests are Brazilians’ approval of Booth and Seligson 2009). three different public unprecedented in Brazil, services: the quality of In this section, we take roads, public schools, conditions were ripe for these two factors in turn, and public health focusing on the potential services. Respondents widespread demonstrations. grievances and rate their satisfaction or organizational resources dissatisfaction on a four‐ that could have facilitated the current point scale for each of these services. We recode demonstrations in Brazil. those responses on a 0‐100 scale where higher scores reflect higher satisfaction with services. Seeds of Discontent? From the average level of satisfaction with public service provision in these three areas, it is clear that Brazil ranks very low in Latin Public Services America, ahead of only Haiti and Trinidad and Despite Brazil’s substantial economic and social Tobago. This estimate coincides with recent gains over the past decade, Brazilians rank as some of Latin America’s most dissatisfied 4 “Taking to the Streets.” The Economist, June 22, 2013. citizens regarding the government’s provision http://www.economist.com/news/americas/21579857of social services. Much of this probably has to bubbling-anger-about-high-prices-corruption-and-poordo with the high taxes that Brazilians pay public-services-boils-over
© 2013, Latin American Public Opinion Project Insights Series www.AmericasBarometer.org
Page 2
Putting the Brazilian Protests in Perspective Mason Moseley and Matthew Layton news reports and some protestors’ messages that highlight the failure of Brazil’s public sector to match heightened expectations with corresponding improvements in service quality. Perceptions of Corruption Another common rallying cry of protestors has been that Brazil’s political system is fundamentally corrupt. In 2012, around 65 percent of Brazilians perceived that the political system was corrupt – a figure that is not necessarily high by regional standards, but which merits further attention as an individual level determinant of participation in protests. System Support Despite its recent economic boom, in 2012 Brazil ranked 22nd among 26 countries in the Americas in terms of support for national political institutions (Figure 3).5 As Booth and Seligson (2009) have noted, this type of disenchantment with the political system can motivate individuals to adopt more aggressive forms of political participation in an effort to make their voices heard. Thus, the low levels of support for key national political institutions we observe in Brazil might have created an environment where mass protests could potentially take hold, even if they had yet to actually appear in Brazil. Political Efficacy Another potential source of frustration theoretically fueling these protests is widespread dissatisfaction with Brazil’s system of democratic representation. In 2012, less than
5 Support for national institutions is measured by scale summarizing results of seven B‐series questions (B2 B3 B4 B6 B21 B13 B31): B2. To what extent do you respect the political institutions of (country)? B3. To what extent do you think that citizens’ basic rights are well protected by the political system of (country)? B4. To what extent do you feel proud of living under the political system of (country)? B6. To what extent do you think that one should support the political system of (country)? B13. To what extent do you trust the National Legislature? B21. To what extent do you trust the political parties? B31. To what extent do you trust the Supreme Court?
Figure 3. Support for the Political System in the Americas, 2012 Belize
62.1
Suriname
61.1
Canada
61.0
Nicaragua
60.8
Uruguay
59.8
Guyana
59.0
El Salvador
56.6
Venezuela
56.1
Mexico
55.9
Costa Rica
55.8
Colombia
55.6
Argentina
55.6
Chile
55.1
United States
53.5
Ecuador
53.5
Jamaica
53.4
Guatemala
52.3
Trinidad & Tobago
49.7
Peru
49.4
Dom. Rep.
48.7
Bolivia
48.0
Paraguay
47.1
Brazil
45.4
Haiti
44.2
Panama
44.1
Honduras
41.1
0
10
20
30
40
50
60
System Support 95% Confidence Interval (Design-Effects Based) Source: © AmericasBarometer by LAPOP
35% of Brazilians believed that politicians were interested in what people like them thought, an indication of how disconnected most Brazilians feel from their political system.
Increasing Organizational Resources The basis of the resource mobilization approach to understanding protest is that protestors are generally educated, interested in politics, and have access to organizational resources via traditional civil society groups or more recently, social media networks. In other words, the citizens who protest are usually the same ones who participate through “conventional” vehicles, and are, on average, more educated, affluent, and politically engaged than non‐protestors (e.g. Norris et al. 2005, Dalton et al. 2010).
© 2013, Latin American Public Opinion Project Insights Series www.AmericasBarometer.org
Page 3
Putting the Brazilian Protests in Perspective Mason Moseley and Matthew Layton
Years of Education Completed, Average
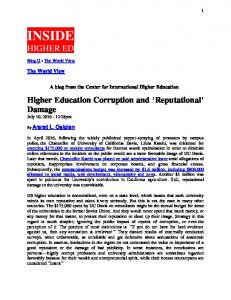
According to analysts, thirty‐five million Figure 4. Average Years of Education in Brazil, Brazilians have climbed out of poverty since 2008-2012 2003.6 Whereas in the early 1990s as much as 25 10 percent of the Brazilian population lived in 9.0 extreme poverty, that number fell to 2.2 percent 8.1 8 in 2009. In 2011, Brazil’s Gini coefficient, a 7.3 common measure of income inequality, reached a 50‐year low of .52.7 6 This economic progress is borne out in the 4 survey data as well. According to the 2012 AmericasBarometer survey of Brazil, the 2 country experienced substantial increases in average years of education completed, rising from an average of 7.3 in 2008 to 9.0 in 2012. 0 2008 2010 2012 Moreover, in 2012 Brazil ranked third to last in Year 95% Confidence Interval (Design-Effects Based) Latin America in food insecurity, illustrating Source: © AmericasBarometer by LAPOP the vast gains in poverty reduction obtained by a country once stricken by some of the most respondents’ self‐reported protest participation severe poverty in the region. These in the year prior to the 2012 survey. We use a developments create a more easily mobilized society, as more educated and less impoverished citizens are more likely to Figure 5. An Extended Model Predicting Protest have access to groups that recruit and Participation in the Americas organize activism via interpersonal F=43.748 N =31556 relationships or the Internet, and are Internal Efficacy more likely to be aware of the issues External Efficacy System Support facing Brazilians that could potentially Satisfaction with Public Health merit involvement in contentious modes Satisfaction with Roads of participation. Perception of Corruption Educational Level Community Participation
A Predictive Model of Protest Figure 5 presents findings from a logistic regression that analyzes individual‐level predictors of Latin American
Middle Class Age Political Interest Shared Political Information through a Social Network
Gupta, Girish. “Brazil’s Protests: Social Inequality and World Cup Spending Fuel Mass Unrest.” TIME Magazine, June 18, 2013. http://world.time.com/2013/06/18/brazilsprotests-social-inequality-and-world-cup-spending-fuelmass-unrest/ 6
The Gini Index ranges from 0-1 with a higher score representing a more unequal distribution of income. The Gini coefficient for neighboring Uruguay is .45, These data are drawn from the World Bank Brazil country review, accessed June 25, 2013: www.worldbank.org/en/country/brazil/overview and the World Bank development indicators page: http://data.worldbank.org/indicator/SI.POV.GINI 7
Woman -0.2
-0.1
0.0
0.1
0.2
0.3
0.4
95% C.I. (Design-Effects Based) Source: © AmericasBarometer by LAPOP, Country Fixed Included
regional analysis because there are too few observations of protest participation in the 2012 data from Brazil to offer sufficient insight into the recent mass demonstrations. This regional model, then, offers a more general treatment of what causes individuals to protest and allows us to investigate the explanatory value of some of the factors discussed above.
© 2013, Latin American Public Opinion Project Insights Series www.AmericasBarometer.org
Page 4
Putting the Brazilian Protests in Perspective Mason Moseley and Matthew Layton As predicted by the resource mobilization protest). Considering the widespread criticisms theory of protest, education, community of public services expressed in Brazil in 2012, activity,8 and interest in politics have a this finding would seem prescient in explaining the current conflict. Perceptions of corruption, powerful positive impact on the likelihood that on the other hand, fail to correlate with protest one participates in a protest. Clearly protestors behavior. across the region are more educated and politically involved citizens, who probably In 2012, on the heels of a decade of impressive have access to the organizational tools economic growth, the standard LAPOP series necessary for movement mobilization. Protestors also appear to be young, male, and of items measuring support for the system was surprisingly low. We now believe that low emerge from the middle class. Insofar as recent score was a leading indicator of the protests socioeconomic trends have increased the that have broken out, the particular catalyst for number of people who belong to these groups, which is of course unpredictable. In the Brazil has become a country where mass regional model, an increase in level of system protests are more likely. support decreases the One of the most probability of protest Socioeconomic progress combined participation. interesting findings In fact, from this logistic system support has with low quality political regression is the an even stronger institutions and poor public importance of effect on information sharing participating in a services might signal the rise of through social protest than protest throughout Latin America. satisfaction networks with in public services, the mobilizing protest most oft‐mentioned participation. In Brazil, where Internet usage has risen from rallying‐cry in Brazil. roughly 3 percent of the population in 2000 to 45 percent in 2012,9 this increased ability to Finally, measures of efficacy have an interesting dual effect on protest participation. share information regarding movement Internal efficacy—or the belief that one activities clearly plays an important role in understands the most important issues facing explaining why the current demonstrations the country—has an important positive impact arose now as opposed to before. on the probability of protesting. If internal efficacy has increased along with levels of Discontent like that expressed by protestors in education and interest in politics in Brazil, it Brazil also seems to have an important impact on the probability that one protests across the might be important in explaining why so many region. Specifically, satisfaction with public Brazilians currently feel affirmed in expressing their opinions in such an open and services like healthcare provision and the confrontational manner. However, external quality of schools decreases the probability of efficacy—the belief that politicians are protesting (conversely, dissatisfaction with interested in what the people think—decreases these services will increase the likelihood of the probability of protesting, suggesting those people have faith in more traditional, formal 8 Community participation is calculated as the average modes of representation. response to three questions regarding involvement in a religious organization, parents’ association, or general community improvement association. Internet World Stats: Usage and Population Statistics for Brazil, accessed July 3, 2013. www.internetworldstats.com/sa/br.htm
9
© 2013, Latin American Public Opinion Project Insights Series www.AmericasBarometer.org
Page 5
Putting the Brazilian Protests in Perspective Mason Moseley and Matthew Layton
Conclusion The recent protests in Brazil have been unprecedented due both to their sheer size and seemingly spontaneous nature. However, according to results from the 2012 AmericasBarometer survey, Brazil displayed several harbingers of potential protest activity, including widespread dissatisfaction with public services and core democratic institutions, increasingly high levels of education and Internet usage, and decreasing levels of poverty. Though a substantial majority of Brazilians also perceived that the political system was corrupt, we find no direct effect of these perceptions on the probability of protest activity. In many ways, the protests appear to be achieving their goals as we understand them from the AmericasBarometer data. Following the demonstrations against the bus fare hike in São Paulo, the local government reneged on the proposed rate increase. On June 24 President Dilma Rousseff announced an additional 23 billion dollars would be dedicated to public transportation, and renewed the government’s commitment to improving a variety of other public services. More surprisingly, she announced a five‐point proposal to reform the political system through constitutional amendment that included proposed changes to campaign finance law, the electoral system, replacement of senators, votes in Congress, and political party alliances. 10 Should these protests be viewed in a positive or negative light? On one hand, they appear motivated by grievances related to poor public services and a lack of faith in key political institutions—areas where the Brazilian government obviously needs to improve. While most of the demonstrations have been peaceful, violent actions on the part of both the protestors and the government are also 10http://g1.globo.com/politica/noticia/2013/07/dilmasugere-que-plebiscito-aborde-ao-menos-5-temas-dizcardozo.html
concerning. However, the findings presented above also indicate that the current demonstrations might have been made possible by a more educated and politically active citizenry that is finally taking ownership of their democracy. Indeed, one could argue that Brazil’s enormous social and economic gains over the past decade actually lie at the root of the current demonstrations, which have been led by educated, middle‐class Internet users rather than fringe extremists. Taking a step back from Brazil, then, our findings suggest that conditions may be ripe for an outburst of protest in many of the region’s countries where rising education rates and sustained economic growth combine with low quality political institutions and inferior and sporadic public service provision. While few countries will have a catalyst for protest similar to Brazil’s staging of multiple international sporting events, the potential for such widespread protests appears to exist in many Latin American regimes.
References Booth, John A. and Mitchell A. Seligson. 2009. The Legitimacy Puzzle in Latin America: Political Support and Democracy in Eight Nations. New York: Cambridge University Press. Dalton, Russell J., Alix van Sickle, and Steven Weldon. 2009. “The Individual‐Institutional Nexus of Protest.” British Journal of Political Science, 40: p. 51‐73. Jenkins, J.C. 1983. “Resource Mobilization Theory and the Study of Social Movements.” Annual Review of Sociology 9: p. 527‐553. McCarthy, John and Mayer N. Zald. 1977. “Resource Mobilization and Social Movements: A Partial Theory.” American Journal of Sociology Vol. 82, No. 6: pp. 1212‐ 1241.
© 2013, Latin American Public Opinion Project Insights Series www.AmericasBarometer.org
Page 6
Putting the Brazilian Protests in Perspective Mason Moseley and Matthew Layton Norris, P. 2002. Democratic Phoenix: Reinventing Political Activism. Cambridge University Press. Norris, Pippa, Stefaan Walgrave, and Peter Van Aelst. 2005. “Who Demonstrates? Antistate
Rebels, Conventional Participants, or Everyone?” Comparative Politics 37(2): p. 189‐ 204.
© 2013, Latin American Public Opinion Project Insights Series www.AmericasBarometer.org
Page 7
Putting the Brazilian Protests in Perspective Mason Moseley and Matthew Layton
Appendix Table 1. Determinants of Protesting in the Americas, 2012 Female Shared Political Information Interest in Politics Age Middle Class Community Participation Years of education Perception of Corruption Satisfaction with Roads Satisfaction with Public Health System Support External Efficacy Internal Efficacy Mexico Guatemala El Salvador Honduras Nicaragua Costa Rica Panama Colombia Ecuador Bolivia Peru Paraguay Chile Brazil Venezuela Argentina Dominican Republic Haiti Jamaica Guyana Trinidad & Tobago Belize Suriname Constant F Number of Observations
Coefficient ‐.1390** .3011** .3580** ‐.0783** .0516** .3167** .1389** ‐.0332 ‐.0624** ‐.0864** ‐.1595** ‐.0418 .1502** ‐.1275** ‐.02566 ‐.1355** ‐.01745 .03326 ‐.0503 ‐.1319** .00386 ‐.03364 .21024** .10680** .10808** .09379** ‐.114 ** ‐.17263** .03544 ‐.05433 .15017** ‐.2386 ** .05150 ‐.05343 ‐.04803 ‐.09950** ‐2.732 43.75 31,556
Standard Error .02401 .0216 .02537 .02628 .02026 .0234 .0286 .0254 .02591 .0258 .0267 .0258 .0274 .03794 .03578 .03728 .03639 .03256 .03685 .04537 .03346 .03568 .04783 .03217 .0336 .03853 .03497 .03833 .03461 .03370 .03519 .04570 .03589 .03428 .03388 .03857 .0322
Note: Coefficients are statistically significant at ** p