An Adaptive Genetic Algorithm for Cost Optimization of Multi-Stage Supply Chain Mohammad Zoqi Sarwani, Asyrofa Rahmi, Wayan Firdaus Mahmudy Faculty of Computer Science, University of Brawijaya (UB), Malang, Indonesia
[email protected]
Abstract—The distribution process of finished product is one of the important processes in the company. To maximize the profit, companies need to optimize the distribution network process by minimizing the costs. Genetic algorithm is proposed to find a solution of the problem. In this study, Genetic Algorithm use a one-cut-point (OCP) crossover, swap mutation, and elitism for the selection. Results obtained using GAs in this study is better than those achieved by baseline algorithm. This indicated that OCP crossover, swap mutation, and elitism selection are effective. To increase the quality of the solution, an adaptive genetic algorithm is proposed. The advantage of the adaptive process is producing more different chromosomes. Thus, the adaptive solution gives more efficient solution in minimizing the cost compared to the traditional genetic algorithms. Index Terms—Genetic Algorithms; Supply Chain; Cost Optimization.
I. INTRODUCTION Every manufacturing company is very familiar with the term distribution. Distribution is the delivery of production (finished products) from producers to customers [1], [2]. Wide area coverage in the distribution process resulting product must be delivered to some stage before it gets to the customer [3]. The process is often referred to as multistage/multilevel distribution. In line with the opinion of R. R. P. Langroodi and M. Amiri [4] which state that the multistage distribution is the delivery from the manufacturer/plant to the distributor and then underneath the distributor to the customer. The stage that is intended consists of distributor centers, retailers, agents. The number of levels used by the company has an impact on the cost because it has a longer distribution network. This is contrary to the desire of companies that want to gain a lot in order to stay ahead when competing with other companies [3]. Therefore, minimizing the costs is very important in the distribution process [1]. There are several previous studies conducted for the issue of the distribution network. In terms of the distribution network related research include the study [2], [5] which solve the problem of distribution by using two-stage distribution. In the study, there is central distributor located between manufacturers and customers as an intermediary so that manufacturers are not directly sent to customers but through a distributor center first and that study only used one type of product [2]. The other study [6] also solves the problem of the distribution with the distribution of three stages involving manufacturers, distributors, wholesalers and agents, also only using one type of product. Some algorithms have also been used to solve distribution problems. Some of them are from the statistical approaches
[7]–[9] and the other researchers [10][11] using particle swarm optimization (PSO) to resolve the problems that exist in distribution. In a study by Király, Varga, and Abonyi [11] describes the limitations that occur in distribution problems if solved using PSO. In addition, the complexity of the problems in the distribution can also be solved using genetic algorithms [2], [3], [12]. Based on previous studies using different strategies and methods to solve the problems of distribution, so in this study to solve the problems of product distribution using distribution strategy of multi-stage and just focus on one type of product. This strategy is chosen to provide flexibility in resolving problems for the distribution of both large and small companies. This study is an extension of previous studies that also use genetic algorithms (GAs) to find solutions to the problems [12]. In that study, the problem of distribution used is multi-stage and only using one type of product and use the extended intermediate crossover operator, insertion mutation, also roulette-wheel in the selection process. But in this new research uses the one-cutpoint (OCP) crossover, swap mutation and elitism selection. Referring to the same data for both studies, researchers compared the results of fitness and the cost obtained from previous research. Then to reduce the cost, genetic operators that have been selected are processed adaptively. Based on several studies [13], [14], besides the process of adaptive GAs is very helpful in minimizing the cost compared to traditional GAs, it is also able to avoid the trap of local optimum II. LITERATURE REVIEW Referring to the problem of multi-stage distribution that has been declared in the first section shown that the problem is very important to be solved. This interesting problem leads researchers to dig further on distribution problems and try to solve them. Some approaches with regard to finding solutions to problems of distribution have been done using some statistical approaches [7]–[9], simulated annealing [15] and evolution algorithms such as particle swarm optimization [11] and genetic algorithms [2], [3], [12]. Statistical approaches have been implemented for resolving the problem of distribution are the min-max approach, linear programming, and mathematical programming [7]–[9]. One of them applies linear programming to completing the process of distribution and novelty proposed is chosen the best candidate method (CBM) so that it can achieve the optimal solution [8]. Using singlestage distribution, this model became an attractive alternative as a solution to a classic problem. The resulting performance is fast enough if compared to existing methods. In contrast, to the other study [9], the distribution network used is the distribution network of two stages, namely the distribution of
e-ISSN: 2289-8131 Vol. 9 No. 2-7
155
Journal of Telecommunication, Electronic and Computer Engineering
products from the plants to the customer must go through a central distributor first and in that study, the product is used more than one type. Constraints are used already includes the whole search for solutions in the distribution of resources among others, stock inventory, production, transportation costs. Optimization model proposed in the study applying the integer programming and the solutions sought the help of special applications such as LINGO. The advantage of this model is to find the flow distribution (variable decision) is used and offers a variety of possibilities for decision support through analysis of available capacity on the distributor and the number of the transport unit. However, the weakness of this approach is referred to as the approach is intuitive and consistent with the standard form of linear programming so it's not very useful in practice because of the differences in the size of the model that is implemented The meta-heuristic algorithm also ever solve the problems of distribution such as simulated annealing [15]. The delivery of the product to the customer using a cross-docking center with a short storage time. Mix-integer programming is used to formulate the problems which are solved using simulated annealing. Based on that the proposed algorithm, the results obtained provide solutions that are effective and efficient in minimizing the total cost of transport in the cross-docking network. However, the study failed to consider the distribution of multi-stage flexible distribution problems. Research by background optimization is incomplete if it does not try to be solved using evolutionary algorithms such as particle swarm optimization (PSO) [11] as well as genetic algorithms [2], [12]. Completion of using PSO combined using Monte Carlo Simulation. The goal is to determine the optimal reorder point warehouses, so that the objective function on the holding and order costs that represented by a linear combination could be minimal. Results fatherly flexible enough to handle the complex situation is shown by the developed stochastic simulator and optimization tool. Then the genetic algorithm tries also to resolve the distribution problems in two ways, namely by considering the transportation costs per unit, the fixed costs associated with the route and the infinite capacity of each distributor center (DC) and the way followed is considering opening cost of distributor centers, per-unit transportation costs from plant to DC and DC to a customer [2]. The benefit is that the proposed algorithm provides a better solution to the computational experiment than the respective best-existing algorithms for the two procedures. However, the research only applies two stages. Making it less flexible for multi-stage problems. Genetic algorithms are also used in the study [12]. In that study, GAs already raised the issue of multi-stage distribution. The result of GAs is compared with the Random Search and found that the results of GAs more qualified than random search. For the development of that research [12] with the aim of obtaining optimal results, this research study conducted multi-stage distribution problems using GAs with different operators. GAs operators which are selected will be processed in an adaptive way that is expected to provide more minimal cost. Such as study [13] that the practice of study, adaptive GAs is very useful in reducing the cost
the company where they work, this study used simulated data that has been designed. The data has been designed and tailored to the problem so that the distribution data used in this study is the data capacity of the stock of each company, the capacity of the stock distributor at each stage, the number of vehicles, vehicle capacity, and costs that follow [12]. Distribution problem is solved using genetic algorithms (GAs). In GAs, there are several steps that must be done starting from chromosome representation, reproduction, and selection in accordance with the principle of imitating the biological properties of individual natural selection [16]. As a potential solution, a chromosome/individual should be measured his ability to complete solutions with regard to the fitness value. The greater fitness that produced the better the chromosomes are selected in solving a problem [17]. A. Mathematical Formulation The mathematical formulation is used to describe the objectives and constraints of multi-stage distribution problem. For i assumed as each stage numbering. Whereas every stage i has distributor unit number of J where every distributor unit j has vehicle v with total V used to deliver the product units. Each distributor unit has the capacity Cp to stock the product unit and any vehicle has a capacity of Vcp and fixes cost Co. Each distributor unit R that requests amounting Or serviced by distributor unit at the stage above and beyond also to know which the distributor stage that responds to the order indicated by the status of St. 1 on St value indicates that the distributor stage responds the order and vice versa for 0. In the distribution process, the objective function of the problems faced is to minimize the costs [18]. Because minimizing the cost to be the solution to the problem of multistage distribution. The cost function of multi-stage distribution is formulated in Equation (1). I
J
R
z Co ijr St i
(1)
i 0 j 0 r 0
Here Coijr is fixed cost for the delivery of distributor unit j to distributor unit r. Sti is the status of the distributor stage i in the service request. In this study, in addition to using equations to calculate the costs, there are also some equations which are used as constraint functions as a prerequisite to represent a chromosome. The constraint functions are used. B. The constraint on the limits of the total order This constraint relates to the limit of total orders from the customer of distributor unit so that the number of orders should be the same as the product units delivered by the sender of distributor unit. If the sender distributor unit has less stock to serve an order, the system automatically takes the shortage of product units on a stage above and beyond. The function of the limits of the total order is shown in Equation (2) and Orr is the total of order request to distributor r. I
J
R
X i 0 j 0 r 0
ijr
Orr
(2)
III. METHODOLOGY The problem in this study is a multi-stage distribution and only use one type of product. In the research process, based on a survey and interviews with experts in the distribution of
156
C. The constraint on the limits of the vehicle capacity Every vehicle from a distributor unit sender used to deliver the product units to the customer of distributor unit has a certain capacity limit. The number of delivered product units
e-ISSN: 2289-8131 Vol. 9 No. 2-7
An Adaptive Genetic Algorithm for Cost Optimization of Multi-Stage Supply Chain
may not exceed the capacity of the vehicle that has been determined. This is determined because it affects the quality of the delivered product units and vehicle durability to prevent rapid deterioration. The constraint function is shown in Equation (3). V
X v 0
irv
Vcp v
(3)
where Xirv is the total of product units delivered from the distributor stage i to distributor r using vehicle v. Vcpv is the capacity limit of vehicle v. D. The constraints on the stock available of distributor unit sender Last is the limits stock of distributor unit sender means each distributor unit sender always have inventory stock. When a distributor units delivered the product units then, the number of delivered product units may not exceed the stock available of distributor unit sender. The constraint of the limit stock function is shown in Equation (4). J
X j 0
ij
Cp j
(4)
where Xij is the total of product units unit sent by distributor unit sender j and has inventory stock with total Cpj. To solve the problems of multi-stage distribution, such constraints must be passed. Each candidate solutions that do not meet defined not eligible to be a candidate for a solution. E. Chromosome Representation The most important initial step in the process of GAs is to represent chromosomes. Because the chromosome is used to encode a solution in the genetic algorithms [19]. The encoding genetic algorithm used in this study is a real-coded. In Figure 1 shows a representation of the chromosome that is used in this study. Each chromosome is divided into several segments. The first segment represents a stage distributors and sub stage below consecutive represent the distributor sender, the sender's vehicle from each distributor and the distributor customer. Each gene located on a chromosome is a representation of the number of product units unit delivered by any vehicle. The length of chromosomes in this study determined from the number of distributors who do order in every stage multiplied by the total number of vehicles owned by each distributor that serves the ordered product units in each stage. In Figure 1 shows a representation of chromosomes for one stage or one segment. In Figure 1, stage/level i is stage distributors that serve the request, but because of the stage of distributor exemplified only one segment, then i only equal to 1. However, if the case is multi-stage, the value of i equal to the number of stages required. At each stage has some distributor unit sender that serve the request order and expressed by j. While v state the vehicle of distributor unit sender j and distributor unit customer denoted by r. On the first gene contains 45 which means it is at stage i, distributor unit sender j sent to distributor unit customer r using vehicle v and so on until the last gene in accordance with the structure of the image of the chromosome representation.
Figure 1: Chromosome representation in 1 segment
F. Fitness Function Each chromosome is represented to have a value called the fitness function. The value obtained from this fitness function which is used as a comparison between one chromosome to another [20]. Higher fitness value which gives the possibility of chromosomes is selected as the solution [21]. This is what makes the representation of chromosomes and the fitness function as the main key in the evaluation of GAs process [22]. Calculations used to obtain fitness values shown in Equation (5). Fitness
1 Z
(5)
where Z is the total cost from distribution process regarding Equation (1). After the calculation of fitness is done, it is necessary to collect chromosome/individual as many as the population size to the population pool. When the population size is 10 then the population pool must contain 10 individuals. G. Reproduction The next steps in the genetic algorithm after initialization population is the reproduction. There are two operators in the reproduction process including crossover and mutation. Additionally, the reproduction process has parameters that determine how large the number of children generated, namely crossover rate (cr) in the crossover process and mutation rate (mr) in the process of mutation. The number of children resulting from the reproduction process are collected in a separate pool called children's pool. The purpose in the reproductive process is the number of children produced diverse because through the process of exploration and exploitation of the parent who elected to produce children [23]. H. Crossover Crossover operator is a method of reproduction that involves two parents from population pool that selected randomly. The number of children from crossover process derived from multiplying population size and crossover rate so that if the population size is 10 and cr is 0.5 (generated randomly) then the total is 5 children. In this study, the model crossover used is one cut point crossover (OCP). It does a crossover on each segment or at the level of each individual. In Figure 2 is shown the crossover process using OCP. OCP crossover process is shown in Figure 2. In the left figure, there are some initials of the individual such as P1, P2, and C1. P1 which means Parent 1, P2 describe Parent 2, and C1 is the result of the first child of the crossover between P 1 and P2. In here, both of parents (P1 and P2) are randomly selected. Every individual has a chromosome that consists of several genes that are shown in the columns after each initial. C1 is the result of the crossover process and it can be seen that the genes possessed a cutting at point 3rd of the gene on the figure. The 1st and 2nd gene of the C1 is the same as the gene
e-ISSN: 2289-8131 Vol. 9 No. 2-7
157
Journal of Telecommunication, Electronic and Computer Engineering
from P1, the 3rd gene until the end of the same gene from gene P2. All children from crossover process incorporated into a pool of the children.
Figure 2: Crossover process using one cup point.
I. Mutation Mutation is another operator of the reproductive process. This method performs the reproduction process involving only one chromosome. There are several methods of mutations that exist in genetic algorithms. This research uses the method of swap mutations. Mutations of this model using two random of genes position in a chromosome then swap the positions of the value of these genes. J. Selection Besides, there is a method of reproduction used to produce a child, the genetic algorithm also has a selection process in which this selection process evaluates each chromosome parent and child to get a new population that contains new individual qualified. Before entering the selection process, GAs works by evaluating each chromosome using a fitness function. The value generated by the fitness function which is on each chromosome that is used as a benchmark in the selection process. There are various methods used. In this study, the selection method used is elitism which this method works by sorting in descending based on the fitness value so that only individuals with the greatest fitness will be selected. The GAs process is continued until the limits of the generation that have been determined [24].
Figure 3: Testing result of population size
The test results to determine the appropriate size of the population are shown in Figure 3. From the results obtained the population is able to provide the best solutions are the size of 100. B. Testing number of generation By testing the number of generation is expected to get the optimal solution. In general, genetic algorithms provide a better solution if the number of generation is greater. However, in some cases neither effect to get a better solution nor minimal computing time. In this study, testing the number of generation is done by a range between 100 to 1000. The population size used based on the best fitness value of previous tests, 100. The test result of the number of generation is shown in Figure 4. The test result to find the right the number of generation is shown in Figure 4. From the test results obtained 300 for the number of generations which give the best fitness value.
IV. EXPERIMENTAL RESULT A Genetic algorithm is an algorithm that works by using several parameters as input. Genetic algorithm parameters have an influence on the optimal solution given. Therefore, in this study conducted some tests to get the best parameters of the genetic algorithm also the model of crossover, mutation and selection that have been chosen so as to give the best solution. The best solution to the stochastic algorithms such as GAs is seen by the average fitness to test the stability of the solutions obtained A. Testing size of population The genetic algorithm is one kind of population-based algorithm [25] that really popular to solve some combinatorial problems [26]. To gain the optimal results approach, it is necessary to know the population size is best for every problem has a different size. The size of a large population is not necessarily providing a better solution otherwise small population size may not necessarily give a bad solution.
158
Figure 4: Testing result of generation number
C. Testing combination of crossover rate (cr) and mutation rate (mr) The testing combination of cr and mr also used to get a combination that can provide optimal solutions. In this test using the combination of cr and mr between 0.1 to 0.9 for each combination. Population size and the number of generations used by 100 for population size and 300 for generation number based on the best results of the previous test. Figure 5 shows the result of the testing combination of cr and mr. From the test results combined crossover rate and mutation rate shown in Figure 5 obtained that best fitness value when using a combination of 0.5 for crossover rate and 0.5 for mutation rate.
e-ISSN: 2289-8131 Vol. 9 No. 2-7
An Adaptive Genetic Algorithm for Cost Optimization of Multi-Stage Supply Chain Table 2 Comparison of Average Cost and Fitness of Overall Methods Methods Genetic Algorithms (New) Genetic Algorithms (Previous) Random Search
Figure 5: Testing result of crossover rate and mutation rate
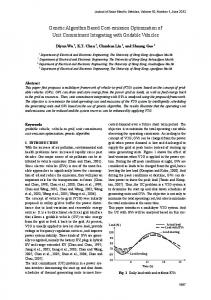
V. RESULT ANALYSIS After testing the parameters of GAs, based on the average cost and average fitness then obtained the best GAs parameters that are shown in Table 1. The parameters of GAs in Table 1 is able to provide near optimal solution to the problem of multi-stage distribution. Using the same data, the solution in this study compared to a solution on previous studies that is Random Search (RS) algorithm and genetic algorithms that are solved using an extended intermediate crossover, insertion mutation and elitism selection (GAs Previous). Experiments performed 10 times and the results are shown in Figure 6. Table 1 Result of The Best Gas Parameters Parameter GAs Population Size Number of Generation Crossover rate Mutation rate
Value 100 300 0.5 0.5
Average Fitness 5.01E-05 4.59E-05 2.93E-05
Average Cost 20167.8 21860.4 34328
According to Table 2, the average cost and fitness of GAs (new) in this study indicates the best and optimal value than GAs (previous). Thus, genetic operators of GAs (new) highly recommended. Then to reduce the cost, the elected operators are processed adaptively using the best population size 100 and generation number 300. Adaptive process is executed 10 times to get the average fitness. Table 3 is the average fitness of traditional GAs (new) compared to adaptive GAs (new). Referring to Table 3, the adaptive genetic algorithm (new) proven to reduce cost compared to traditional genetic algorithms (new). It can declare that adaptive GAs (new) provides an effective solution for multi-stage supply chain problems. Table 3 Comparison of Average Cost and Fitness of Traditional and Adaptive GAs Methods Genetic Algorithms (new) Adaptive Genetic Algorithms (new)
Average Fitness 5.01E-05 5.10E-05
Average Cost 20167.8 19908.5
Referring to Table 3, the adaptive genetic algorithm (new) proven to reduce cost compared to traditional genetic algorithms (new). It can declare that adaptive GAs (new) provides an effective solution for multi-stage supply chain problems. VI. CONCLUSION
Based on the line chart in Figure 6 can be seen that the RS gives results that are not optimal but provide the most stable outcome. Line chart GAs (previous) also provide a more stable solution than GA (new). However, if viewed from the obtained solution, GAs (new) provides superior results from all methods at 8 times execution. But on the 7 and 10 execution, a solution using GAs (previous) showed better results. Experiments performed 10 times considering GAs is one of the stochastic algorithms that give different results when executed. [19]. Because of the stochastic nature of GAs [27], the results that can be used as a benchmark is the average value. The average fitness and distribution costs of the overall method are shown in Table 2.
Multi-stage distribution problems can be solved using genetic algorithms with the proposed operator models that are extended intermediate crossover, the insertion mutation, and elitism selection. To produce a near optimal solution, GAs parameter testing performed and resulted in the best parameters GAs including the population size of 100, the number of generations 300, and a suitable combination of cr 0.5 and mr 0.5. Using those parameters, GAs (new) still less stable give the solution compared to GAs previous based on the line chart. However GAs (new) provides superior results from all methods when viewed from the average cost and fitness obtained. For stochastic algorithm such as GAs, the average fitness becomes a reference to determine the solution. This describes that the multi-stage distribution problems highly recommended solved using genetic algorithms (new) in combination with the one-cut-point (OCP) crossover operator, swap mutation, and elitism selection. Traditional GAs (new) compared to adaptive GAs (new). In this study, the genetic operators used of both GAs are same such as using OCP as the crossover, swap as the mutation, and elitism as the selection. The result indicates that adaptive GAs (new) provide more efficient solution compared to the classical GAs on multi-stage supply chain problems.
Figure 6: Comparison fitness of overall methods
e-ISSN: 2289-8131 Vol. 9 No. 2-7
159
Journal of Telecommunication, Electronic and Computer Engineering
REFERENCES [1]
[2]
[3]
[4]
[5]
[6]
[7]
[8]
[9]
[10]
[11] [12]
[13]
160
M. A. M. Ali and Y. H. Sik, “Transportation problem: A special case for linear programing problems in mining engineering,” Int. J. Min. Sci. Technol., vol. 22, no. 3, pp. 371–377, 2012. K. A. A. D. Raj and C. Rajendran, “A genetic algorithm for solving the fixed-charge transportation model: Two-stage problem,” Comput. Oper. Res., vol. 39, no. 9, pp. 2016–2032, 2012. F. Ghassemi Tari and Z. Hashemi, “A priority based genetic algorithm for nonlinear transportation costs problems,” Comput. Ind. Eng., vol. 96, pp. 86–95, 2016. R. R. P. Langroodi and M. Amiri, “A system dynamics modeling approach for a multi-level, multi-product, multi-region supply chain under demand uncertainty,” Expert Syst. Appl., vol. 51, pp. 231–244, 2016. R. Masson, N. Lahrichi, and L. M. Rousseau, “A two-stage solution method for the annual dairy transportation problem,” Eur. J. Oper. Res., vol. 251, no. 1, pp. 36–43, 2016. Z. Indra and Subanar, “Optimasi Biaya Distribusi Rantai Pasok Tiga Tingkat dengan Menggunakan Algoritma Genetika Adaptif dan Terdistribusi (Optimization of Supply Chain Distribution Costs Three Levels Using Adaptive Genetic Algorithm and Distributed),” IJCCS, vol. 8, no. 2, pp. 189–200, 2014. L. Bertazzi, A. Bosco, and D. Laganà, “Min–Max exact and heuristic policies for a two-echelon supply chain with inventory and transportation procurement decisions,” Transp. Res. Part E Logist. Transp. Rev., vol. 93, pp. 57–70, 2016. A. A. Hlayel and M. A. Alia, “Solving Transportation Problems Using the Best Candidates Method,” Comput. Sci. Eng. An Int. J., vol. 2, no. 5, pp. 23–30, 2012. P. Sitek and J. Wikarek, “Mathematical programming model of cost optimization for supply chain from perspective of logistics provider,” Manag. Prod. Eng. Rev., vol. 3, no. 2, pp. 49–61, 2012. Z.-H. Che, T.-A. Chiang, and Y.-C. Kuo, “Multi-Echelon Reverse Supply Chain Network Design With Specified Returns Using Particle Swarm Optimization,” Int. J. Innov. Comput. Inf. Control, vol. 8, no. 10(A), pp. 6719–6731, 2012. A. Király, T. Varga, and J. Abonyi, “Constrained Particle Swarm Optimization of Supply Chains,” vol. 6, no. 7, pp. 1113–1121, 2012. A. Rahmi, M. Z. Sarwani, and W. F. Mahmudy, “Genetic Algorithms for Optimization of Multi-Level Product Distribution,” Accept. to Int. J. Intell. Eng. Syst., 2016. W. Neungmatcha, K. Sethanan, M. Gen, and S. Theerakulpisut, “Adaptive genetic algorithm for solving sugarcane loading stations with multi-facility services problem,” Comput. Electron. Agric., vol. 98, pp. 85–99, 2013.
[14] A. H. Karami and M. Hasanzadeh, “An adaptive genetic algorithm for robot motion planning in 2D complex environments,” Comput. Electr. Eng., vol. 43, pp. 317–329, 2015. [15] İ. Küçükoğlu and N. Öztürk, “Simulated Annealing Approach for Transportation Problem of Cross-docking Network Design,” Procedia - Soc. Behav. Sci., vol. 109, no. 2012, pp. 1180–1184, 2014. [16] Z. Qiongbing, “A New Crossover Mechanism for Genetic Algorithms with Variable-length Chromosomes for Path Optimization Problems,” Expert Syst. Appl., 2016. [17] M. Thakur and A. Kumar, “Electrical Power and Energy Systems Optimal coordination of directional over current relays using a modified real coded genetic algorithm : A comparative study,” Int. J. Electr. POWER ENERGY Syst., vol. 82, pp. 484–495, 2016. [18] H. Guo, X. Wang, and S. Zhou, “A Transportation Problem with Uncertain Costs and Random Supplies,” Int. J. e-Navigation Marit. Econ., vol. 2, pp. 1–11, 2015. [19] W. F. Mahmudy, R. M. Marian, and L. H. S. Luong, “Hybrid Genetic Algorithms for Multi-Period Part Type Selection and Machine Loading Problems in Flexible Manufacturing System,” in IEEE International Conference on Computational Intelligence and Cybernetics, 2013, vol. 8, no. 1, pp. 126–130. [20] I. Azim and F. Rahman, “Genetic Algorithm Based Reactive Power Management by SVC,” Int. J. Electr. Comput. Eng., vol. 4, no. 2, 2014. [21] S. Sivasankar, S. Nair, and M. V. Judy, “Feature Reduction in Clinical Data Classification using Augmented Genetic Algorithm,” Int. J. Electr. Comput. Eng., vol. 5, no. 6, pp. 1516–1524, 2015. [22] Z.-Q. Chen and R.-L. Wang, “Solving the m-way graph partitioning problem using a genetic algorithm,” IEEJ Trans. Electr. Electron. Eng., vol. 6, no. 5, pp. 483–489, 2011. [23] R. Jiao, Z. Yang, R. Shi, and B. Lin, “A Multistage Multiobjective Substation Siting and Sizing Model Based on Operator-Repair Genetic Algorithm,” IEEJ Trans. Electr. Electron. Eng., vol. 9, pp. S28--S36, 2014. [24] W. F. Mahmudy, R. M. Marian, and L. H. S. Luong, “Real Coded Genetic Algorithms for Solving Flexible Job-Shop Scheduling Problem - Part I: Modelling,” Adv. Mater. Res., vol. 701, pp. 359–363, 2013. [25] Z. Li, J. Gu, H. Zhuang, L. Kang, X. Zhao, and Q. Guo, “Adaptive molecular docking method based on information entropy genetic algorithm,” Appl. Soft Comput., vol. 26, pp. 299–302, 2015. [26] J. Magalhães-Mendes, “A comparative study of crossover operators for genetic algorithms to solve the job shop scheduling problem,” WSEAS Trans. Comput., vol. 12, no. 4, pp. 164–173, 2013. [27] Y. C. Wong, N. M. Mahmod, M. M. Ibrahim, A. R. Syafeeza, and N. A. Hamid, “Adaptive Impedance Tuning Network using Genetic Algorithm : ITuneGA,” J. Telecommun. Electron. Comput. Eng., vol. 8, no. 5, pp. 55–60, 2016.
e-ISSN: 2289-8131 Vol. 9 No. 2-7