which makes it also reminiscent of stratified sampling. The algorithm was imple- ... This paper presents an adaptive importance sampling algorithm for numerical.
An Adaptive Importance Sampling Technique Teemu Pennanen and Matti Koivu Department of Management Science, Helsinki School of Economics, PL 1210, 00101 Helsinki, Finland [pennanen,koivu]@hkkk.fi
Summary. This paper proposes a new adaptive importance sampling (AIS) technique for approximate evaluation of multidimensional integrals. Whereas known AIS algorithms try to find a sampling density that is approximately proportional to the integrand, our algorithm aims directly at the minimization of the variance of the sample average estimate. Our algorithm uses piecewise constant sampling densities, which makes it also reminiscent of stratified sampling. The algorithm was implemented in C-programming language and compared with VEGAS and MISER.
1 Introduction This paper presents an adaptive importance sampling algorithm for numerical approximation of integrals (expectations wrt the uniform distribution U on (0, 1)d ) of the form � EU ϕ =
ϕ(ω)dω .
(1)
(0,1)d
Restricting attention to the uniform distribution on the unit cube is not as restrictive as one might think. Indeed, integrals of the more general form � ϕ(ξ)π(ξ)dξ , (a,b)
where π is a positive density function and (a, b) = (a1 , b1 ) × · · · × (ad , bd ), with possibly ai = −∞ or bi = +∞, can be written in the form (1) with a change of variables; see Hlawka and M¨ uck [6]. Instead of direct sampling from the uniform distribution U , we will follow the importance sampling strategy. If p is a density function on (0, 1)d , then EU ϕ = EU �
ϕ(ω) ϕ(ω) p(ω) = E P , p(ω) p(ω)
The work of this author was supported by Finnish Academy under contract no. 3385
444
T. Pennanen and M. Koivu
where P (A) := E U p(ω)χA (ω) for every measurable set A. If {ωi }N i=1 is a random sample from P , the expectation and variance of the sample average AN (ϕ, p) = are E U ϕ and
1 NV
N 1 ( ϕ(ωi ) N i=1 p(ωi )
(ϕ, p), respectively, where �
V (ϕ, p) = E
P
ϕ(ω) p(ω)
�2
�
ϕ(ω) − E p(ω)
�2
P
= EU
ϕ(ω)2 − (E U ϕ)2 . p(ω)
If p ≡ 1, V (ϕ, p) is just the variance V (ϕ) of ϕ wrt the uniform distribution. The general idea in importance sampling is to choose p so that 1. V (ϕ, p) < V (ϕ), 2. P is easy to sample from, 3. p(ω) is easy to evaluate. The extreme cases are p ≡ 1, which satisfies 2 and 3 but not 1, and p = |ϕ|/E U |ϕ|, which satisfies 1 but not 2 and 3. Coming up with a good importance sampling technique is to find a good balance between the two. Adaptive importance sampling (AIS) algorithms update the sampling density as more information about the integrand is accumulated. In many AIS algorithms proposed in the literature, the sampling density is a “mixture density”, i.e. K ( αk q k , (2) p= k=1 k
where q are density functions and αk are positive constants that add up to one. For appropriate choices of q k , such a p is easy to sample from and easy to evaluate so that criteria 2 and 3 are met. Indeed, to sample from (2), one chooses an index k with probability αk , and then samples from q k . In the VEGAS algorithm of Lepage [7] (see also [9]), the component densities q k are uniform densities over rectangles. In VEGAS, p is also required to be of the product form p(ω) = p1 (ω1 ) · · · pd (ωd ), which facilitates sampling, but restricts the ability to adapt to integrands that are not of the product form. A more flexible approach is to use so called kernel densities, where q k (the kernels) are identical up to a shift; see Zhang [12] and the references therein. In [8], Owen and Zhou proposed an AIS strategy where q k are products of univariate β-distributions. In the AIS algorithm presented in this paper, the sampling densities are piecewise constant functions of the form p=
K ( k=1
p k χΩ k ,
(3)
An Adaptive Importance Sampling Technique
445
where the sets Ω k form a partitioning of (0, 1)d into rectangular regions. If ϕ is Riemann integrable, V (ϕ, p) can be made arbitrarily close to zero by choosing the partitioning and the weights pk appropriately; see Sect. 2. The piecewise constant density obviously meets criterion 3, and since it can be written in the form (2), it satisfies criterion 2 as well. A crucial question in an AIS algorithm is how to update p. In many existing algorithms, V (ϕ, p) is reduced indirectly by trying to update p so that it follows ϕ as closely as possible according to a given criterion. The algorithm of [8] minimizes a sample approximation of the mean squared deviation of p from ϕ. Kernel density based methods rely on asymptotic properties of kernel density approximations. The algorithm proposed in this paper, aims directly at minimizing V (ϕ, p). Our algorithm was implemented in C-programming language and compared with VEGAS and MISER implementations from [9]. Comparisons were made on five different integrands over the unit cube with dimensions ranging from 5 to 9. In the tests, our algorithm outperformed MISER in accuracy on every test problem. Compared to VEGAS our algorithm was more accurate on only two problems, but exhibited more robust overall performance. The rest of this paper is organized as follows. The general idea of the algorithm is presented in Sect. 2. Section 3 outlines the implementation of the algorithm and Sect. 5 presents numerical experiments.
2 Adapting p to ϕ When using piecewise constant sampling densities of the form (3), the variance of the sample average can be written as ϕ(ω)2 − (E U ϕ)2 p(ω) K � K ( ( ϕ(ω)2 dω U (Ω k )mk2 U 2 Ωk = − (E ϕ) = − (E U ϕ)2 . k p pk
V (ϕ, p) = E U
k=1
k=1
Here, and in what follows, mkj
1 := U (Ω k )
� ϕ(ω)j dω
j = 1, 2, . . .
Ωk
denotes the jth moment of ϕ over Ω k . For a fixed number K of elements in the partition, the optimal, in the sense of criterion 1, piecewise constant sampling density is the one whose weights pk and parts Ω k solve the following minimization problem
446
T. Pennanen and M. Koivu
minimize Ω k ,pk
subject to
K ( U (Ω k )mk 2
pk
k=1 {Ω k }K k=1 K (
k
− (E U ϕ)2
is a partition of (0, 1)d ,
(4)
k
p U (Ω ) = 1 ,
k=1 k
p ≥ 0,
k = 1, . . . , K.
This is a hard problem in general since optimizing over partitions (even just over rectangular ones) leads to nonconvexities and multiple local minima. The AIS procedure developed in this paper is based on the observation that problem (4) has the same characteristics as the problem of adaptive finite element (FEM) approximation of partial differential equations; see e.g. [1, Section 6]. There also, the aim is to find a finite partition (usually into tetrahedrons) of the domain along with optimal weights for associated kernel functions. In adaptive FEM and in our importance sampling procedure, the optimization is done by iterating three steps: 1. adjust the partition based on the information collected over the previous iterations; 2. compute (numerically) certain integrals over the elements of the new partition; 3. optimize over the weights. In our integration procedure, step 2 consists of numerically computing the first two moments of ϕ over each Ω k . In both adaptive FEM and our integration procedure, step 3 is a simple convex optimization problem. In FEM, it is a quadratic minimization problem which can be solved by standard routines of numerical linear algebra. In our procedure, the optimal weights can be solved analytically; see Subsect. 2.1. In both methods, step 1 is the most delicate one. Our heuristic for updating the partitions is described in Subsect. 2.2. 2.1 Optimizing the Weights If the partition P = {Ω k }K k=1 is fixed, problem (4) becomes a convex optimization problem over the weights, and it can be solved analytically by the technique of Lagrange multipliers. A necessary and sufficient condition for optimality is ∂p L(p, λ) = 0 , ∂λ L(p, λ) = 0 , where the Lagrangian L is given by
An Adaptive Importance Sampling Technique
L(p, λ) =
K ( U (Ω k )mk 2
pk
k=1
=
K (
� U (Ω k )
k=1
� − (E U ϕ)2 + λ
mk2 + λpk pk
K (
447
� pk U (Ω k ) − 1
k=1
�
− (E U ϕ)2 − λ;
see Rockafellar [11]. The optimality conditions become − K (
mk2 + λ = 0 k = 1, . . . , K , (pk )2
pk U (Ω k ) − 1 = 0 ,
k=1
which can be solved for the optimal weights 1
(mk2 ) 2
pko = 1K
1
k=1
U (Ω k )(mk2 ) 2
.
The optimal sampling density is thus po =
K (
pko χΩ k
(5)
k=1
and the corresponding variance (the minimum over p in (4)) is "
K (
&2 U (Ω
k
1 )(mk2 ) 2
− (E U ϕ)2 .
(6)
k=1
2.2 Optimizing the Partition Our algorithm works recursively, much like MISER, by maintaining a partitioning of (0, 1)d into rectangular subregions [ak , bk ] and splitting its elements in half along one of the co-ordinate axes. However, since the computing time of our sampling technique increases with the number of parts in the partition, we will make splits more sparingly. 1 Each region Ω k contributes to the variance through the term U (Ω k )(mk2 ) 2 in the brackets in (6). Partitioning Ω k into {Ω l }, this term gets replaced by ( 1 U (Ω l )(ml2 ) 2 . l
Making {Ω l } fine enough, we can reduce this term arbitrarily close to � the Riemann-integral Ω k ϕ(ω)dω. Thus, the optimal reduction of the term 1 U (Ω k )(mk2 ) 2 by partitioning the region Ω k is
448
T. Pennanen and M. Koivu 1
U (Ω k )[(mk2 ) 2 − mk1 ] .
(7)
Our recursive partitioning strategy proceeds by splitting in half regions Ω k for which (an approximation of) (7) is greatest. After we have chosen a region for splitting, we need to choose along which of the d axis to split it. The simplest idea would be to choose the axis j for which the number 1 1 (8) U (Ω l )(ml2 ) 2 + U (Ω r )(mr2 ) 2 , where Ω l and Ω r are the regions obtained by splitting Ω k in half along the jth axis, is smallest. The motivation would be that (8) is the number by which 1 the contribution U (Ω k )(mk2 ) 2 of Ω k would be replaced in (6). However, if ϕ 1 is symmetric about the dividing line along axis j, (8) is equal to U (Ω k )(mk2 ) 2 and there is no reduction of variance, even though further splitting along the jth axis might result in a significant reduction of variance. We can effectively avoid this kind of short-sightedness by choosing instead the axis for which the number L ( 1 U (Ω l )(ml2 ) 2 , (9) l=1 l
where Ω are the regions obtained by partitioning Ω k along axis j into L > 2 equal-size subregions, is smallest. In the test problems of Sect. 5, our algorithm was rather insensitive to the value of L as long as it was greater than 2.
3 The AIS Algorithm The above sketch of AIS requires knowledge of mk1 and mk2 in each region Ω k generated in the course of the algorithm. These will be approximated by sample averages. The algorithm works iteratively, much like VEGAS, by sampling N points from the current sampling density pit and using the new sample in updating the partitioning and the density. The idea is that, as the algorithm proceeds, the density should concentrate in the important areas of the domain, so that when sampling from the latest density, a greater fraction of sample points will be available for approximating the moments in these areas. In early iterations, when the moment approximations are not very accurate, the algorithm refines the partitioning less eagerly, but as the sampling density is believed to converge toward the optimal one, more parts are generated. In each iteration, the algorithm uses the latest sample to compute the integral estimate AN (ϕ, pit ) and an estimate of its variance " & N 1 ( ϕ(ωi )2 1 it it 2 VN (ϕ, p ) = − AN (ϕ, p ) . N − 1 N i=1 pit (ωi )2 It also computes a weighted average of the estimates obtained over the previous iterations using the weighting strategy of Owen and Zhou [8]. The latest
An Adaptive Importance Sampling Technique
449
sample is then used to update the moment approximations in each region. The algorithm splits regions for which an estimate of the expression (7) is greater than certain constant εit . A new sampling density based on the new partitioning is formed and εit is updated. We set it+1 equal to a certain percentage of the quantity 1 ˜ k2 ) 2 − m ˜ k1 ] , min U (Ω k )[(m k=1,...,K
m ˜ k1
m ˜ k2
where and are sample average approximations of mk1 and mk2 , respectively. The sampling density for iteration it will be pit pit = (1 − α)˜ o +α ,
(10)
where p˜it o is an approximation of p0 for the current partition and α ∈ (0, 1). k The approximation p˜it o will be obtained by approximating each po in (5) by 1
1K k=1
(m ˜ k2 ) 2 1
U (Ω k )(m ˜ k2 ) 2
.
The reason for using α > 0 is that, due to approximation errors, the sampling density p˜it o might actually increase the variance of the integral estimate. Bounding the sampling density away from zero, protects against such effects; see [5]. Our AIS-algorithm proceeds by iterating the following steps. 1. sample N points from the current density pit ; 2. compute AN (ϕ, pit ) and VN (ϕ, pit ); ˜ k2 of mk1 and mk2 and refine the parti3. compute approximations m ˜ k1 and m tioning; 4. set K ( p˜ko χΩ k + α , pit+1 = (1 − α) k=1
where
1
p˜ko = 1K k=1
(m ˜ k2 ) 2 1
U (Ω k )(m ˜ k2 ) 2
.
The algorithm maintains a binary tree whose nodes correspond to parts in a partitioning that has been generated in the course of the algorithm by splitting larger parts in half. In the first iteration, the tree consists only of the original domain (0, 1)d . In each iteration, “leaf nodes” of the tree correspond to the regions in the current partitioning. When a new sample is generated, the sample points are propagated from the “root” of the tree toward the leafs where the quotients ϕ(ωi )/p(ωi ) are computed. The sum of the quotients in each region is then returned back toward the root. In computing estimates of mk1 and mk2 in each iteration, our algorithm uses all the sample points generated so far. The old sample points are stored in
450
T. Pennanen and M. Koivu
the leaf nodes of the tree. When a new sample is generated and the quotients ϕ(ωi )/p(ωi ) have been computed in a region, the new sample points are stored in the corresponding node. New estimates of mk1 and mk2 are then computed and the partitioning is refined by splitting regions where an estimate of the expression (7) is greater than εit . When a region is split, the old sample points are propagated into the new regions.
4 Relations to Existing Algorithms A piecewise constant sampling density makes importance sampling reminiscent of the stratified sampling technique. Let I k be the set of indices of the points falling in Ω k . When sampling N points from p, the cardinality of I k has expectation E|I k | = U (Ω k )pk N and the sample average can be written as AN (ϕ, p) =
K K 1 ( ( ϕ(ωi ) ( 1 ( = U (Ω k ) ϕ(ωi ) . k N p E|I k | k k k=1 i∈I
k=1
i∈I
If, instead of being random, |I k | was equal to E|I k |, this would be the familiar stratified sampling estimate of the integral. See Press and Farrar [10], Fink [3], Dahl [2] for adaptive integration algorithms based on stratified sampling. In many importance sampling approaches proposed in the literature, the sampling density is constructed so that it follows the integrand as closely as possible, in one sense or the other. For example, minimizing the mean squared deviation (as in [8] in case of beta-densities and in [3] in case of piecewise constant densities) would lead to mk1
p k = 1K k=1
U (Ω k )mk1
instead of pko above. Writing the second moment as mk2 = (σ k )2 + (mk1 )2 , where σ k is the standard deviation, shows that, as compared to this sampling density, the variance-optimal density po puts more weight in regions where the variance is large. This is close to the idea of stratified sampling, where the optimal allocation of sampling points puts U (Ω k )σ k N 1K k k k=1 U (Ω )σ points in Ω k . On the other hand, sampling from po puts, on the average, 1
U (Ω
k
)pko N
U (Ω k )(mk2 ) 2
= 1K
k=1
1
U (Ω k )(mk2 ) 2
N.
An Adaptive Importance Sampling Technique
451
points in Ω k . Looking again at the expression mk2 = (σ k )2 +(mk1 )2 , shows that, as compared to stratified sampling, our sampling density puts more weight in regions where the integrand has large values. Our sampling density can thus be viewed as a natural combination of traditional importance sampling and stratified sampling strategies.
5 Numerical Experiments In the numerical test, we compare AIS with two widely used adaptive integration algorithms VEGAS and MISER; see e.g. [9]. We consider five different test integrands. The first three functions are from the test function library proposed by [4], the double Gaussian function is taken from [7], and as the last test integrand we use an indicator function of the unit simplex; see Table 1. In the first three functions, there is a parameter a that determines the variability of the integrand. For test functions 1–4, we chose d = 9 and we estimate the integrals using 2 million sample points. For test function 5, we used 1 million points with d = 5. Table 1. Test functions Integrand ϕ(x) √ cos(ax), a = 110/ d3 2d 1 a = 600/d2 i=1 a−2 +(xi −0.5)2 , , � a = 600/d2 (1 + ax)−(d+1) � d � �� � �−d � �2 � d � 1 1 xi −2/3 �2 xi −1/3 1 10 √ exp − + exp − 2 0.1 0.1 π i=1 i=1
1d u ≤ 1, d! i=1 i 0 otherwise
Attribute name Oscillatory Product Peak Corner Peak Double Gaussian Indicator
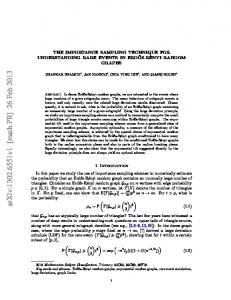
In all test cases, AIS used 50 iterations with 40000 and 20000 points per iteration for test functions 1–4 and 5, respectively. The value of the parameter α in (10) was set to 0.01. For all the algorithms and test functions we estimated the integrals 20 times. The results in Table 2 give the mean absolute error (MAD) and the average of the error estimates provided by the algorithms (STD) over the 20 trials. AIS produces the smallest mean absolute errors with Double Gaussian and Product Peak test functions and never loses to MISER in accuracy. VEGAS is the most accurate algorithm in Oscillatory, Corner Peak and Indicator functions, but fails in the Double Gaussian test. This is a difficult function for VEGAS, because the density it produces is a product of 9 univariate bimodal densities having 29 = 512 modes; see Fig. 1 for a two dimensional illustration
452
T. Pennanen and M. Koivu Table 2. Results of the numerical tests
Function Oscillatory Product Peak Corner Peak Double Gaussian Indicator
d 9 9 9 9 5
AIS MAD STD 0.009171 0.012717 0.006411 0.016944 0.000735 0.000981 0.011022 0.019228 0.005601 0.003391
VEGAS MAD STD 0.002244 0.002877 0.014699 0.002791 0.000115 0.000161 0.500516 0.006204 0.001066 0.001039
MISER MAD STD 0.014355 0.020256 0.022058 0.031235 0.001786 0.002209 0.021274 0.018452 0.017896 0.021690
MC MAD STD 0.021432 0.023249 0.017091 0.018515 0.006692 0.009311 0.219927 0.220510 0.011208 0.010907
1 0.8 0.6 0.4 0.2 0 0
0.2
0.4
0.6
0.8
1
Fig. 1. Sample produced by VEGAS for double Gaussian.
with 22 = 4 modes. The error estimates (STD) given by AIS and MISER are consistent with the actual accuracy obtained but VEGAS underestimates the error in the case of Product Peak and Double Gaussian. The partition rule used by MISER does not work well with the Indicator function. In choosing the dimension to bisect, MISER approximates the variances with the square of the difference of maximum and minimum sampled values in each subregion. This causes MISER to create unnecessary partitions, which do not reduce the variance of the integral estimate. Figure 2 displays the partition and sample of a 2 dimensional Indicator function created by MISER. The sample generated by MISER resembles a plain MC sample. For comparison and illustration of the behavior of our algorithm, the partitions and the corresponding samples generated after 20 integrations of AIS are displayed in Figs. 3 and 4. Average computation times used by the algorithms are given in Table 3 for all test functions. Maintenance of the data structures used by AIS causes the algorithm to be somewhat slower compared to VEGAS and MISER but the difference reduces when the integrand evaluations are more time consuming. In summary, our algorithm provides an accurate and robust alternative to VEGAS and MISER with somewhat increased execution time. For integrands that are slower to evaluate the execution times become comparable.
An Adaptive Importance Sampling Technique 1
1
0.8
0.8
0.6
0.6
0.4
0.4
0.2
0.2
0
0
0.2
0.4
0.6
0.8
1
0
0
0.2
(a) Partition
0.4
0.6
0.8
453
1
(b) Sample
Fig. 2. Partition and sample produced by MISER for the 2 dimensional Indicator function. 1
1
1
0.8
0.8
0.8
0.6
0.6
0.6
0.4
0.4
0.4
0.2
0.2
0.2
0 0
0.2 0.4 0.6 0.8
1
(a) Corner peak
0 0
0.2 0.4 0.6 0.8
(b) Double Gaussian
1
1
0.8
0.8
0.6
0.6
0.4
0.4
0.2
0.2
0 0
0.2 0.4 0.6 0.8
(d) Oscillatory
1
0 0
1
0 0
0.2 0.4 0.6 0.8
1
(c) Indicator
0.2 0.4 0.6 0.8
1
(e) Product Peak
Fig. 3. Two dimensional partitions produced by AIS.
Acknowledgments We would like to thank Vesa Poikonen for his help in implementing the algorithm. We would also like to thank an anonymous referee for several suggestions that helped to clarify the paper.
454
T. Pennanen and M. Koivu 1
1
1
0.8
0.8
0.8
0.6
0.6
0.6
0.4
0.4
0.4
0.2
0.2
0.2
0
0
0.2 0.4 0.6 0.8
(a) Corner peak
1
0 0
0.2 0.4 0.6 0.8
0 0
0.2 0.4 0.6 0.8
(b) Double Gaussian
1
1
0.8
0.8
0.6
0.6
0.4
0.4
0.2
0.2
0 0
1
0.2 0.4 0.6 0.8
(d) Oscillatory
1
0 0
1
(c) Indicator
0.2 0.4 0.6 0.8
1
(e) Product Peak
Fig. 4. Two dimensional samples produced by AIS. Table 3. Computation times in seconds Function Oscillatory Product Peak Corner Peak Double Gaussian Indicator
AIS
VEGAS
MISER
MC
24.30 56.34 38.21 30.13 6.06
4.19 9.57 3.78 11.29 0.97
2.45 8.54 2.07 10.81 0.45
1.78 7.81 1.35 10.46 0.30
References 1. I. Babuˇska and W. C. Rheinboldt. Error estimates for adaptive finite element computations. SIAM J. Numer. Anal., 15(4):736–754, 1978. 2. Lars O. Dahl. An adaptive method for evaluating multidimensional contingent claims: Part I. International Journal of Theoretical and Applied Finance, 6:301– 316, 2003. 3. Daniel Fink. Automatic importance sampling for low dimensional integration. Working paper, Cornell University, 2001. 4. A. C. Genz. Testing multidimensional integration routines. Tools, Methods and Languages for Scientific and Engineering Computation, pp. 81–94, 1984.
An Adaptive Importance Sampling Technique
455
5. Tim C. Hesterberg. Weighted average importance sampling and defensive mixture distributions. Technometrics, 37(2):185–194, 1995. ¨ 6. E. Hlawka and R. M¨ uck. Uber eine Transformation von gleichverteilten Folgen. II. Computing (Arch. Elektron. Rechnen), 9:127–138, 1972. 7. G. P. Lepage. A new algorithm for adaptive multidimensional integration. Journal of Computational Physics, 27:192–203, 1978. 8. A. B. Owen and Y. Zhou. Adaptive importance sampling by mixtures of products of beta distributions, 1999. URL http://wwwstat.stanford.edu/∼owen/reports/. 9. W. H. Press, S. A. Teukolsky, W. T. Vetterling, and B. P. Flannery. Numerical recipes in C, The art of scientific computing. Cambridge University Press, Cambridge, 2nd edition, 1992. 10. W. H. Press and G. R. Farrar. Recursive stratifield sampling for multidimensional monte carlo integration. Computers in Physics, 27:190–195, 1990. 11. R. T. Rockafellar. Convex analysis. Princeton Mathematical Series, No. 28. Princeton University Press, Princeton, N.J., 1970. 12. Ping Zhang. Nonparametric importance sampling. J. Amer. Statist. Assoc., 91(435):1245–1253, 1996.