G. C. Van Kooten, Richard A. Schoney, and Keith A. Hayward are, respectively, an .... Harper and Eastman also used paired com- parisons to measure the goals ...
An Alternative Approach to the Evaluation of Goal Hierarchies among Farmers G. C. Van Kooten, Richard A. Schoney, and Keith A. Hayward Results of a study of goal orderings of Saskatchewan farmers who participate in the province's FARMLAB Program are presented. We use the method of fuzzy pair-wise comparisons which allows the respondent to indicate a degree of preference between two alternative goal statements, thereby providing more information than in the binary case. From survey data ratio-scale scores are constructed for eight goal statements, and these are regressed on a set of farm enterprise and household characteristics and a psychological locus-of-control (or I-E) score. The empirical results indicate that goodness-of-fit measures are better than those obtained by other researchers, perhaps because a psychological measure (I-E score) is included as an explanatory variable for goal orderings. Key words: goal orderings, locus-of-control score, pair-wise comparisons.
Although single-objective decision models, such as profit maximization and the expected utility model, have been successfully employed to predict behavior at a macro, or industry, level, they have proved less satisfactory at the micro level as a predictor of an individual decision maker's behavior (Patrick and Eisgruber; Lichtenstein and Slovic). Baumol, for example, argues that "we can no longer operate comfortably on the assumption that profit maximization adequately explains all of the observed business behavior" (p. 308). The expected utility hypothesis, on the other hand, cannot be considered valid on the basis of positive criteria; indeed, in computationally complex situations, the expected utility hypothesis predicts behavior no better than mere chance (Schoemaker, p. 127). Simon suggests that decision makers strive to attain satisfactory levels of each objective G. C. Van Kooten, Richard A. Schoney, and Keith A. Hayward are, respectively, an associate professor, research economist, and lecturer, Department of Agricultural Economics, University ofSaskatchewan, Canada. The authors wish to thank William H. James, Richard S. Johnston, an anonymous reviewer, and members of the Economics Workshop at the University of Saskatchewan for helpful comments and suggestions.
instead of optimizing over a single objective. He terms this behavior satisficing. Satisficing behavior occurs, in part, because managers have limited information-processing capabilities.' Farmers are also hypothesized to be satisficers rather than profit or expected utility maximizers. There is also substantial evidence that decision makers consider multiple objectives when they make choices. "Clearly farmers do consider multiple goals in decision-making and individual, farm and family goals are considered" (Patrick and Kliebenstein, p. 22). Thus, in agriculture, the study of producers' goals has become an important area of investigation. The measurement of farmers' goals can serve a number of useful purposes. First, understanding farmers' objectives can be useful for predicting economic behavior. Second, multiple goals can be incorporated into farm simulation models to assist producers in making decisions. For example, Hardaker and Anderson argue that farmers' goals should be taken into account in designing a farm record system. 'See Cyert and March, Baumol, and Ferguson for additional discussion pertaining to satisficing behavior and multiple objective decision functions.
Western Journal of Agricultural Economics, 11(1): 40-49 Copyright 1986 Western Agricultural Economics Association
Evaluating Farmer Goals
Van Kooten, Schoney, and Hayward
Patrick (1981) provides an example of the use of farmers' goal orientations in a simulation of farm growth and survival, and a major purpose for the research undertaken in the present study is for use in the PC TOP MANAGEMENT simulation model (Schoney). Finally, a knowledge of farmers' goals and objectives is desirable for the formulation of agricultural policy and in extension programs. In this paper, our purpose is to (a) introduce a new method for measuring farmers' goals that is based on fuzzy set theory (Kaufmann and Gupta); (b) employ locus of control, a psychological measure, as a possible explanatory variable in goal analysis; and (c) apply the procedures developed in this paper to a sample of Saskatchewan farmers who participate in the province's FARMLAB TOP MANAGEMENT workshops. We proceed in the next section by briefly reviewing the techniques for measuring farmers' goals. This is followed by the development of a methodology for measuring farmers' goals, based on fuzzy set theory, and a discussion of the locus of control measure used in the predictive equations of goal scores. The empirical analysis and conclusions ensue. Review of Previous Studies Although a substantial literature regarding farmers' goals and objectives exists (e.g., Hobbs and Warrack; Gasson; Patrick and Kliebenstein), our concern is primarily with the measurement of goals and goal orderings. A number of measurement techniques, including the method of paired comparisons, magnitude estimation, and multidimensional structures, have been employed in previous studies of farmers' goals; both the methodology and earlier studies are briefly reviewed below. The Method of Paired Comparisons The method of paired comparisons provides a procedure for measuring goals which is based on the law of comparative judgment (Thurstone). 2 The law of comparative judgment is "a set of equations relating the proportion of times any given stimulus k is judged greater on a given attribute than any other stimulus j 2The method of paired comparisons is discussed by Edwards, by Torgerson, and by Harman et al.
41
to the scale values and discriminal dispersions of the two stimuli on the psychological continuum" (Torgerson, p. 159).3 That is, an ordering of stimuli can be achieved by comparing each stimulus in the set. To measure farmers' goals, replication over a number of individuals is required. From the paired comparisons, it is possible to construct a frequency matrix F, with elementsfk (j, k = 1, ... , n) indicating the number of times that
goal statement kis preferred overj, where there are n goal statements. Then the observed proportions matrix P, which has elements
Pk
=
where m is the number of respondents, is constructed. Next, the matrix of normal deviates Xis obtained by normalizing the P matrix; hence, elements ofXhave a positive value
fk/m,
when Pjk > .5 and a negative value when Pjk
< .5. Indifference or equality of preference between two stimuli is not permitted, and the elements on the main diagonal of X are set to zero. Under Thurstone's Case V assumptions, a least squares estimate of the scale values for each goal statement can be obtained by averaging the columns of matrix X (Torgerson, p. 173). 4 Harman et al. studied farmers' goals using pair-wise comparisons. Farmers were asked to compare eight goal statements dealing with growth, risk, and personal goals such as consumption. Thurstone scale values were constructed for each of the various sample subgroups. Each individual's common scale value for a particular goal was then regressed on a number of personal and farm enterprise characteristics such as age, education, farming experience, number of dependent children, farm size, and off-farm income. Eight regression equations were estimated "to predict the scalar value of each goal as a function of these characteristics" (Harman et al., p. 22). Although the researchers included a large number of interaction terms in their regressions, without justifying their inclusion, the highest value of R 2 was only .561. For example, the value for the goal "control more acres" was regressed on a total of eighteen right-hand-side 3The law of comparative judgments requires a particular set of postulates which can be found in Torgerson and Harman et al. Ordering stimuli along a psychological continuum is a process known as psychological scaling. 4 Thurstone's Case V assumptions state that the standard deviations of the distributions of the responses to the stimuli are equal for all pairs and that the correlation between responses for the stimuli are equal.
July 1986
42
explanatory terms. In addition, Harman et al. tested the entire group's hierarchy of goals for consensus regarding an ordering of the eight goals, but none was found. However, agreement on farmers' orderings of goals was found to occur when the sample of respondents was stratified into groups according to experience and farm characteristics. Harper and Eastman also used paired comparisons to measure the goals of small-farm operators. In their study, they ranked farm business and family goals separately and tested for congruency between the two rankings. They concluded that the two sets of goals were compatible and that quality of life goals took precedence over profit goals for their sample of farmers. The problem with the paired comparisons method is that it requires respondents to make a binary (all-or-nothing) choice for each pair of goal statements. An alternative approach, developed in this paper, permits an individual to indicate a degree of preference between two alternatives, thereby providing more information than in the binary case. Ratio Scales: Magnitude Estimation While Stevens (1957) identifies a number of methods for constructing ratio scales for psychological magnitudes, only magnitude estimation (ME) has been employed in studies of farmers' goals. 5 With ME, one goal statement is chosen as the base goal and assigned some arbitrary value, usually 100. The respondent evaluates all other goal statements by assigning a value relative to the base goal. For example, if the base goal is assigned a value 100 and a respondent feels that some other goal is twice as important to him as the base goal, he would ascribe a score of 200 to that goal. By varying the base goal (i.e., choosing some other goal to be the basis), the investigator can test for consistency in an individual's responses. Patrick (1983) used ME to evaluate the goal preferences of agricultural producers. He examined eight goals similar to those employed by Harman et al. The subsequent ratio-scale goal scores were used as dependent variables in the regression analysis. Specifically, two measures of risk preference were obtained us5
For a discussion of the magnitude estimation and ratio estimation procedures see Stevens 1966.
Western Journal of Agricultural Economics
ing the ME method. Two risk goals, the avoidance of foreclosure and insuring a stable income, were evaluated relative to the remaining six goals. The ratio-scale risk measures were then regressed on a number of socioeconomic variables including age, education, number of children under eighteen, farm debt, and offfarm income. The proponents of magnitude estimation favor this procedure because it yields measures with ratio-scale properties; that is, the scale has a natural origin and the distance between scale values has meaning. However, since ME is a subjective scaling procedure, it is implicitly assumed that a respondent can evaluate a series of statements in such a way that the resulting ratio-scale has a cardinal interpretation. Such an assumption may be quite unrealistic (Torgerson, p. 55; Roberts, pp. 15557). Further, ME is based on the power law and is, therefore, only valid if the power law is valid for the particular continuum. 6 Finally, ME questionnaires generally take a relatively long time to complete; therefore, in practice, not all possible pair-wise comparisons are elicited. As a result, transitivity is implicitly assumed to hold and one cannot test for it. MultiattributeStructures Multiattribute structures occur when alternatives have a variety of attributes or dimensions. Multidimensional scaling and conjoint measurement are the most commonly known techniques. Although conjoint measurement has been used to investigate farm machinery sales (Shoup), it is not used in measuring farmers' goals because it yields interval rather than ratio-scale data. Multidimensional scaling has been employed in goal analysis to identify differences and similarities among groups of farmers (Patrick, Blake, and Whitaker 1983). Although this technique is useful for measuring goals and their tradeoffs for a group of farmers, it cannot be used to scale the goals of individual farmers. Individual measures of goals and their tradeoffs are needed if farmlevel simulation models, such as the PC TOP MANAGEMENT model, are to be used in farm management programs.
6 The power law relates physical values (x) to perceived (or psychological) magnitudes (y) as follows: y = axP where a and b are constants, a > 0.
Van Kooten, Schoney, and Hayward
An Alternative Approach to Measuring Farmers' Goals
Evaluating Farmer Goals 43 NEUTRAL
(a)
A
B
B
THIS INDICATESTHAT THERE IS NO CLEAR PREFERENCEFOR A OR B
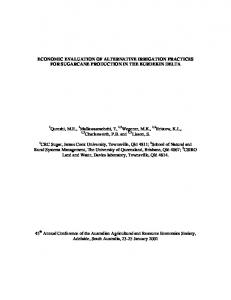
In this study, fuzzy pair-wise comparisons are used to derive a ratio-scale measure of an individual farmer's goals. The procedure is similar to that of traditional pair-wise comparisons as individuals are asked to compare the goal statements one pair at a time. However, unlike the traditional pair-wise method, individuals are not forced to make a binary choice between two stimuli. Respondents are permitted to indicate the degree of preference of one stimulus over another, and indifference between stimuli is permitted. Unlike ME comparisons, the scale values are based on the respondent's entire set of paired comparisons. Although this requires more comparisons, the questionnaire used to elicit all possible pairwise responses can be administered quickly and easily. Using the entire set of paired comparisons also enables one to test for transitivity. 7 Spriggs and Van Kooten suggest a method for making fuzzy pair-wise comparisons. Two goals, A and B, are located at opposite ends of a unit line segment as illustrated in figure 1. Respondents are asked to place a mark on the line which indicates their preferred alternative and the degree by which this alternative is preferred (see figure 1). A measure of the intensity of preference for alternative A over B, rAB, is obtained by measuring the distance from the respondent's mark to the A endpoint. 8 If rAB < .5, alternative B is preferred to A; if rAB = .5,
the respondent is indifferent between A and B; and if rAB > .5, A is preferred to B. A value for rAB of0 or 1 indicates "absolute" preference for one alternative; for example, rAB = 1 im-
plies A is "absolutely" preferred to B. Suppose there are n goal statements and, hence, n(n - 1)/2 pair-wise comparisons. For
each paired comparison (i, j), we obtain a measure rj (i ¢ j) of the degree by which the respondent prefers alternative i to alternative j, and rji = 1 - r measures the degree by which
j is preferred to i. Now construct an individual's fuzzy preference matrix R with elements as follows: 7 A test for transitivity using the data from this study is found in Hayward. 8Alternative A can be placed at either end point and, in practice, the interviewer should randomly change the locations of A and B, as well as the ordering in which the pair-wise comparisons are presented.
(b)
NEUTRAL
A
I/
B
THIS INDICATESQUITE A STRONG PREFERENCEFOR A OVER B (C)
NEUTRAL
A
I
B
/
THIS INDICATES SOME PREFERENCEFOR B OVER A
Figure 1. A fuzzy approach for making pairwise comparisons between items A and B R 0° ifi=j r, ifi Ij
V i,ji
l,. .. .n. v i~j=1,.. . ,n.
From the individual's preference matrix R, it is possible to calculate a measure of preference, m, for each goal. For goal j, the intensity of preference measure is defined as follows: which n
to 1 wh l
r
which has a range of 0 to 1 with larger values indicating a greater intensity of preference for that goal. (The procedure is described in the appendix.) The resulting measures have ratio scale properties. They can be used to rank the n goals and can be used as dependent variables in regression analysis to determine the impact of farm enterprise and operator characteristics on goal ordering. A Measure of Motivation Since socioeconomic variables generally explain no more than 50% of the variation in goal preferences, many researchers believe that a measure of psychological attitude is required as an explanatory variable in the goal scores regression equations. The James Locus of Control or I-E (internal-external) scale (James 1981), an updated version of the James-Phares I-E scale (James 1957), measures the extent to which an individual attributes events to factors either within or beyond his control. A person who attributes events to factors within his control is viewed as "internal" and has a lower I-E score, while a person who attributes events to factors outside his control-to chance or fate-is described as "external" and has a higher I-E score (Phares 1978). According to Phares (1979), "the literature on internal-external locus of control shows quite clearly that
44
Western Journalof Agricultural Economics
July 1986
Table 1. Means and Standard Deviations of Goal Scores, Ordered by Mean Goal
Mean
Standard Deviation
FORCED PROFIT LOWERD AVOID WORTH IMPRO VE SIZE LEISURE
.547 .498 .491 .489 .441 .399 .366 .357
.209 .162 .123 .112 .163 .117 .154 .180
individuals who adopt external beliefs or blame the environment or powerful others are often not as alert, do not learn as much, are less active in attempting to solve problems, and are more susceptible to outside influence" (p. 491). That is, they are less motivated than those who adopt internal beliefs and, therefore, exhibit higher I-E scores. Thus, the I-E scale is negatively correlated with psychological motivation (personal communication with William H. James). The James Locus of Control Test consists of sixty questions, of which thirty are fillers. In a study of 400 university students (James 1981), two important factors on the James scale were identified using factor analysis. The first factor accounted for 42% of the variance and was interpreted as a generalized expectancy that one's life is governed by chance or fate. The second factor accounted for 28% of the variance and was interpreted as a generalized expectancy that one has little control over groups and social systems. Farmers deal with a number of stochastic elements beyond their control, most notably price and weather. It is our hypothesis that an individual's perception of control affects his risk behavior. It would seem plausible that an "internal" decision maker would be less risk averse and would place higher priority on goals which maximize income than an individual characterized as "external"; in contrast, an "external" would place higher priority on goals which reduce the chance of being forced out of business or which minimize annual income variations. Thus, an "external" might be expected to employ a greater degree of traditional risk strategies (e.g., hedging, insurance, and diversification) to bring events more under his control.
Empirical Results The following eight goals are used in the current analysis: (1) increase farm size (SIZE), (2) avoid being forced out of business (FORCED), (3) improve family's current standard of living (IMPROVE), (4) avoid years of low profits or losses (A VOID), (5) increase time off from farming (leisure time) (LEISURE), (6) increase net worth (WORTH), (7) reduce farm debt (LOWERD), and (8) make the most profit each year (PROFIT). These goals are similar to those employed by Harman et al. The explanatory variables in the model include socioeconomic variables such as age, farming experience, number of dependent children, education, farm size, net farm income, and net worth, and the James Locus of Control (I-E) score. Except for the latter, these variables are similar to those used in other studies. A survey consisting of the twenty-eight paired goal statements and the James I-E Test was administered to a sample of twenty-four Saskatchewan farmers involved in FARMLAB's PC TOP MANAGEMENT Workshops. 9 The means and standard deviations of the goals scores for the sample are listed in order of their mean value in table 1. Data on farm enterprise and household characteristics were collected as part of the extension workshop; a description of some of these variables is provided in table 2. As a group, the 1984 Top Management participants were relatively young, well-educated, and wealthy. However, in spite of their wealth, their planned withdrawals of income from the family business were relatively low. In addition, their mean debt-to-asset ratios are high (.207) compared to the provincial average (.10). Data from this sample and more recent work suggest that liquidity problems are likely to be encountered if debt-to-asset ratios of .25 are exceeded. This group also had a mean I-E score similar to James's study of university students. 10 9 The questionnaire and an example of the James I-E Test are available from the authors upon request.
10The 400 students tested had a mean I-E score of 39.8 with a standard deviation of 9.99 (James 1981).
Van Kooten, Schoney, and Hayward
EvaluatingFarmer Goals 45
Table 2. Data Definitions and Descriptive Statistics Variable
Description
Mean
Standard Deviation
AGE EXPER CHILD EDUC NW INC IE EXPEN DRATIO ACRES DUML
Age of operator (years) Farming experience (years) Number of dependent children Operator's education (years) Net worth ($000) Expected net income ($000) I-E score Family living expenses ($000) Debt-to-asset ratio Number of acres farmed (000 acs.) DUML = 1 if livestock present
39.4 18.8 2.0 13.4 924.3 22.9 39.6 9.073 .207 1.76 .375
10.4 10.6 1.6 2.7 540.8 31.1 6.5 8.893 .134 9.42 .494
Number of observations = 24
The farm enterprise data consist primarily of actual values for the individual operations, as of 31 December 1983. However, expected net income and family living expenses, as well as machinery purchases and debt repayment, are projections to 31 December 1984, obtained from the PC TOP MANAGEMENT simulation model. Because these variables are based on the farm operator's expectations and plans, they may be more useful in explaining goal choices than the actual values. Since the goal scores fall inside the interval 0-1, the logistics model was used to estimate the regression equations. The logit function can be written in linear form as ln[q/(l - q)] = fX + e
where q is the vector of dependent variables (individual goal scores), d is a vector of coefficients to be estimated, X is a vector of explanatory variables (farm, household, and personal characteristics), and E is a vector of error terms." The model is estimated by ordinary least squares. Eight predictive equations were estimated using a step-wise procedure for maximizing adjusted R 2 to eliminate statistically insignificant explanatory variables. 12 The estimation results are provided in table 3. The goodness-of-fit of the estimated equations is 1 l For a discussion of logit models, see Intriligator (pp. 173-76). None of the goal scores was equal to 0 or 1.0. Since the goal scores are not probabilities, the dependent variable cannot properly be given a log-odds interpretation. The Breusch-Pagan test indicated that the hypothesis of constant error variance could not be rejected for any of the equations in the model (see Johnston, p. 300). 12 Because there is no theoretical underpinning regarding which farmer characteristics are to be included, the model was purposely kept simple. A seemingly unrelated regression of the final model improved the test statistics, but it did not change the signs on any of the estimated coefficients.
generally better than that obtained in previous studies (e.g., Harman et al.; Patrick, Blake, and Whitaker 1981).13 This is particularly true for those equations where the I-E score is a significant explanatory variable. The results indicate that an individual who is characterized as an "external" (higher I-E score) is more likely to pursue goals of avoiding low profits/losses (A VOID) and reducing farm debt (LO WERD), while an "internal" will assign greater weights to making the most profit each year (PROFIT). This is as expected from the hypothesized effect of the locus of control (I-E) score on risk behavior. However, the results indicate that increasing the I-E scorethat is, becoming more "external"-increases the net worth (WORTH) and decreases leisure time (LEISURE) goal scores. This is contrary to what would be hypothesized, as it would be expected that an "internal" would try to maximize net worth and would be less concerned with leisure time. However, increasing net worth could also be viewed as increasing riskbearing ability. Producers with livestock, as represented by the variable DUML, seem more intent on increasing farm size than do those without livestock. Perhaps this is because operations with livestock tend to be smaller, on average, than specialized grain operations and because they are seeking to shift production entirely to grain. DUML was found to be negatively correlated with the goal "avoid being forced out of business" (FORCED), suggesting that diversified 1 3Our results are not truly comparable with those of the previous studies because we employed a different method to collect the data required to construct the goal scores and because we do not use the same explanatory variables.
Western Journal of Agricultural Economics
46 July 1986
Table 3. Regression of Goal Scores on Farm Enterprise and Household Characteristics Dependent Goal Variable
Explanatory
Variable CONSTANT
FORCED
PROFIT LOWERD
.145
2.552
(.27)
(1.42) -. 056 (-1.06)
AGE
-2.901
(-3.19) -. 017 (-1.78)
AVOID
a
WORTH IMPROVE
SIZE
-. 942
.748
-. 256
-. 407
(-1.40)
(.71) -. 706 (-4.47)
(-.83)
(-1.09)
EXPER
.056 (1.11)
.130 (1.38)
-. 027 (-1.87)
CHILD
.223 (1.93)
-. 084 (-1.45)
-. 101 (-1.00)
.
EDUC
EXPEN DRATIO ACRES DUML R2 a
.333 (1.15) -1.154 (-2.09) .180
1.762 (1.08) -. 276 (-1.22)
.342
-. 269 (-2.82)
.068
.166
(2.91)
INC -. 042 (-1.18)
-1.733
(-1.24) .041 (2.62)
(2.11) NW
IE
LEISURE
.047 (3.02) .037 (3.33) .245 (2.43)
.005 (1.75) .027 (1.94)
-. 164 (-1.72)
.546
.425
.002 (3.28) .008 (-1.92) .051 (1.97) .044 (2.65) -1.927 (-1.63) -. 881 (-3.03)
.610
.007 (2.45) -. 067 (-2.64) -. 024 (-2.24)
.029 (1.68) 1.690 (1.32)
-. 109 (-1.12)
.499
.633 (2.00) .312
.635
The t-statistics are provided in parentheses.
operators (i.e., those with some livestock) viewed foreclosure to be less likely than their specialized counterparts. Education and the goal of improving the family's standard of living (IMPROVE) were found to be positively correlated. This finding is consistent with consumption function studies which indicate that education increases propensity to consume. The income variable is significantly positive in the "avoid years of low profit or losses" (A VOID) equation. This indicates that higher income farmers are more concerned with reducing variations in income and provides evidence that the frequently postulated risk-income tradeoff may not always hold. Alternatively, farmers with high incomes may have correspondingly larger cash flow requirements and are, therefore, less able to withstand variations in income. The empirical results also indicate that higher debt leverage, as represented by the debt-to-asset ratio (DRATIO), and advancing age increase desire for leisure. Surprisingly, having more children re-
duces the desire for leisure. Age is negatively related to the desire to increase net worth (WORTH), reduce debt (LOWERD), and maximize profit (PROFIT), presumably because older farmers are less concerned with increasing wealth. Age and farming experience have the opposite sign in the PROFIT equation. In this sample, the two variables are not as closely correlated as one might suspect because a significant number of the respondents entered farming at a later stage in life. Family projected living expenses (EXPEN) are positively correlated with the goals WORTH and
LO WERD. This is not as expected since goals of greater net worth and lower debt will require a farmer to decrease his family living expenses. Conclusions Since understanding and assessing decision maker objectives are important in extension
and policy roles, it is necessary for agricultural
Van Kooten, Schoney, and Hayward
Evaluating Farmer Goals 47
economists to provide quantifiable measures References of goals which can then be used in extension programs and for evaluating agricultural pol- Basu, K. "Revealed Preference Theory." J. Econ. Theory icy. In this paper, we provide an improved 32(1984):212-27. procedure for eliciting information about these Baumol, William J. Economic Theory and Operations Analysis, 2nd ed. Englewood Cliffs NJ: Prentice-Hall, goals. We derive ratio-scale measures of the 1965. goals for individual respondents using a fuzzy Bellman, R. E., and L. A. Zadeh. "Decision-Making in a methodology; however, at this stage of the reFuzzy Environment." Manage. Sci. 17(1970):B141search, we do not consider the goals themB164. selves to have fuzzy set characteristics (Bell- Cyert, Richard M., and James G. March. A Behavioral man and Zadeh). Therefore, an objective of Theory of the Firm. Englewood Cliffs NJ: Prenticefuture research in agricultural decision proHall, 1963. cesses is to develop the appropriate method- Edwards, Allen L. Techniques ofAttitude Scale Construction. New York: Appleton-Century-Crofts, 1957. ology to optimize goals within a fuzzy-set, decision environment.
In addition, we employ a locus of control measure, the James I-E scale, as a measure of an individual's perception of control over his own life. The I-E score is a significant variable in explaining at least half of the eight goal scores. It is posited that an individual's perception of control over his life affects his goals and, therefore, his risk behavior. This is the case with two of the three goals with risk behavior connotations. The I-E score is a significant variable in explaining LO WERD (lower farm debt) and A VOID (avoid years of low profits or losses). The results indicate that an "external," who feels that events are beyond his personal control, will value those goals more highly than an "internal," who feels that events are within his control. The I-E score is not a significant variable in explaining the third riskrelated goal, FORCED(avoid being forced out of business). However, with the exception of the livestock dummy variable, none of the other variables is significant in explaining variation in this goal. Since the locus of control has its foundations in psychology, has been generalized to nonfarm groups, and provides an easily quantifiable measure of at least some element of psychological attitude, the I-E scale offers a rich potential in future research and extension in agricultural economics. Finally, we suggest that the linkages and underlying causality between personal, financial, and motivational forces are complex and need further interdisciplinary research by the psychological, management, and economics disciplines.
[Received March 1985; final revision received January 1986.]
Ferguson, C. E. "The Theory of Multi-Dimensional Utility Analysis in Relation to Multiple Goal Business Behavior." S. Econ. J. 32(1965):169-75. Gasson, Ruth. "Goals and Values of Farmers." J. Agr. Econ. 24(1973):521-37. Hardaker, J. B., and J. R. Anderson. "Why Farm Recording Systems Are Doomed to Failure." Rev. Mktg. andAgr. Econ. 49(Dec. 1981), pp. 199-202. Harman, Wyatte L., Roy E. Hatch, Vernon R. Eidman, and P. L. Claypool. An Evaluation of FactorsAffecting the Hierarchy of Multiple Goals. Oklahoma State Agr. Exp. Sta. Tech. Bull. T-134, June 1972. Harper, Wilmer M., and Clyde Eastman. "An Evaluation of Goal Hierarchies for Small Farm Operators." Amer. J. Agr. Econ. 62(1980):742-47. Hayward, Keith A. An Evaluation of Goal Hierarchies for AgriculturalProducers.M.Sc. thesis, University of Saskatchewan, 1985. Hobbs, D. J., and A. A. Warrack. Summary of Research on the Relation of Goals, Values, and Attitudes to Farm Management Performance. University of Minnesota Agr. Exp. Sta. Tech. Bull. No. 258, 1968. Intriligator, Michael D. Econometric Models, Techniques andApplications.Englewood Cliffs NJ: Prentice-Hall, 1978. James, William H. "A Comparative Factor-Analytic Study of the Rotter and James Locus of Control Scales." Paper presented at the Western Psychological Association meetings, Los Angeles, April 1981. . Internal and External Control of Reinforcement as a Basic Variablein Learning Theory. Ph.D. thesis, Ohio State University, 1957. Johnston, J. Econometric Methods, 3rd ed. New York: McGraw-Hill Book Co., 1984. Kaufmann, Arnold, and Madam M. Gupta. Introduction to Fuzzy Arithmetic. New York: Van Nostrand Reinhold Co., 1985. Lichtenstein, Sarah, and Paul Slovic. "Response-Induced Reversals of Preferences in Gambling: An Extended Replication in Las Vegas." J. Experimental Psych. 101(1973):16-20. Patrick, George F. "Effects of Alternative Goal Orientations on Farm Firm Growth and Survival." N. Cent. J. Agr. Econ. 3(1981):29-38.
Western Journalof Agricultural Economics
48 July 1986 - "Measurement of Farmers' Goals with Magnitude Estimation." Paper presented at AAEA meetings, West Lafayette IN, 1983. Patrick, George F., and Ludwig M. Eisgruber. "The Impact of Managerial Ability and Capital Structure on Growth of the Farm Firm." Amer. J. Agr. Econ. 50(1968):491-506. Patrick, George F., and James B. Kliebenstein. Multiple Goals in Farm-FirmDecision-Making:A Social Science Perspective. Purdue University Agr. Exp. Sta. Bull. No. 306, Dec. 1980. Patrick, George F., Brian F. Blake, and Suzanne H. Whitaker. "Farmers' Goals: Uni- or Multi-Dimensional?" Amer. J. Agr. Econ. 65(1983):315-20. . "Magnitude Estimation: An Application to Farmers' Risk-Income Preferences." West. J. Agr. Econ. 6(1981):239-48. Phares, E. Jerry. ClinicalPsychology: Concepts, Methods, and Profession. Homewood IL: Dorsey Press, 1979. "Locus of Control." Dimensions of Personality, eds., Harvey London and John E. Exner, Jr. New York: John Wiley & Sons, 1978. Roberts, Fred S. Measurement Theory. Reading MA: Addison-Wesley Publishing Co., 1979. Schoemaker, Paul J. H. Experiments on Decisions under Risk: The Expected Utility Hypothesis. Boston: Maritinus Nijhoff Publishing, 1980. Schoney, Richard A. "Using Extension Workshops as a Means for Collecting Farm-Level Data." Mimeographed. University of Saskatchewan, 1984. Shoup, David W. "Using Conjoint Analysis to Forecast Saleable Machine Features." Paper No. 81-1518 presented at the American Society of Agricultural Engineers winter meetings, Chicago, 1981. Simon, Herbert A. Models of Man: Social and Rational. New York: John Wiley & Sons, 1957. Spriggs, John, and G. C. Van Kooten. "An Experience in Defining a Marketing Question." Can. J. Agr. Econ., no. 31 (Dec. 1983), pp. 79-93. Stevens, S. S. "A Metric for Social Consensus." Science 151(1966):530-41. ."On the Psychophysical Law." Psych. Rev. 64(May 1957), pp. 153-81. Taylor, Julia S. "Decision-Making: A Fuzzy Model." Mimeographed. Dep. Agr. Econ., University of Saskatchewan, 1985. Thurstone, L. L. "A Law of Comparative Judgement." Psych. Rev. 32(1927):273-86. Torgerson, Warren S. Theory and Methods of Scaling. New York: John Wiley & Sons, 1958.
where the element r, is a measure of how much goal i is preferred to alternativej and takes on values in the closed interval [0, 1]. Note that r, = 1 - rj (Vi = j). There are three goals 1, 2, and 3 and, hence, three possible exact goal scorings. The three possible exact scorings C,, C2, and C3 can be shown in matrix form as [0 1 C,=
0 0
L
C C2= 1 r31 [
C3= r2
1
0
r23
r32
0
,
0 rl3 0 1 , and 0
r12
0
1 1
0 0 0
.
0
For illustration, in matrix Ci, the ones appearing in row 1 indicate that goal 1 is definitely preferred to goals 2 and 3. Since ri = 1 - rj (Vi =j), all the information about the fuzzy preference matrix is contained in the values r, 2, r, 3, and r23. We can thus summarize the information from matrix R as a point in three-dimensional space. Such a point must lie within a cube, with length, height, and depth all of one unit and one corer the origin, as in figure 2. Such a point is denoted in figure 2 as (r12, rl3, r23). Each
exact scoring can be represented by a line segment, and these are shown in figure 2 as the three hatched lines (ci, c2, and c3). Thus, for example, any point along the line segment between points (1, 1, 0) and (1, 1, 1) represents the exact scoring with goal 1 definitely the most preferred (Ci).
Given a point (rl 2, rl3, r23), we wish to calculate the shortest euclidean distance from that point to each exact scoring and, thereby, find the exact scoring to which it is
r23
O(10,1) C 2
(
Appendix
(1, 1,0 )
In this- appendix, a method for obtaining a measure for 14 ranking goals is described. Consider for simplicity a 3 x 3 group fuzzy preference matrix (R) such that
R=
0
r12
r13
r21
0
r23
Lr3
r32 0
]
I
Figure 2. distance 14
Graphical representation of fuzzy
Portions of this appendix are adapted from Taylor.
Evaluating Farmer Goals 49
Van Kooten, Schoney, and Hayward' closest, i.e., the nearest exact set (also see Basu). The shortest euclidean distance of point (r12, r13, r23) from cl is given by 2 /2
r 13)2 + (r23 - r2 3) ]
d, = [(1 - r1 )2 + (1 2
= (r2l + r2)
Similarly, the shortest euclidean distance of this point from c2 is d2= [(0 - r12)
2
+ (r3-
2
r13) + (
- r23)2]
and the shortest distance from c3 is 2
d3 = [(r 2 - r12 ) + (rI3 - 0)2 + (r2 3 - 0)2]1/2 = (r23 + r23).
When we have three goals, the distance or measure for goal alternative j can be written as \%
since ri, = 0, V i.
This expression can be generalized to the case of k alternatives:
dj=
-
k
/2 t r2 .
\i=1i
m= 1 -
/(k- 1)1,
2
= (r22 + r22)',
3
2 The maximum value which dj can take on is (k - 1)' . For convenience of interpretation, we normalize the distance measure by dividing by the maximum possible value, and subtract the result from 1. This yields our goal measure
which has a range of 0 to 1 with larger values indicating a higher goal measure for alternative j. As an example, consider an individual who is asked to make fuzzy pair-wise comparisons among 3 goals. Suppose goal 1 is preferred to goal 2 by a substantial amount, with the fuzzy measure of preference on the unit interval equal to .9. That is, r12 = .9 and r21 = .1, where r21 measures the (non)preference of goal 2 over goal 1. Assume the remaining fuzzy measures are rl3 = .4 and r23 = .3. Transitivity holds since 3 is preferred to 1 (since r3 = .6 > .5), 1 is preferred to 2, and 3 is preferred to 2. Using the equations for the goal measures yields: m, = .57, m2 = .19 and m3 = .65. The ranking 3 > 1 > 2 is maintained.
While the ranking itself adds nothing new, the fuzzy methodology does provide a measure of the intensity of the ranking. Hence, this method provides more information than the simple ranking obtained by nonfuzzy procedures.