An Application-Based Performance Evaluation of. NASA's Nebula Cloud Computing Platform. Subhash Saini, Steve Heistand, Haoqiang Jin, Johnny Chang, ...
An Application-Based Performance Evaluation of NASA’s Nebula Cloud Computing Platform Subhash Saini, Steve Heistand, Haoqiang Jin, Johnny Chang, Robert Hood, Piyush Mehrotra, and Rupak Biswas NASA Advanced Supercomputing Division NASA Ames Research Center Moffett Field, California 94035-1000, USA {subhash.saini, steve.heistand, haoqiang.jin, johnny.chang, robert.hood, piyush.mehrotra, rupak.biswas}@nasa.gov Abstract—The high performance computing (HPC) community has shown tremendous interest in exploring cloud computing as it promises high potential. In this paper, we examine the feasibility, performance, and scalability of production quality scientific and engineering applications of interest to NASA on NASA’s cloud computing platform, called Nebula, hosted at Ames Research Center. This work represents the comprehensive evaluation of Nebula using NUTTCP, HPCC, NPB, I/O, and MPI function benchmarks as well as four applications representative of the NASA HPC workload. Specifically, we compare Nebula performance on some of these benchmarks and applications to that of NASA’s Pleiades supercomputer, a traditional HPC system. We also investigate the impact of virtIO and jumbo frames on interconnect performance. Overall results indicate that on Nebula (i) virtIO and jumbo frames improve network bandwidth by a factor of 5x, (ii) there is a significant virtualization layer overhead of about 10% to 25%, (iii) write performance is lower by a factor of 25x, (iv) latency for short MPI messages is very high, and (v) overall performance is 15% to 48% lower than that on Pleiades for NASA HPC applications. We also comment on the usability of the cloud platform. Keywords: Cloud computing, performance evaluation, benchmarking, computational fluid dynamics, climate modeling.
I.
INTRODUCTION
Cloud computing is currently a hot topic in highperformance computing (HPC) [1-7]. It gives the illusion of virtually infinite computing resources on demand (elasticity), and has several novel features such as real-time resource scalability, low cost, free maintenance, elimination of any up-front commitment by users, customized and controlled environments, and a pay-per-use model on shared multitenant resources. The cloud computing paradigm shifts the acquisition and maintenance of hardware and sometimes software systems by individuals and organizations to services that are remotely accessible via the Internet and run by private and public entities. In the past four years, several investigators have examined the feasibility of using public clouds, mostly the Amazon Cloud for high-performance scientific computing [2-7]. He et al. performed a case study with a NASA climate prediction application using three public clouds but did not provide a detailed analysis of the performance difference or scalability issues [8]. Jackson et al. evaluated Amazon EC2 using seven DOE applications [6]. Ramakrishnan et al. evaluated performance of Amazon EC2 HPC, a new HPC version of Amazon EC2 [9-10]. In addition to the
.
performance evaluation of public clouds, there have also been studies conducted on private clouds; the DOE cloud Magellan being the prime example [11]. In 2009, NASA began work on its own cloud computing pilot project, called Nebula [12]. It utilized cutting-edge technologies and infrastructure to provide a platform for the rapid development of policy-compliant, secure Web applications for education, public outreach, collaboration, and mission support. An additional focus was to develop an open source, seamless, self-service platform that provides scalable high-capacity computing, storage, and network connectivity to bridge the gap between desktops and supercomputers for NASA scientist and engineers. The goal of this paper is to evaluate the effectiveness of Nebula for NASA-relevant HPC applications. To provide a baseline, we compare its performance to that of Pleiades, NASA’s primary supercomputing system. It is important to note that the Nebula platform was initially not set up to handle the high compute and communication requirements of HPC applications, and the Nebula development team made several modifications, as detailed in the later sections, during the course of this effort in order to optimize the environment for such usage. The overall aim of this effort was to understand the potential role of cloud computing for NASA’s scientific and engineering applications. In this paper, we have compared the performance of Nebula with Pleiades using NUTTCP, HPCC, I/O, NPB, MPI function benchmarks, and four production NASA applications. Our main contributions are as follows: • Quantified the virtualization overhead in Nebula using DGEMM and NPB; • Used low-level MPI function benchmarks to measure performance as a function of message size and core count on Nebula and Pleiades to assess the impact of virtualization on the performance of the MPI library; • Compared the performance of I/O on Nebula with Pleiades; • Assessed the impact of virtual I/O (virtIO) and jumbo frames on the performance of the network; • Conducted detailed performance and scalability analysis using benchmarks and applications to identify the primary limiting factors of Nebula. The remainder of the paper is organized as follows. Section II provides details of the Nebula and Pleiades systems. In Section III we describe the user environment on the Nebula system. In Section IV we briefly describe the
1
benchmarks and applications used in the current study. In Section V we present our results comparing the performance of Nebula to Pleiades. Section VI presents some usability issues. In Section VII we present our conclusions. II.
COMPUTING PLATFORMS
In this section we give a brief description of the Nebula and Pleiades systems used in our study. We also briefly describe the performance enhancement techniques like jumbo frames, virtIO, and TCP/IP tuning, done on Nebula during the course of this study. A. Nebula (Cloud Computer) Nebula has a virtualized cloud-computing environment that provides a mechanism for launching and managing virtual machine instances [12]. Nebula partly consists of 24 Cirrascale VB1315 server nodes, each with two Intel sixcore Westmere (Xeon X5660) processors for a total of 288 cores [13]. Each node has 96 GB of main memory and 2 TB direct attached SATA II hard disk drives for external storage. A 10GigE interconnect based on Cisco Nexus 7000 switch connects the nodes [14]. Even though the compute nodes are virtualized, we used them in a dedicated mode to avoid multi-tenancy so that only one job is assigned on each node. The virtualization layer is provided by hypervisor KVM (Kernel Based Virtual Machine) [15]. Since installation of jumbo frames and virtIO, and tuning of TCP/IP significantly improved the performance of the Nebula’s network during the course of this study, we briefly describe them here. Jumbo Frames: A standard Ethernet frame is 64 to 1518 bytes in size with a header length of 18 bytes and payload of 46 to 1500 bytes. In this study, we installed and used a jumbo frame of 9000 bytes, which is large enough to enclose an Network File System (NFS) data block of 8192 bytes. A jumbo frame has higher efficiency in data transmission since each frame carries more user data while protocol overhead and underlying per-packet delay remain fixed. Such a jumbo frame replaces six frames of 1500 bytes each, thereby producing a net reduction of five frames. As a result only one Transmission Control Protocol/Internet Protocol (TCP/IP) header and Ethernet header is required instead of six, leading to fewer bytes transmitted over the network [16]. virtIO: One of the overheads incurred by the hypervisor is the virtualization of devices. Instead of having several different device emulation mechanisms for network, block, and other drivers, virtIO provides a common front end to standardize the interface and thus increases the reuse of code across the platforms [17]. TCP/IP: Performance optimization of TCP/IP on Nebula involved optimizing TCP memory buffer space and socket buffer sizes at both ends of a TCP connection. B. Pleiades For comparison purposes we also used NASA’s Pleiades supercomputer, an SGI Altix ICE system located at NASA Ames Research Center. As of February 2012, Pleiades comprises 11,776 nodes interconnected with an InfiniBand
.
(IB) network in a hypercube topology [18]. The nodes are based on three different Xeon processors from Intel: Harpertown, Nehalem-EP, and Westmere-EP. In this study, we used only the Westmere-EP based nodes. In Table 1, we compare the characteristics of the two systems, Nebula and Pleiades, used in the present study. There are major differences between the two systems. First is the networks interconnect: 10 GigE Switch vs. 4x QDR IB. Peak bandwidth of IB is 3.2 times higher than 10GigE (32 Gb/s vs. 10 Gb/s). Also, IB has relatively low network latency compared to 10 GigE. In addition, memory per node of Nebula is 4 times higher than Pleiades. The two systems also have a fairly different I/O infrastructure: Nebula uses direct attached SATA II hard disk drives for storage accessible from all nodes via NFS while Pleiades uses both NFS and a Lustre parallel file system. For this study we used NFS on both the systems. TABLE I.
CHARACTERISTICS OF NEBULA AND PLEIADES.
Characteristic Environment type
Peak network perf. Gb/s Network topology Operating system Compiler
Nebula Cloud Intel Westmere (Xeon X5660) 2.80 6 2 12 11.2 134.4 96 Disabled Enabled Cisco Nexus 7000 10 GigE switch 10 Cisco proprietary CentOS v6 Intel 11.1
MPI library
OpenMPI 1.4.3
Math library Type of file system Parallel file system Virtualization
Intel MKL 10.1 NFS no yes Kernel-based Virtual Machine (KVM) yes yes
Processor type Processor speed (GHz) Cores per socket Number of sockets Cores per node Perf. per core (Gflops) Perf./node (Gflops) Main memory (GB) Hyper-Threading (HT) Turbo Boost Network interconnect
Hypervisor Jumbo frames VirtIO
III.
Pleiades HPC system Intel Westmere (Xeon X5670) 2.93 6 2 12 11.7 140.6 24 Enabled Enabled 4x QDR IB 32 Hypercube SLES11SP1 Intel 11.1 MPT 1.25, OpenMPI 1.4.3 Intel MKL 10.1 NFS and Lustre yes no n/a n/a n/a
SETUP OF USER ENVIRONMENT ON NEBULA
The Nebula Dashboard is a web-based management system for creating and running “instances” on Nebula. At the outset of our testing, there were only the five types of instances shown in Table II. Initial testing with the largest instance, m1.xlarge, uncovered several issues: • It was difficult to aggregate enough of these instances to run a 240-process job. • The nodes could be over-subscribed by having as many as five instances running on the same node. Such multi-tenancy severely hampered the performance of
2
•
applications as processes had to compete with others running on the same nodes. By default, hyper-threading was turned on, so two processes in an instance could be running on the same core. TABLE II.
Name
TYPE OF INSTANCES ON NEBULA DASHBOARD
# cpus
m1.tiny m1.small m1.medium m1.large m1.xlarge
1 1 2 4 8
Memory (GB) 0.512 2 4 8 16
Local disk space (GB) 0 20 40 80 160
First, Nebula was rebooted with hyper-threading turned off. Then a new instance type, m1.full0, was created to acquire all 12 cores of a Westmere node. The new instance also provided single-tenancy, that is, the instance “occupied” the whole node and thus was not shared with any other instance. This was a necessary requirement to get any reasonable performance with HPC applications. We also installed Intel compiler 11.1 and OpenMPI 1.4.3. IV.
BENCHMARKS AND APPLICATIONS
In this section we present a brief description of the benchmarks and applications used in this study. A. Network Benchmark (NUTTCP) The network testing tool, NUTTCP, measures network throughput between two peers [19]. It measures the raw Transmission Control Protocol/User Datagram Protocol (TCP/UDP) network layer throughput by transferring memory buffers between the hosts. In addition, it produces information related to the data transfer such as transmitter and receiver CPU utilization along with user, system, and wall-clock times. B. HPC Challenge Benchmarks (HPCC) The HPCC benchmarks are intended to test a variety of attributes that can provide insight into the performance of high-end computing systems [20]. These benchmarks examine not only processor characteristics but also the memory subsystem and system interconnects. C. MPI Function Benchmarks (MFB) The performance of real-world applications that use MPI as the programming model depends significantly on the MPI library and the performance of various point-to-point and collective message exchange operations. Some of the MPI functions used in the NAS Parallel Benchmarks and the four applications are MPI_Bcast, MPI_Allreduce, MPI_Alltoall, and MPI_Sendrecv. D. Sequential I/O Benchmark Sequential Read Write (SRW) is a single process I/O benchmark that writes and reads an 8 GB file using various block sizes ranging from 16 KB to 16384 KB.
.
E. NAS Parallel Benchmarks (NPB) The NPB suite contains eight benchmarks comprising five kernels (CG, FT, EP, MG, and IS) and three compact applications (BT, LU, and SP) [21]. We used NPB MPI version 3.3, Class C in our study. BT, LU, and SP are typical of full production-quality science and engineering applications. F. Science and Engineering Applications For this study, we used four production quality full applications representative of NASA’s workload. 1) OVERFLOW-2 is a general-purpose Navier-Stokes solver for CFD problems [22]. The code uses finite differences in space with implicit time stepping. It uses overset-structured grids to accommodate arbitrarily complex moving geometries. The dataset used is a wing-bodynacelle-pylon geometry (DLRF6) with 23 zones and 36 million grid points. The input dataset is 1.6 GB in size, and the solution file is 2 GB. 2) CART3D is a high fidelity, inviscid CFD application that solves the Euler equations of fluid dynamics [23]. It includes a solver called Flowcart, which uses a secondorder, cell-centered, finite volume upwind spatial discretization scheme, in conjunction with a multi-grid accelerated Runge-Kutta method for steady-state cases. In this study, we used the geometry of the Space Shuttle Launch Vehicle (SSLV) for the simulations. The SSLV uses 24 million cells for computation, and the input dataset is 1.8 GB. The application requires 16 GB of memory to run. 3) USM3D is a 3-D unstructured tetrahedral, cellcentered, finite volume Euler and Navier-Stokes flow solver [24]. Spatial discretization is accomplished using an analytical reconstruction process for computing solution gradients within tetrahedral cells. The solution is advanced in time to a steady-state condition by an implicit Euler timestepping scheme. The test case used 10 million tetrahedral meshes, requiring about 16 GB of memory and 10 GB of disk space. 4) MITgcm (MIT General Circulation Model) is a global ocean simulation model for solving the equations of fluid motion using the hydrostatic approximation [25]. The test case uses 50 million grid points and requires 32 GB of system memory and 20 GB of disk to run. It writes 8 GB of data using Fortran I/O. The test case is a ! degree global ocean simulation with a simulated elapsed time of two days. V.
RESULTS
In this section we present our results for low-level benchmarks (HPCC, MPI functions) compact applications (NPB), and full applications (Overflow, Cart3D, USM3D, and MITgcm). A. Jumbo Frames and Virtual I/O (VirtIO) We measured communication bandwidth between two nodes using the NUTTCP benchmark. Table III shows the
3
results of transfer rate measurements (in Mb/s) for a variety of Nebula configurations (jumbo frames and virtIO). The results are presented in chronological order of the testing and provide the improvement factor over the initial state of the system. The initial transfer rate on Nebula was only 195 Mb/s without virtIO and jumbo frames. By installing virtIO, the rate increased to 519 Mb/s, improving by a factor of 2.7. By enabling jumbo frames, the rate increased to 944 Mb/s. Finally, the Nebula team optimized various parameters of TCP/IP and the rate further increased to 5834 Mb/s, which is still only 58% of the peak of the 10 Gb/s Ethernet network. We also ran the same test using a non-virtualized environment on Nebula, i.e., with the OS directly installed on the bare metal without a virtualization layer. The measured transfer rate for the non-virtualized system was 9600 Mb/s. TABLE III. Test # 1 2 3 4
RESUTS OF TRANSFER RATES (Mb/s) FOR NEBULA
Virtual
VirtIO
yes yes yes yes
no yes yes yes
Jumbo Frames no no yes yes
TCP/IP Tuning no no no yes
Transfer Rate (Mb/s) 195 519 944 5834
Impr. factor 1 2.7 4.8 29.9
In summary, there is a 39% overhead for inter-node (two-node configuration) communication in Nebula due to virtualization. B. HPC Challenge Benchmarks (HPCC) The results of running HPCC Version 1.4.1 on 240 cores of the Pleiades and Nebula are shown in Table IV. Two benchmarks (FFT and GUPS) were not run on Nebula due to very high network latency for small messages. 1) Virtualization Overhead Two benchmarks, DGEMM and STREAM, run on a single core and allow us to assess the impact of virtualization on compute and memory performance, as they do not depend on the network. On Nebula, the performance degradation of DGEMM and STREAM is 33% and 9% respectively compared to Pleiades. The reasons for this lower performance are due to (a) the overhead in translating the memory address instructions, and (b) the executable binary not being able to use the SSSE3 instructions of the chip with the virtual layer in KVM hypervisor [19]. It is clear from these results that overhead due to virtualization is about 33% and 9% for compute and memory bound applications respectively even when there is no communication and I/O. TABLE IV. Computing System Pleiades
DGEMM Gflops
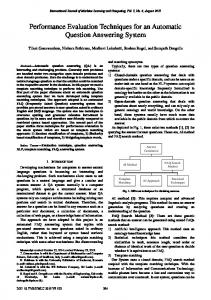
2) Interconnect Impact The network latency and bandwidth results from HPCC clearly show the performance difference between interconnects on the two systems. Random ordered ring latency and bandwidth benchmarks show performance degradation on Nebula due to contention in the network. Network latency and bandwidth is 16.5 and 10.2 times worse respectively than on Pleiades. The performance of HPL is sensitive to characteristics of both the processor and the network, and its performance gives us some insight into how real applications may perform on Nebula. HPL is the highperformance version of the widely published and disseminated Linpack benchmark, used in the TOP500 list. It solves a dense linear system of equations and its performance depends upon DGEMM and the interconnect bandwidth and latency. On a typical supercomputer, roughly 95% of the time is spent in DGEMM. However, for Nebula the 10 GigE network clearly inhibits overall performance of HPL by a factor of 1.7 with corresponding degradation in the percentage of peak performance by almost half (92.7% to 53.7%). Overall, the results of the HPCC runs indicate that the lower performing network interconnect in Nebula has a significant impact upon the performance of even very simple applications as shown by the HPL results. In fact, it would have an even more drastic effect on applications using collective MPI functions such as MPI_Allreduce in MITgcm and USM3D; and MPI_Alltoall in the NPB FT benchmark. C. MPI Function Benchmarks In this section, we describe the performance of MPI functions used in the NPBs and the four applications. 1) Point-to-point Communication Performance of the NPBs and the four applications depends on the performance of MPI_Send and MPI_Recv; therefore it is imperative to evaluate them on the two systems. MPI_Sendrecv: In Figure 1, we plot bandwidth for MPI_Sendrecv for various message sizes ranging from one byte to 512 KB on both systems. Also plotted in this figure is performance relative to Pleiades. In MPI_Sendrecv, each process receives from its left neighbor and sends to its right neighbor at any instant. As can be seen from the plot, the achieved bandwidth is always higher on Pleiades than on Nebula for all message sizes. For message sizes up to 4 KB, the performance on Pleiades is higher by a factor of 30 to 70 except at 4 bytes where it is a factor of 123. For message
SUBSET OF HPCC SUITE PERFORMANCE ON 240 CORES FOR PLEIADES AND CLOUD COMPUTER NEBULA.
EP DGEMM Gflops
STREAM GB/s
PTRANS GB/s
HPL Tflops
HPL Efficiency
Random Order Ring Latency µs
28.7
2.58
91.7
19.1
Random Order Ring Bandwidth MB/s
12.10
11.59
2.33
Nebula
8.13
7.80
2.11
2.73
1.44
53.7
315.4
15.56
Perf. factor
1.49
1.49
1.10
10.51
1.79
1.7
16.5
10.20
32.7
9.4
90.4
44.2
41.4
Perf. decrease (%)
.
32.8
1551
159.11
90.2
4
sizes ranging from 8 KB to 512 KB, Pleiades’ bandwidth is higher by a factor of 5 to 19. Higher bandwidth on Pleiades is due to better network (4x QDR IB vs. 10GigE) and due to network virtualization overhead in Nebula. We see a change in slope on the two systems for message size 32 KB, which is due to a change of algorithm.
Figure 3. Bandwidth of Exchange benchmark on Nebula and Pleiades.
Figure 1. Bandwidth of Sendrecv benchmark on Nebula and Pleiades.
Figure 2 shows the bandwidth of MPI_Sendrecv with a 64 KB message size for core counts ranging from 1 to 128. Bandwidth on Pleiades is higher by a factor of 5 on 4 to 8 cores (within a node) and 12-15 on 16 to 128 cores. Within a node, low performance on Nebula is due to OS virtualization layer overhead and lower inter-node bandwidth is due to different networks and network virtualization overhead.
Figure 4 shows the bandwidth of the MPI_Exchange benchmark with a 64 KB message size for core counts ranging from 1 to 128. Intra-node bandwidth is much higher than inter-node bandwidth on both Nebula and Pleiades. In addition, bandwidth on Pleiades is much higher than that on Nebula due to slower network and significant overhead from network virtualization of the latter. Since MPI_Sendrecv involves a lesser volume of messages exchanged in comparison with MPI_Exchange, it is natural to expect better throughput from MPI_Sendrecv.
Figure 4. Bandwidth of Exchange banchmark on Nebula and Pleiades.
Figure 2. Bandwidth of Sendrecv benchmark on Nebula and Pleiades.
MPI_Exchange: In Figure 3, we plot the performance for the MPI_Exchange benchmark on both systems. Here, each process exchanges messages with both its left and right neighbors simultaneously. The measured bandwidth is always higher on Pleiades than on Nebula for all the message sizes. For small message sizes up to 4 KB, performance on Pleiades is higher by a factor of 30 to 60. For message sizes ranging from 8 KB to 16 KB, Pleiades’ bandwidth is higher by a factor of 20 to 25. For message sizes ranging from 32 KB to 512 KB, Pleiades’ bandwidth is higher by a factor of 7 to 9. Higher bandwidth on Pleiades is again due to a better network (4x QDR IB vs. 10GigE) and also due to network virtualization overhead in Nebula.
.
2) Collective Communications The performance of the NPBs and the four applications used in this study significantly depends on the performance and scalability of collective MPI functions. We present the performance of MPI collective functions for message sizes ranging from 1 byte to 512 KB along with the scalability for the 8-byte message size used in MPI_Allreduce in MITgcm, the 64 KB message size in MPI_Allreduce of NPB FT, and the 1 MB message used in MPI_Bcast of Overflow. An average message size was measured by an SGI tool called MPInside [26]. MPI_Allreduce: In Figure 5, we plot the average time for MPI_Allreduce on both systems for MITgcm and USM3D. The performance on Pleiades is always higher than that on Nebula, however the performance gap decreases as the message size increases. For message sizes: small (4 bytes to 2 KB); medium (4 KB to 64 KB), and large (128 KB to 512 KB), performance of Nebula is lower by a factor of 71 to
5
139, 29 to 46, and 5 to 15 respectively than on Pleiades. Notice that latency (time for a 4-byte message) on Nebula is higher by a factor of 70 than on Pleiades.
Figure 7. Performance of MPI_Bcast on Nebula and Pleiades. Figure 5. Performance of MPI_Allreduce on two systems for 128 cores.
Figure 6 shows the performance of MPI_Allreduce on two systems for a message size of 8 bytes used in MITgcm. Since the message size is very small, the measured time is basically the network latency for the MPI_Allreduce operation. Intra-node performance of Nebula is lower than Pleiades by a factor of 12 to 21. However, inter-node performance is lower by a factor of 40 to 130. Network latency of both systems increases with increasing number of cores, although it is smooth and gradual on Pleiades and more abrupt on Nebula. This difference is due to high network latency of the 10 GigE network and virtualization layer on Nebula whereas Pleiades has low latency IB as its network and no virtualization.
Figure 8 shows the performance of MPI_Bcast for the 1 MB message size used in Overflow. Intra-node broadcast time increases smoothly on both the systems, though it increases more rapidly on Nebula. On Nebula, there is a sharp increase in broadcast time from 8 cores (one node) to 16 cores (two nodes) and as a result its performance decreases from a factor of 8 to 17. Beyond 16 cores, the performance difference between the two systems also decreases (from a factor of 17 at 16 cores to a factor 11 at 128 cores).
Figure 8. Performance of MPI_Bcast for a 1 MB message.
Figure 6. Performance of MPI_Allreduce for 8 byte message.
MPI_Bcast: Figure 7 shows the performance of MPI_Bcast for various message sizes on the two systems. Performance on Nebula is lower by a factor of 150 to 200 for small message sizes of one byte to 8 KB; then this difference decreases rapidly and is only a factor of 10 at 512 KB.
.
MPI_Alltoall: Figure 9 shows the performance of MPI_Alltoall for various message sizes on the two systems for 32 cores. We are presenting results only for 32 cores, as this benchmark did not complete for all the message sizes for 64 and 128 cores on Nebula due to its poor network performance. For small message sizes up to 128 bytes, performance of Nebula is lower by a factor of 24 to 39. Beyond 128 bytes, it is lower by factor of 9 to 15 except at 256 bytes and 4 KB where it is lower by factor of 96 and 24, respectively.
6
Figure 9. Performance of MPI_Alltoall for 32 cores.
Figure 10 shows the performance of MPI_Alltoall for the 64 KB message size used in the FT benchmark of the NPB suite. Intra-node Nebula performance is lower by a factor 4 to 6. For inter-nodes of 16 (2 nodes), 32 (3 nodes), and 64 (6 nodes) cores, performance degrades drastically and is lower by a factor of 19, 10, and 14, respectively.
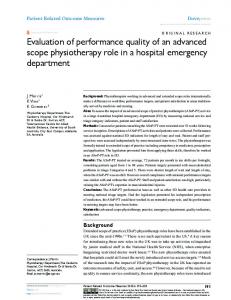
and write operation with various block sizes. Running SRW benchmark can give an indication of how these four applications will fare in a cloud environment. In view of the aforesaid, we used a file size of 8 GB and block sizes ranging from 16 KB to 16384 KB. The test first writes an 8 GB file and then reads it. We used NFS on both Pleiades and Nebula. On Nebula, we experimented using different nodes and found no performance difference due to physical location as the I/O has to go through network switch and this incurs overhead due to virtualization and low performance interconnects. Recall that the peak network bandwidth of Nebula (10 GigE) is 3.2 slower than on Pleiades (4x QDR IB). Figure 11 shows write bandwidth on the two systems and the rate at which Nebula can perform writes to disk relative to Pleiades. Write bandwidth is lower on Nebula by factor of 24 to 28 in the entire range of block sizes tested.
Figure 11. Write bandwidth on Nebula and Pleiades
Figure 10. Performance of MPI_Alltoall for 64 KB message size.
In summary, we conclude that: • The performance (network bandwidth and latency) of Nebula with 10 GigE interconnects is much lower than the 4x QDR InfiniBand (IB) interconnects used in Pleiades. • On Nebula, the latency for small messages is significantly worse than 4x QDR IB used in Pleiades, which indicates that applications with small messages will not achieve good performance on Nebula. D. Sequential Read/Write (SRW) All the four applications used in the study perform sequential I/O i.e. all the processes send data to rank 0, which writes it to the file. The main drawback of serial I/O is a lack of parallelism that limits scalability and performance due to the single node bottleneck. The maximum size of files read by MITgcm, Overflow, Cart3D, and USM3D are 1, 2, 4, and 6 GB respectively. The corresponding sizes of the written files are 9, 3, 1, and 1 GB, respectively. Measured read and write block sizes for the four applications range from several KB to several MB. To mimic the I/O pattern, total read/write size and block size of the four applications we used Sequential Read/Write (SRW) benchmark which measures I/O bandwidth for read
.
Figure 12 shows the rate at which Nebula can perform reads from disk relative to Pleiades. Read bandwidth is better on Nebula by a factor of 3 to 4. The reason for this is that reading the data on Nebula is mostly from the cache because the memory per node is four times bigger on Nebula than on Pleiades (96 GB vs. 24 GB), which allowed for a much larger memory cache on the former environment.
Figure 12. Read bandwidth for Nebula and Pleiades.
The reason for low write performance on Nebula is due to overhead of virtualized I/O and location of a disk space. Disk space for I/O on Nebula is NFS mounted to every back-end node acquired in a particular instance. Thus, getting good write performance requires binding the NFS
7
server instance to a node that physically has the disk space. However this information is not available and there is no mechanism to request specific nodes for running an instance. In summary, write bandwidth on Nebula is slower by a factor of 24 to 28 due to virtualization overhead and read bandwidth is better by a factor of 3 to 4. In addition, there is no parallel file system on Nebula, although none of our applications used in this study required it. E. NAS Parallel Benchmarks (NPB) In this section we present results of the NPBs for intranode and inter-node runs on the two systems. We used the same versions of Intel compiler and MPI library OpenMPI for sets of runs. Intra-node results provide the impact of overhead due to the virtualization layer of KVM and internode results give us the effect of slower virtual network of 10 GigE used in Nebula in addition to virtualization overhead. 1) Intra-node Performance Figure 13 shows the performance of NPBs on a single node, split into total, compute and communication times on four and eight cores for Nebula and Pleiades. BT and SP run only on square grids so the 8 core numbers for them actually used 9 cores. Total and compute time of the NPBs except for CG is lower by a factor of 1.1 to 1.3 (10% to 25%). This is consistent with the virtualization overhead of DGEMM within a node (see section V-B1). However, communication time is higher by a factor of 1.1 to 3.5 on Nebula.
on 9, 25, and 121 cores, respectively. Performance of the NPBs on Nebula is lower by a factor of 1.1 to 1.4 or intranode and 3 to 18 for inter-node than on Pleiades. Communication time on Nebula increases as the number of cores increases due to high latency of the 10GbE network. In summary, there is a significant virtualization overhead as indicated by the intra-node results. One can expect performance of the tightly coupled applications to be at least 10% to 25% lower on Nebula than on Pleiades. • Performance is correlated with the intensity of the communication especially for higher core counts. • Performance is much lower for benchmarks (CG and LU) with small message sizes because of high latency on Nebula as these two benchmarks use a large number of small messages. • Performance for higher core counts is much lower than on lower counts due to poor Nebula’s network performance especially latency.
Figure 14. Total time for NPBs on Nebula and Pleiades.
Figure 13. Performance of NPBs on a node for Nebula and Pleiades
2) Inter-node Performance: Figure 14 shows the total time (compute plus communication) relative to Pleiades on Nebula for the number of cores ranging from 4 to 128 cores. Up to 32 cores performance on Nebula is lower by a factor of 1.1 to 2.2. Beyond 32 cores counts performance is lower by a factor of 1.8 to 5.6. Figure 15 shows the compute time relative to Pleiades on Nebula for the number of cores ranging from 4 to 128. Performance of the NPBs on Nebula is lower by a factor of 1.1 to 1.3 than on Pleiades except for CG where the degradation is larger. Figure 16 shows the communication time relative to Pleiades on Nebula for the number of cores ranging from 4 to 128. The BT and SP benchmarks run only on square grids thus the 8, 32, and 128 core runs for them refer to actual runs
.
Figure 15. Compute time for NPBs on Nebula and Pleiades
Figure 16. Communication time for NPBs on Nebula and Pleiades.
8
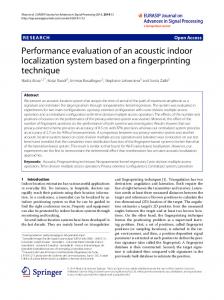
F. Science and Engineering Applications In this subsection we focus on the comparative performance of four full applications, Overflow, Cart3D, USM3D, and MITgcm, on the two systems. Time for all the four applications is for the main loop i.e. compute and communication time and does not include I/O time. Figure 17 summarizes the percentage performance degradation of these applications. Intra-node performance in Cart3D is lower on Nebula by 13.4%, which is basically a virtualization overhead. For inter-node runs, the performance is lower by 15% to 48%, which is mostly due to high latency of the 10GigE. Performance degrades more with an increasing number of cores due to high latency of small messages and virtualization overhead of 10GigE network of Nebula.
and 240 cores, respectively. Timing for MITgcm is for the main loop, which excludes writing a 8GB check file on disk. Performance degradation of USM3D and MITgcm with an increasing number of cores is due to poor performance of MPI_Allreduce on Nebula because of high latency of 10GigE.
Figure 19. Time for Cart3D on Nebula and Pleiades.
Figure 17. Relative performance degradation for applications.
Figures 18-21 provide the performance and scalability of the four full-scale applications used in this study. Each figure shows the scaling performance on the Nebula and Pleiades systems along with the performance relative to Pleiades. The Overflow performance on Nebula is lower by 18%, 29% and 36% on 32, 64, and 128 cores of Pleiades, respectively. Overflow is a memory bound application with negligible communication so performance degradation is basically due to virtualization overhead. It is consistent with our findings of virtualization overhead of 33% in DGEMM (See section V-B1).
Figure 20. Time for USM3D on Nebula and Pleiades.
Figure 21. Time for MITgcm on Nebula and Pleiades.
VI.
Figure 18. Time per step for Overflow on Nebula and Pleiades.
The Cart3D performance on Nebula is 1.2, 1.2, 1.4, and 1.8 times slower than the Pleiades performance on 8, 16, 32, and 64 cores, respectively. The 128-core run on Nebula could not be completed due to the OpenMPI module settings on the Nebula system. The USM3D performance on Nebula is 1.31, 1.39, and 1.59 slower than Pleiades on 32, 64, and 128 cores, respectively. The MITgcm performance on Nebula is 1.4, 1.5, and 1.9 slower than Pleiades on 60, 120,
.
USABILITY ISSUES ON NEBULA
Nebula is distinctly different from that of Pleiades, a traditional HPC system. Nebula is an infrastructure-as-aservice (IaaS) environment, so users have the onus to set up the entire software stack (operating system, compilers, math libraries, MPI libraries) needed to execute their applications. In order to alleviate this issue, we designated one person as the “System Administrator” for Nebula to set up the initial environment and launch the instances. This process is complicated; however, once done, adding more nodes and scaling the cluster size is straightforward. Unfortunately, the nodes frequently failed to launch, so some manual intervention was required to make sure the cluster came up with the requested size. After the initial setup, from a user's perspective the environment was just an N-node cluster that they could use
9
to run applications. However, since there was no batch queuing system installed, some offline coordination was required to keep users from interfering with each other. Nodes had occasional reliability issues as well as network instability causing codes to crash.
[3]
[4]
VII. CONCLUSONS In this paper, we conducted a comprehensive performance evaluation and analysis of Nebula, NASA’s cloud computing platform, using low-level benchmarks (NUTTCP, I/O, HPCC, MPI functions), the NAS Parallel Benchmarks, and four production quality NASA HPC applications. Nebula is a virtualized environment for webbased applications and mid-level scientific computing between desktops and supercomputers. Our focus here was HPC applications that are generally tightly coupled, requiring a significant amount of inter-process communication. In order to assess Nebula’s utility for such applications, we compared its performance to that of a traditional supercomputer, NASA’s Pleiades system. In the course of the study, the Nebula development team made several optimizations that enhanced the suitability for HPC applications including providing a single-tenancy image, and implementing jumbo frames and virtIO to improve network communication performance. Our key findings are two fold: • The virtualization layer utilized in cloud computing platforms to support on-demand access and elasticity of resources is actually detrimental to the performance of HPC applications. This is evident from the lower performance of even single-node runs on Nebula as compared to those on Pleiades. • The lower performance of 10 GigE networks typically used in cloud computing systems as compared to lowlatency high-bandwidth interconnects (such as InfiniBand) used in supercomputers has a significant negative impact on HPC applications. This is particularly true at higher core counts where communication is a larger fraction of the total runtime. Cloud computing environments have recently made significant strides to support highly parallel applications, as evidenced by the introduction and continuous improvement of Amazon EC2’s HPC instances and the optimizations of Nebula during the course of this study. However, until the issues of virtualization overhead and lower communication performance are resolved, cloud computing will not be competitive with traditional supercomputers for HPC applications. REFERENCES [1]
[2]
.
M. Armbrust, A. Fox, R. Griffith, A. D. Joseph, R. H. Katz, A. Konwinski, G. Lee, D. A. Patterson, A. Rabkin, and M. Zaharia. Above the Clouds: A Berkeley View of Cloud Computing. Technical report, UC Berkeley, 2009. C. Evangelinos and C.N. Hill, Cloud Computing for Parallel Scientific HPC Applications: Feasibility of Running Coupled Atmosphere-Ocean Climate Models on Amazon’s EC2, in: Proc. 1st Cloud Computing and Its Applications, 2008, http://cca08.org/papers.php
[5] [6]
[7]
[8]
[9] [10]
[11]
[12] [13] [14] [15] [16] [17]
[18] [19] [20] [21] [22] [23]
[24] [25] [26]
Z. Hill and M. Humphrey. A Quantitative Analysis of High Performance Computing with Amazon’s EC2 Infrastructure: The Death of the Local Cluster? in: Proc. 10th IEEE/ACM International Conference on Grid Computing, 2009. S. Ostermann, A. Iosup, N. Yigitbasi, R. Prodan, T. Fahringer, and D. Epema. A Performance Analysis of EC2 Cloud Computing Services for Scientific Computing. In Lecture Notes of the Institute for Computer Sciences, Social Informatics and Telecommunications Engineering, 2010. Edward Walker, Benchmarking Amazon EC2 for High Performance Scientific Computing, USENIX, vol. 33(5), pp 18-23, Oct 2008, K. R. Jackson, L. Ramakrishnan, K. Muriki, S. Canon, S. Cholia, J. Shalf, H. J. Wasserman, and N. J. Wright. Performance Analysis of High Performance Computing Applications on the Amazon Web Services Cloud, in: Proc. 2nd IEEE International Conference on Cloud Computing Technology and Science (CloudCom), Nov-Dec, 2010, pages 159-168, Indianapolis, IN. J. Napper and P. Bientinesi. Can Cloud Computing Reach the Top500? In: Proc. Combined Workshops on Un-Conventional high performance computing workshop plus memory access workshop, NewYork, NY, USA, 2009. Q. He, S. Zhou, B. Kobler, D. Duy, and T. McGlynn. Case Study for Running HPC Applications in public Clouds. In Proceedings of the 19th ACM International Symposium on High Performance Distributed Computing, NewYork, NY, 2010; Also in 1st Workshop on Scientific Cloud Computing, Chicago, IL, 2010. Amazon Inc. High Performance Computing (HPC) on AWS. http://aws.amazon.com/hpc-applications/ L. Ramakrishnan, R. S. Canon, K. Muriki, I. Sakrejda, and N. J. Wright., Evaluating interconnect and virtualization performance for high performance computing, SIGMETRICS Performance Evaluation Review 40(2) (2012). L. Ramakrishnan, P. T. Zbiegiel, S. Campbell, R. Bradshaw, R. S. Canon, S. Coghlan, I. Sakrejda, N. Desai, T. Declerck, A. Liu, Magellan: Experiences from a Science Cloud, in: 2nd Workshop on Scientific Cloud Computing, San Jose, CA, 2011. Nebula Cloud Computing Platform. http://nebula.nasa.gov/ Cirrascale Blade Server Offerings: http://www.cirrascale.com/serverblades.asp Cisco Nexus 7000 Series Switches: http://www.cisco.com/en/US/products/ps9402/index.html KVM: Kernel Based Virtual Machine, http://www.linuxkvm.org/page/Main_Page Selina Lo, Jumbo frames? Yes!, http://www.networkworld.com/forum/0223jumboyes.html Rusty Russell, virtio: towards a de-facto standard for virtual I/O, devices, ACM SIGOPS Operating Systems Review - Research and developments in the Linux kernel archive, Volume 42, Issue 5, July 2008, ACM New York, NY. Pleiades. http://www.nas.nasa.gov/hecc/resources/pleiades.html Network Performance TooL: Nuttcp, http://www.nuttcp.net/ HPC Challenge Benchmarks, http://icl.cs.utk.edu/hpcc/ NAS Parallel Benchmarks (NPB). http://www.nas.nasa.gov/publications/npb.html OVERFLOW, http://aaac.larc.nasa.gov/~buning/ D. J. Mavriplis, M. J. Aftosmis, and M. Berger. High Resolution Aerospace Applications using the NASA Columbia Supercomputer, in: Proc. ACM/IEEE SC05, Seattle, WA, 2005. USM3D: http://tetruss.larc.nasa.gov/usm3d/ M.I.T General Circulation Model (MITgcm), http://mitgcm.org/ S. Saini, P. Mehrotra, K. Taylor, S. Shende and R. Biswas, Performance Analysis of Scientific and Engineering Applications Using MPInside and TAU, pp. 265-272, in: Proc. 12th IEEE Intl. Conf. on High Performance Computing and Communications, Melbourne, Australia, 2010.
10