application that allows the user to guide the automatic detection of trees from satellite imagery and .... the use of C++ for optimum speed and the direct implementation of graphics display functions to maintain total ... plate to view data from.
An Application for Tree Detection Using Satellite Imagery and Vegetation Data David T. Brown+* Roger V. Hoang+* Matthew R. Sgambati+* Timothy J. Brown* Sergiu M. Dascalu+ Frederick C. Harris, Jr. +* Department of Computer Science and Engineering+ University of Nevada, Reno Reno, NV 89557
CAVCaM* Desert Research Institute Reno, NV 89512
{dtbrown, hoangr, sgambati, dascalus, Fred.Harris}@cse.unr.edu Abstract Virtual reconstruction of large landscapes from satellite imagery can be a time-consuming task due to the number of objects that must be extracted. Poor image resolution and noise hinder automatic detection processes and thus must be corrected by the user. This paper describes an application that allows the user to guide the automatic detection of trees from satellite imagery and spatial vegetation data. The requirements of the system are specified and an architecture that satisfies these constraints is presented. The resulting application provides an intuitive computeraided method for the selection and classification of trees. Keywords: Virtual Reality, Image Processing, Fire
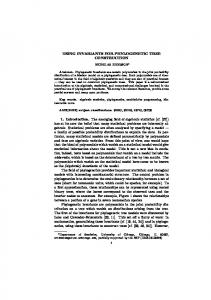
1 Introduction VFIRE [7,8] is an immersive visualization application being developed to study the behavior of wild land fires and to train fire crews to better combat this phenomenon. Fig. 1 is an example of the output generated by the program. The system attempts to generate realistic visualizations of simulated wildfires over real-world locations by combining satellite imagery and other spatial data. In order to create an accurate representation of the world objects found in the satellite imagery should be placed correctly in the virtual world. To do so, the type and location of these objects must first be extracted from the images. Unfortunately, determining this information for each individual object can be a very complicated and time-consuming task, especially due to the sheer number of objects such as trees. Computer vision techniques to automate this process can be effective. However, noise and other factors inhibit the accuracy of these techniques, leading to false positives and false negatives. Therefore, this application was developed to find the locations of trees in an image. Given that there are no constraints on the type, resolution, or geographic area of the image, the system relies heavily on the judgment of the user to overcome tree-detection difficulties that cannot be anticipated or resolved within the algorithm. For this reason, the application uses an interactive detection procedure in which the user must be able to see what the system is doing in order to effectively guide the process. A significant portion of the program is devoted to the task of letting the user see the current status of the operation and what needs to be done next. In addition, a large portion of the program is devoted to allowing the user to control the way that tree detection occurs in order to minimize errors. The rest of this paper is structured as follows: Section 2 presents some of the related work. System requirements are presented in Section 3. Uses cases are covered in Section 4. Classes and Program Subsystems are detailed in Sections 5 and 6. Information on the current implementation of this project as well as the results obtained so far are given in Section 7. Section 8 presents our
conclusions and identifies some of the useful improvements to this project to be made in the future.
Fig.1 Fire Visualization in progress
2 Related Work It is often desirable to have knowledge of the locations, types, and sizes of trees in a particular area. For example, plantation managers may need to have accurate counts of their inventories in order to plan for their harvest activities. Forestry officials often require information about the ages, densities and types of trees in forested areas in order to assess the health of the forests and identify ongoing trends that may or may not be desirable. Similarly, it may be useful to know how much wood is available for harvesting in a particular area and, potentially, how much is available for combustion in the event of a fire. For these reasons, significant effort has been made to find fast and inexpensive ways of obtaining such data. LiDAR data are not available in this project, and an examination of the techniques applied to LiDAR show relatively little applicability. In one instance, an effort was made to distinguish individual trees within a set of LiDAR data by clustering the point cloud in all three spatial dimensions [6]. In any area where the space between trees is sufficiently large, this algorithm could be expected to accurately locate individual trees. A similar approach could conceivably be applied to the photographic images available in this project by treating the brightness values as if they were height values in the LiDAR data. Using this approach, however, would likely result in a high rate of false positive errors because brightness clusters may be produced by a variety of surface features besides trees, and without the height information contained in the LiDAR data, these false clusters would be indistinguishable from legitimate tree clusters. Similar limitations could be expected when trying to apply any LiDAR technique directly to photographic data.
Most of the algorithms that determine the locations of trees in photographic imagery do so by locating local maxima of the pixel values in the image [9]. A method of doing this was shown in [3], where a photographic image of a forested area is searched vertically, horizontally, and along both diagonals to find local maxima occurring in any of eight directions. One of the difficulties that occur in using this method is that a single tree can produce more than one local maximum, resulting in two or more trees being detected where only one tree actually exists. Various approaches have been developed to prevent such multiple detection. One such method is to apply a scale-space filter to the entire image and then extract the individual tree locations using a sophisticated thresholding technique [4]. In another approach, a scale-space filter is applied to the entire image and the individual tree locations are extracted by applying an edge-detection filter to reveal the curved edges enclosing the tree crowns. Analysis of the curvature of those edges produces the locations of likely trees [1]. In yet another method, a window is moved over the image in a scanning pattern and, at every location, the maximum pixel value inside the window is taken to be the local maximum for that region [9,10]. The methods described in [1], [9], and [10], all benefit from the use of multispectral imagery. The different color bands in a multispectral image can be mixed in specific ways to allow certain types of material to appear brighter than others, allowing the image to be optimized for use in a particular algorithm. In addition, all the methods described above use image data under constraints that can be exploited by the algorithm. For example, [8] uses aerial images of “even-aged homogeneous stands of Norway spruce.” The other methods cited above also benefit from a relatively homogeneous scene in which there is scarcely anything to be detected except the desired trees. Such visual similarity among the items to be detected greatly improves accuracy, and the methods cited above work well under those constraints. In this project, however, the algorithm must be able to locate trees in images where no such constraints are assumed to exist and where multispectral imagery may not be available. The research done in [5] comes closer to this goal through the use of template matching. In this instance, a set of tree templates was created from a ray-traced, three-dimensional model based on an image of a Norway spruce forest. The image was filtered with the template, producing a correlation image that could be scanned for local maxima. This method produces good results as long as most of the trees in the image match the template reasonably well. This project also uses template matching, but the templates can be produced more quickly and easily, meaning that a template can readily be created for each group of similar-looking trees in an image. As a result, this project can be used as a stand-alone program to locate trees in a wide variety of images containing multiple groups of groupwise-uniform trees. The only preparation needed is to place the vegetation map data into the program in cases where a vegetation map is necessary. There does exist image analysis software that can perform template matching [2]. However, these software packages would not be expected to list tree locations in georeferenced coordinates nor assist the user by integrating vegetation map information into the image display. Finally, this project has the ability to make tree placements based on vegetation map data alone in cases where photographic imagery is not available.
3 Requirements 3.1 Functional Requirements The functional requirements outline the necessary components that allow for the user to manipulate the view of the landscape, select candidate tree templates, and refine the results of the tree detection algorithm.
1. 2. 3. 4. 5. 6. 7. 8. 9. 10. 11. 12. 13. 14. 15. 16. 17. 18. 19. 20. 21. 22. 23. 24. 25. 26. 27.
The utility shall allow the user to load a photographic image of a geographic area. The utility shall allow the user to display the photographic image. The utility shall allow the user to zoom and scroll the image. The utility shall load vegetation cover, vegetation type, and vegetation height maps if available. The utility shall display vegetation map information for user-specified locations. The utility shall allow the user to display one of the vegetation maps. The utility shall allow the user to display one of the vegetation maps on top of the image. The utility shall allow the user to select image regions to use as tree templates. The utility shall allow the user to select one template as the active template. The utility shall allow the user to edit the active template. The utility shall allow the user to associate a name, type, height, and width for each template. The utility shall allow the user to place templates into groups. The utility shall allow the user to adjust tuning parameters for tree detection. The utility shall allow the user to filter the image to produce a correlation image. The utility shall allow the user to display the correlation image. The utility shall search the correlation image for trees. The utility shall search only within the region currently in view. The utility shall place a mark at each location where a tree is detected. The utility shall allow the user to place a tree mark in any location The utility shall allow the user to mark any location as the location of an artificial structure. The utility shall allow the user to delete any mark from any location. The utility shall allow the user to save all data in a project folder. The utility shall allow the user to load a project from an existing project folder. The utility shall allow the user to output all item locations to a file usable by VFIRE. The utility shall allow the user to create rough tree placements based only on vegetation maps. The utility shall mark tree placements made based on veg map data. The utility shall allow the user to output map-based tree placements to a file usable by VFIRE.
3.2 Nonfunctional Requirements The nonfunctional requirements reflect some of the goals and constraints of the project, such as the use of C++ for optimum speed and the direct implementation of graphics display functions to maintain total control over memory consumption, which is of concern when viewing very large images. 1. 2. 3. 4. 5. 6. 7. 8. 9. 10.
The utility shall directly implement graphics to create and manage templates. The utility shall directly implement graphics to display, scroll, and zoom image. The utility shall use bilinear interpolation to zoom into and out of the image. The utility shall swap correlation images to and from disk to match currently active template. The utility shall use the brightness component of the image for tree detection. The utility shall perform contrast stretching on the correlation image. The utility shall be implemented on the Linux platform. The utility shall be written in C++. The utility shall use GDAL to read image files. The utility shall use FLTK for its GUI.
4 Use Cases The operations commonly used in the tree tree-detection process are shown in Fig. 2. The use cases show that the user is given the flexibility to decide at runtime which geographic images to analyze, which combination of images to view at any moment, and which image to use as the source for any tree placements that are made. The user creates a template by drawing a highlighting mark over a particular tree. Each ach template is given a name, as well as a nominal height and width. These data are eventually placed in the output file le for every tree detected using that template. The user can determine the approximate height and width either by visual inspection of the photographic image or by clicking on the image at the location of the template to view data from the vegetation maps.
Fig. 2: Use Cases. Multiple templates can be created for a single project, and the user can click on any existing template to select it as the active templa template. Subsequently, the user can filter the image using the active template to produce a correlation image. The system then scans the correlation image for
bright spots, corresponding to likely trees. Finally, the system places a mark at the location of each tree detected. The user may then choose to have the current set of tree marks placed in an output file and stop the process or make changes to improve the accuracy and repeat the process.
5 Classes Although the goal of this project is complex from an image analysis perspective, most of the data types used are fairly simple arrays of numbers. Therefore, only six classes are needed, and the classes are completely independent with no inheritance. Fig. 3 shows the classes used in this project.
Fig. 3: Classes Used by Utility An instance of the Image class is used to store the main image used in a tree-detection project. This is generally expected to be a photographic image of the area of interest, though other types of images can be used as long as they possess the same metadata. In addition, the system also uses three other instances of the Image class. The first of these is used to allow viewing of a vegetation map (if any), the second of these is used to allow viewing of the vegetation map simultaneously with the photographic image, and the third of these is used as a work space to hold temporary image data. Image class objects contain the raster data for the image as well as the georeferencing data that associates each location in the image with its corresponding location on the Earth's surface. The Image class also contains the information to let the display system know how to display the image, such as the current scroll position, zoom level, and whether the display buffer needs to be refreshed. Instances of the Attribute class are used to store the vegetation maps for the system. Each vegetation map is stored as a raster of vegetation codes. The meaning of each code is stored in data tables contained in each instance of the class. For each possible vegetation code, the data tables give the associated display color. In addition, data tables also translate vegetation codes into information such as dominant vegetation type, percentage of vegetation cover, or vegetation height, depending on which vegetation map file the Attribute instance is being used to store. The display system is not designed to use objects of the Attribute class. Therefore, vegetation maps are not displayed directly. Instead, the pattern of display colors associated with the raster of vegetation codes is scaled and copied to an object of the Image class, which is then displayed. The vegetation map can be copied onto a blank Image object or it be can mixed with photographic data already present in the Image object to produce an overlay of the vegetation map over the photographic image. The Point class is used to keep track of individual pixels in an image. Each instance of the Point class stores the horizontal and vertical location of a single pixel, as well as its three color components. Multiple instances of the Point class are used to form templates. Each instance of the ItemRef class is used to store an image template. ItemRef is a container class for objects of the Point class. Such collections of Point objects constitute the image templates that are used as filter masks to produce correlation images which are then scanned for bright spots corresponding to tree locations. ItemRef also contains the tuning parameters that govern which bright spots in the correlation image qualify as trees. These parameters determine how bright the spot must be, how wide it must be, and how much brighter it must be than the surrounding image.
ItemRef also stores information about the area covered by each template. When the user chooses to filter an image, only the portion of the image currently in view is filtered, allowing the user to quickly test the accuracy of a newly created or newly altered template without waiting for the entire image to be processed. Finally, ItemRef stores a name, nominal height, and nominal width to be associated with any tree detected using that particular template. ItemGroup is a container class for objects of the ItemRef class. The purpose of ItemGroup is to allow templates to be placed into separate groups, of which only one group is visible at a time. This allows the user to decide which templates and corresponding tree marks will be visible simultaneously with others and which ones will not. If the user wants a particular template and its associated tree marks to be seen only by itself, without any others on the screen at the same time, then this template should be placed into its own separate instance of ItemGroup. ObjectIO is the class used to read and write the binary tree-location files used by VFIRE. Instances of the ObjectIO class are used to write the geographic coordinates of each tree along with its height, width, and type. All the information is written in binary form to save disk space. ObjectIO can also be used to read these data from VFIRE.
6 Program Subsystems This project consists largely of global functions rather than class methods. The functions that display images could have been included with the Image class, but the current configuration is very intuitive. A large collection of global functions, together, constitute the graphics display subsystem, and the graphics display subsystem accepts data from a small, fixed number of Image objects. The process of displaying images is straightforward and predictable in terms of which operations will be performed on which class objects. Fig. 4 shows the arrangement of subsystems.
Fig. 4: System Structure
The File I/O subsystem consists of several functions that read and write the files used by the system. Vegetation map files and GeoTIFF image files are read by the system but never written. Tree-location files are written by the system but never read. Project data files and correlation image files are read and written by the system. GeoTIFF files are usually photographic images, and the File I/O subsystem relies on GDAL to read these files. GDAL has the ability to read and write other types of _les, but this project currently uses it only for GeoTIFF files. The Template subsystem is a set of functions that allow the user to create, edit, and manage the templates used for tree detection. The user creates templates by using the mouse pointer to draw highlighting marks on the desired portion of the image. The Template subsystem keeps track of which pixels have been highlighted, which template the pixel belongs to, and which group the template belongs to. As shown in Fig. 4, the Template subsystem relies on the graphics subsystem to draw the marks. The Template subsystem also keeps the data in the active template current as the zoom level or other view conditions change. The Graphics subsystem includes all the functions that display images on screen. The Graphics subsystem can only process objects of the Image class, and to avoid running out of memory, this project uses only four instances of the this class. The first instance stores the original image. The second stores the original image mixed with the color pattern of one of the vegetation maps. The third stores the color pattern of the vegetation map by itself, and the third is a work space used for temporary storage of correlation images and to show tree placements made using vegetation map data alone. The Graphics subsystem is always set to display one of these Image objects. The object being displayed at any particular time depends on the current view settings selected by the user. The need to display highlighting marks for the templates adds complexity to the display subsystem, and the need to display, at times, very large images adds further complexity. However, the Graphics subsystem always displays one of the four Image objects listed above. The functions in the Algorithm subsystem use the available templates and user-controlled tuning parameters to detect the locations of trees within the image. This is done by filtering the image with the active template to produce a correlation image in which the brightness at any location varies directly as the similarity between the pixels in the template and the pixels in the corresponding neighborhood in the image. There are many ways to calculate the correlation values, but in this implementation, each pixel in the correlation image is calculated by taking the average difference between the two sets of pixels and subtracting this value from 255. Once the correlation image is produced, it is scanned for bright spots and they are marked as likely trees according to the current settings of the tuning parameters
7 Implementation and Results In this section, the software implementation of this project is presented. Examples are provided, demonstrating the use of the currently implemented features, and an explanation is given of the major design and implementation issues. Possible methods to optimize tree-detection accuracy are considered, and several examples of tree-detection results are provided. An exact, quantitative analysis of tree-detection accuracy is not provided because such results vary greatly among images and may vary significantly even within a single image. Instead of numeric detection results, screen shots are provided, showing the detection results obtained for portions of the panchromatic image of Kyle Canyon, Nevada. The screen shots are categorized to exemplify the good, adequate, and poor accuracy regions of the image. Good results were obtained in about fifteen percent of the image, adequate results were obtained in about seventy percent of the image, and poor results were obtained in the remaining fifteen percent. These screen shots are intended to indicate the level of accuracy that can be expected for images of similar resolution depicting scenes similarly suited for tree detection.
7.1 Detecting Trees After loading a photographic image of the ar area of interest, the user identifies es a group of similarlooking trees and selects one of them to serve as the template for the rest. The user then uses the mouse to draw a highlighting mark over that particular tree, covering all pixels intended for inclusion in the template. The tree to be selected as the template is shown in Fig. 5. The image on the leftt is zoomed in so that the individual tree can be easily seen. The tree, itself, is the lightlight colored blob in the center of the image. The shadow of the tree is also visible. It is the dark, elongated shape pointing upward and to the left from the tr tree. It is often helpful to include, in the template, portions of the ground surrounding the tree or, as shown in Fig. 5, the shadow of the tree.
Fig. 5: Enlarged View of Tree Centered in Window and Zoomed out with it highlighted. The right image in Fig. 5 shows the image zoomed out to allow more of the area to be seen. The template can still be seen, highlighted in green. It is intended that the system will search for similar-looking looking trees and mark their locations. Once the template has been defined, ned, the user activates the filtering ltering process. The result of the filtering process is a correlation image, as shown in Fig. 6. The image looks red because the correlation image is monochrome and the data for it is stored in the first rst available array in the Ima Image object being used as a temporary workspace. The second and third arrays (green and blue) are used for intermediate processing of the correlation image. The bright spots in the correlation image of Fig. 6 correspond to locations in the original image that look similar to the template tree. Filtering the original image to produce the correlation image is generally the most time consuming step in the tree tree-detection process.
Fig. 6: Correlation Image and Likely Trees Marked After Processing
After creating the correlation image, the system begins searching for bright spots. It places tree markers in the locations of certain bright spots according to a set of user user-adjusted adjusted tuning parameters. Fig. 6 shows the placement of tree markers in the portion off the original image near the template. Once the tree-detection detection process is satisfactorily completed, the user outputs all tree and artificial structure locations to a binary file le that can be used as input for the VFIRE application. To save space within the file le and reduce the time it takes VFIRE to read the file, tree types are expressed using an item code. The reference list of item codes is shown above the list of existing templates so that the user can place the correct code for each template before generating rating the placement file. The user also has the option of letting the tree type be selected by the vegetation type vegetation map. For example, if the user selects item code 14, then, for each tree, code 14 will be replaced by whatever code matches the tree ee type in the vegetation map at the location of that particular tree. Each template is called a reference because the system refers to the data in the template to determine what to search for.
7.2 Using Vegetation Maps In addition to the photographic imagery of the area of interest, the user can also view vegetation maps of the area. This project is cu currently able to handle three different vegetation maps. The first off these is the map showing vegetation cover. Each 5m x 5m surface cell has a code that determines what percentage of the land in that cell is covered by vegetation. The second type of vegetation map is the vegetation type map. Each 5m_5m cell has a code specifying the dominant vegetation species within that cell. The third type of vegetatio vegetation map is the vegetation height map. Each 5m_5m cell has a code specifying the range of tree heights within the cell. Each of these maps can be displayed by itself or as an overlay onto the photographic image of the area. Fig. 7 shows the vegetation type vegetation getation map for Kyle Canyon, and the vegetation map as an overlay on the panchromatic image. The image overlay is intended to help the user to determine tree types. Similar Similar-looking looking trees found to exist on uniformly colored regions are probably the same ty type of tree. The tree type itself can be determined by clicking anywhere in the region. Vegetation maps can be used to make tree placements even when no photographic image is available.
Fig. 7: Vegetation Map Alone and combined with Photographic
7.3 Tree Detection Accuracy When the system fails to mark the location of a tree, it is considered a false negative result, and when it marks a location where no tree actually exists, it is considered a false positive result. Ideally, the tuning parameters should be adjusted to balance each type of error so that both are kept below the maximum acceptable limit. In practice, however, it may not be possible to keep both types of errors within acceptable limits at the same time. A more generally applicable procedure, therefore, is to adjust the tuning parameters to put the number of false positives within acceptable limits and then create a new template to deal with the remaining false negatives. Fig. 8 shows the same region depicted in Fig. 5 after the inclusion of a second template. As shown in the image, the second template reduces the number of false negatives. The tree markers associated with the second template are shown in a slightly brighter red to indicate that they are associated with the currently active template. This image depicts the adequate, though not exceptional, level of accuracy found in about seventy percent of the image.
Fig. 8: Likely Trees Marked After Processing with Two Templates The second template takes advantage of the fact of being surrounded by shadow on all sides, unlike the first template, which has shadow only on two sides. The trees themselves both look like light-gray blobs. It is the nearby shadows that distinguish them from each other. The second template will more easily detect trees that are similarly surrounded by shadow. This is the reason why some portion of the area surrounding a tree is often included in the template. Including in the template some portion of the immediate area around a tree often produces darker perimeters around bright spots corresponding to trees in the correlation image. As the template approaches the edge of a tree during the filtering process, the shadow in the template overlaps the tree in the image and the shadow in the image overlaps the tree in the template. This situation produces a low correlation value, and it occurs mostly when the template is at the edge of a tree, resulting in a dark perimeter around the bright spot. As the template approaches the center of the tree, the similar regions tend to coincide more, which produces the bright spot in the center. Fig. 9 shows two of the areas where the trees are spaced far enough from one another to show a single light gray blob coupled with a clearly defined shadow. This is the best situation for tree detection. When the trees are too close together, the blobs and shadows interfere with one another and confuse the system. There are areas of the image where tree detection accuracy is unknown. These are the regions entirely covered in shadow.
Fig. 9: Good Results in Area with Few Items to Produce False Positives.
8 Conclusions and Future Work 8.1 Conclusions The purpose of this project is to develop an interactive image analysis system for the detection of trees in geographic images that may not be well suited to tree detection. The system relies on the judgment of the user to compensate for the lack of constraints on the factors that determine the suitability of any given automatic tree detection algorithm. All factors involved in the tree detection process are intended to be controlled by the user at runtime. Consistent with this goal is the selection of a template matching algorithm in which the user is fully responsible for defining the templates used in the detection process and all other parameters are controlled by the user as well. Interactive tree detection using this system is a trial and error process. Ideally, the user continues this process until an acceptable level of accuracy achieved, though there is no guarantee that such accuracy will be attainable for any given image. Using two templates, both referencing medium-sized trees in the panchromatic image of Kyle Canyon, tree detection accuracy was found to be good in about fifteen percent of the image, acceptable in about seventy percent of the image, and poor in the remaining fifteen percent of the image. These results were accomplished in a few hours including the time required to manually delete trees incorrectly placed on top of houses and on roads. Relatively few such manual corrections were necessary due to the great scarcity of houses and roads in the image. However, manual correction would not be a practical solution for the overall problem of the many false positives occurring in less conspicuous areas. The total number of trees detected for the 8km x 6km Kyle Canyon area is well in excess of 100,000. Assuming even a small percentage of these to have been placed incorrectly would likely require an inadvisable number of manual deletions. Other methods of dealing with this problem are discussed later in this chapter.
8.2 Future Work This project currently provides the user with the ability to delete false positives one at a time, but there needs to be a way to delete large numbers of such errors all at once. Such a tool would be less precise, but it would be useful in areas where the number false positives is much greater than the number of correctly identified trees. Most likely, this would be accomplished by letting the user move the viewer to a particular region and then erasing all the tree markers within view. A
better alternative to large-scale deletions would be to allow the user to change the tuning parameters from one region to the next. This would require a restructuring of the data structures to allow multiple sets of tuning parameters to be associated with each template and to allow each set of templates to be associated with a particular subregion of the image. Currently, this project is used mainly to detect trees and other vegetation. Ideally, it could have been used in a more general capacity, to detect any type of item including but not limited to vegetation. In particular, the ability to detect houses and buildings would be desirable. Implementing such capability was investigated but not implemented because the algorithm would have to be very different from the one used for tree detection. All the houses in the image look very different from one another. In addition, the houses are often largely occluded by the surrounding vegetation. For these reasons, template matching is not likely to be successful. Instead, an edge-detection filter would need to be applied and an algorithm used to distinguish the smooth, straight edges associated with artificial structures from the rough irregular edges associated with vegetation. Finally, a clustering algorithm would need to be applied to try to determine which edges belong to the same structure. Such an algorithm could be implemented in this project and could be useful when analyzing images containing large numbers of artificial structures, provided those structures are not located in very close proximity to one another.
References [1] T. Brandtberg, F. Walter. Automated delineation of individual tree crowns in high spatial resolution aerial images by multiple-scale analysis, Machine Vision and Applications, 11(2):6473, October 1998. [2] C. Connolly. Latest developments in machine vision a review of image processing packages, Sensor Review, 23(3):193-201, 2003. [3] D.S. Culvenor. Tida: an algorithm for the delineation of tree crowns in high spatial resolution remotely sensed imagery, Computers & Geosciences, 28(1):33-44, February 2002. [4] K. Dralle, and M. Rudemo. Automatic estimation of individual tree positions from aerial photos, Canadian Journal of Forest Research, 27(11):1728-1736, 1997. [5] M. Larsen, Individual tree top position estimation by template voting, In Proc. Of the Fourth International Airborne Remote Sensing Conference and Exhibition / 21st Canadian Symposium on Remote Sensing, volume 2, pages 83-90, Otawa, Ontario, June 1999. [6] F. Morsdorf, E. Meier, B. Ktz, K.I. Itten, M. Dobbertin, and B. Allgwer, Lidar-based geometric reconstruction of boreal type forest stands at single tree level for forest and wildland fire management, Remote Sensing of Environment, 92(3):353-362, August 2004. [7] M.A. Penick. Vfire: Virtual fire in realistic environments. Master's thesis, University of Nevada Reno, Department of Computer Science and Engineering, Reno, NV 89557, May 2007. [8] M.A. Penick, R.V. Hoang, F.C. Harris Jr., S.M. Dascalu, T.J. Brown, W.R. Sherman, and P.A. McDonald. Managing data and computational complexity for immersive wild-fire visualization, In Proceedings of High Performance Computing Systems (HPCS07), 2007. [9] D.A. Pouliot, D.J. King, F.W. Bell, and D.G. Pitt, Automated tree crown detection and delineation in high-resolution digital camera imagery of coniferous forest regeneration, Remote Sensing of Environment, 82(2):322{334, October 2002. [10] M. Wulder, K.O. Niemann, and D.G. Goodenough, Local maximum filtering for the extraction of tree locations and basal area from high spatial resolution imagery, Remote Sensing of Environment, 73(1):103-114, July 2000.