disease spread of an infection or disease at an individual or population levels[2]. It is widely held in discourse that mathematical models development, their ...
International Journal of Science and Research (IJSR) ISSN (Online): 2319-7064 Index Copernicus Value (2013): 6.14 | Impact Factor (2013): 4.438
An Application of Deterministic and Stochastic Processes to Model Evolving Epidemiology of Tuberculosis in Kenya Kipruto, H1, Mung’atu, J1, Ogila, K1, Adem, A2, Mwalili, S1, Kibuchi, E3, Masini E4, Kiplimo R4and Ong'ang'o JR5 1
Jomo Kenyatta University of Agriculture and Technology, Nairobi Kenya, Department of Statistics and Actuarial Sciences. P.O BOX 62000-002000, Nairobi
2
Mathematics and Physics Department, Technical University of Mombasa, Kenya, P.O Box 90420-80100 G.P.O ,Mombasa, Kenya 3
KEMRI-Wellcome Trust Research Programme, P.O Box 43640 - 00100, 197Lenana Place, Off Lenana Road, Nairobi, Kenya. Ministry of Health, National Leprosy, Tuberculosis and Lung Disease Program, Kenya, P.O. Box 20781 00202 Nairobi 5
Kenya Medical Research Institute, Kenya Medical Research Institute, Centre for Respiratory Disease Research Mbagathi Rd. Nairobi, Kenya, P.O. BOX 54840 – 00200 Nairobi
Abstract: Tuberculosis, a highly infectious disease which is transmitted within and between communities when infected and susceptible individuals interact. Tuberculosis at present is a major public health problem and continues to take toll on the most productive members of the community. An understanding of disease spread dynamics of infectious diseases continues to play a critical role in design of disease control strategies. Modeling of Tuberculosis is useful in understanding disease dynamics as it will guide the importance of basic science as well as public policy, prevention and control of the emerging infectious disease and modeling the spread of the disease. This study sought to establish how long under different frameworks will TB disease recede to extinction. In this study,deterministic and stochastic models for the trends of tuberculosis cases over time in Kenya were developed. Susceptible Infective (SI), Susceptible Infective and Recovered (SIR) and Susceptible Exposed Infective and Recovered (SEIR) models were considered. These models were modified in order to fit the data more precisely (age structure and predisposing factors of the incident cases).The SIR and SEIR model with non-linear incidence rates were further looked at and the stability of their solutions were evaluated. The results indicate that both deterministic and stochastic models can give not only an insight but also an integral description of TB transmission dynamics. Both deterministic and stochastic models fit well to the Kenyan TB epidemic model however with varying time periods. The models show that for deterministic model the number of infected individuals increases dramatically within three years and begins to fall quickly when the transmissible acts are 10 and 15 and falls to close to zero by 15 years but when the transmissible act is 5 the number infected peaks by the 11th year and declines to zero by year 31, while for stochastic models the number infected falls exponentially but when the transmissible acts is 15 the decline is slow and will get to zero by the 53rd year while for 10 transmissible acts to declines to zero by the 18th year. The other transmissible acts (1,3,5) decline to zero by the 9th year.From this study we conclude that if the national control program continues with the current interventions it could take them upto the next 31 years to bring the infection numbers to zero if the deterministic model is considered, while in the stochastic model with accelerated interventions and high recovery rate and assuming that there is no change in the risk factors it could take them upto 11 years to bring the infections to zero.
Keywords: Tuberculosis, HIV, SI, SIR, SEIR, Kenya
1. Introduction Infectious diseases continue to burden our global society,[1]. This continued burden of infectious diseases to both human beings and animals has brought to the fore the need for rigorous study of mathematical epidemiology which entails developing models for predicting the dynamics of the disease spread of an infection or disease at an individual or population levels[2]. It is widely held in discourse that mathematical models development, their analysis and implementation play a natural and important role in obtaining such understanding. It has been noted that model formulation processes when carried out systematically, clarifies assumptions, variables, and parameters; further, models provide conceptual results such as thresholds, basic reproduction number, contact numbers, and replacement numbers [3], [2].
Paper ID: SUB158139
The transmission of a communicable disease involves the passing of a pathogen from one host to another. The incidence rate of new infections is therefore dependent, in part, on the existing number of infectious individuals, which changes dynamically over the course of an epidemic [4]. The understanding of transmission characteristics of infectious diseases is paramount particularly in communities, regions and countries and can lead to better approaches to decreasing the transmission of diseases. Mathematical models therefore play the important role of understanding, comparing, planning, implementation, evaluating, and optimizing various detection, prevention, therapy and control programs [2]. Tuberculosis (TB) is one of the infectious diseases that have been with the human race for a long time. It is caused by bacillus bacteria and the most common causative organism is the mycobacterium tuberculosis,[5]. The transmission of the bacteria is through infectious aerosolized droplet nuclei
Volume 4 Issue 9, September 2015 www.ijsr.net Licensed Under Creative Commons Attribution CC BY
1663
International Journal of Science and Research (IJSR) ISSN (Online): 2319-7064 Index Copernicus Value (2013): 6.14 | Impact Factor (2013): 4.438 generated by coughing, laughing, talking, sneezing and singing. The ability to generate infectious aerosolized droplet nuclei is dependent on the infectivity of the patient where a sputum smear positive patient is considered most infectious,[4]. Globally, the World Health Organization (WHO) estimates that 2 billion people or 1/3 of the world’s population, are infected with mycobacterium tuberculosis,the bacillithat causes TB. In 2012, 1.4 million people died of TB, making it the leading infectious cause of death worldwide, [6]. Kenya is rated as among the 22 high burden TB countries that together account for more than 80% of the world’s TB cases, [7]. Kenya has been seeing a consistent decline in cases notified to the national program over time. The number of notified cases in Kenya has been on a decline with 99,159 cases notified in 2013 with 87,700 and 89,294 cases notified in the years 2013 and 2014 respectively [8]. Kenya has met and even surpassed the WHO targets of detecting 70 % of infectious TB and cure 85% of the detected cases[7]. The WHO estimated 9,500 (5,400-15,000) deaths due to TB in 2012 making TB to be the fourth leading cause of mortality in the country. Tuberculosis affects all age groups, but has its greatest toll in the most productive age group of 15 to 44 years. HIV/AIDS continues to be an important driver of the TB epidemic, with approximately 38% of patients with TB also living with HIV, TB/HIV[6]. Other factors that have contributed to this large TB disease burden include poverty and social deprivation that has led to a mushrooming of peri-urban slums, congestion in prisons and limited access to general health care services [8]. Tuberculosis being a disease of public health importance, thus modeling its progression just like any other infectious disease in a given population will play a central role in providing the understanding of its spread, predicting the future extension of the epidemic, its extinction time, and evaluating the effectiveness and efficiency of control measures. The validity and richness of results of a model strongly depend on the reliability and the accuracy of the model,[9]. In the modelling framework, you initially explore the data to detect patterns and relationships after which you visualize the relationship by fitting a curve to the data. This is the empirical approach in which onechooses a model based on the data with three main aims; the first is to understand the transmission mechanism of the disease. The essential part is a mathematical structure (equations that give us threshold values and other constants which can be used to describe the behavior of the disease). The second aim is to predict the future direction of the epidemic. The third is to understand how control measures can be put in place to curtail the spread of the epidemic (treatment education, immunization andisolation). In this study, we model the tuberculosis disease at the population level, using two types of models namely deterministic models and stochastic models.
Paper ID: SUB158139
Stochastic models rely on chance variation in risks of exposure, disease, and other factors. They provide much more insight into an individual-level modeling, taking into consideration small population size where every individual plays an important role in the model, [10]. Hence, they are used when known heterogeneities are important as in small or isolated populations[10]. It is more useful in scenarios where infection is as a result of contacts with another individual. Deterministic models on the other hand, also known as compartmental models, attempt to describe and explain what happens on average at the population scale. They fit well in large populations. These models categorize individuals into different subgroups (compartments). The Susceptible Exposed Infective and Recovered (SEIR) model, for example, includes four compartments represented by the Susceptibles, Exposed, Infectious and Recovered. Between those compartments we have transition rates which tell us how the size of one compartment changes with respect to the other[10]. According to [11], a single infection in an otherwise susceptible population will start an epidemic only if the density of susceptibles exceeds a threshold. This argument introduced the simplest model – SI model – where the population is divided into two compartments; the susceptible compartment and the infectious compartment. The improvement of SI model is the SIR (susceptible –infectedrecovered) model, a simple model of infectious diseases in which the host population is categorized according to the infection status as susceptible, infectious, or recovered. Subsequent refinement of the model incorporates exposed (infected but not yet infectious) – SEIR, [12]. Various studies have related models to data through statistical inference in order to demonstrate insights of important gains in infectious diseases [13] formulated and analyzed a model which incorporated several scenarios of self-initiated behavioral changes into the mobility patterns of individuals. The results by [13]showed that real time availability of information on the disease and the ensuing behavioral changes in the population may produce a negative impact on disease containment and mitigation. [12], intheirresearch indicated that analytical methods were critical to first show that ignoring latent period or making the common assumption of exponentially distributed latent and infectious periods always result in underestimating the basic reproductive ratio of infection from an outbreak data. The results demonstrated the need to pay careful attention to the intrinsic assumptions embedded within classical frameworks. [14], used mathematical modelling to establish that contact patterns were relevant for infections transmitted by the respiratory or close contact route and that mathematical models were used to design control, strategies. Through integration of both deterministic and stochastic models and methods, [2] showed that mathematical modeling was critical in understanding how infectious diseases spread at both the individual and population level.[15], applied Markov Chain Monte Carlo methods to a discrete time branching process model with two types of infectious individual: diagnosed and hidden.
Volume 4 Issue 9, September 2015 www.ijsr.net Licensed Under Creative Commons Attribution CC BY
1664
International Journal of Science and Research (IJSR) ISSN (Online): 2319-7064 Index Copernicus Value (2013): 6.14 | Impact Factor (2013): 4.438 In this study we look at the huge significance of mathematical modeling in the study of epidemics and epidemiological process in the important field of stochastic branching and deterministic modeling using all forms of TB and smear positive tuberculosis data reported in Kenya in the last 24 years and also discuss the implication when applied to modeling of infectious diseases. The developed stochastic and deterministic models estimated how long it will take before TB isno longera problem in Kenya i.e. the numbers of infectious cases get to zero. This can be generalized to other infectious diseases that are important from epidemiological, mathematical and modeling points of view.
2. Methodology This study was carried in Kenya using notified all forms of TB and smear positive TB from data extracted from the national TB databases for the years 1990-2014. The population estimates used was based on the 1999 Kenya census. The target population was all cases who had been notified to the National Tuberculosis Program as having tuberculosis. TB surveillance system Kenya has a long history of maintaining a robust disease surveillance system with a repository of data for about three decades, [8]. The primary sources of data are TB patient record cards located at the facilities which are usually summarized into the facility register. These data are then abstracted into Tuberculosis Information system named “TIBU”, an electronic data capture system, which transmit data to a central database housed in the cloud. The type of data collected includes demographics, clinical, bacteriological and treatment of each case written in TB patient record card by the health care worker at the facility. These data are then transcribed by the Sub County TB and Leprosy Coordinator (SCTLC) on monthly basis into the tablet computers. The County TB and Leprosy Coordinator (CTLC) conducts facility visits on monthly (or quarterly) basis in order to review the data entered by the SCTLCs for quality and also to ensure that quality services are provided. Also, the national office conducts periodic supervisions and Data Quality Audits to ensure quality services and data. The notification cases database is also maintained at the national office and has data for both smear positive as well all smear negative and extra-pulmonary cases since 1990. This dataset provides a rich repository for data which can be analyzed to deduce disease patterns. Modelling In this study we consider the following aims in carrying out the modelling; to provide a clear understanding of the transmission mechanism of TB disease, obtain an understanding of how long the epidemic will take before it is completely eliminated from the population and finally to have an understanding of the future directions the epidemic will take.
Paper ID: SUB158139
Epidemiological models This study presents standard epidemiological models which are used to study the spread of disease in host populations under different standard conditions. We applied some standard notations as utilized by,Hethcote(2000). S t denotes the number of susceptibles at time𝑡, I(t) denotes the number of infectives at time t, N denotesthe population S t I t size, then s t = and i t = (fractions of respective N N populations). If β is the average number of contacts (sufficient for transmission) of a person per unit time, then βI βi = is the average number of contacts with infectives per N
βI
unit time of one susceptible. βN = Sis the number of new N cases per unit time (becauseS = Ns). In this case the horizontal incidence is called standard incidence. The Simple Mass Action PrincipleηIS = η(Ni )(Ns ), with η as a mass action coefficient, is a standard for horizontal incidence. Comparing, we get ηN = β. So contact rate β increases linearly with population size. Therefore we can v N SI
write: η is the standard incidence if v = 0 and it is a mass N action incidence if v = 1. Susceptible Infective model In this model, the population was divided into just two compartments namely; the susceptible compartment S(t) and the infectious compartmentI(t). It was assumed that the disease is highly infectious but not serious, which means that the infectives remain in contact with susceptible for all timet ≥ 0. We also assumed that the infectives continued to spread the disease till the end of the epidemic, the population size was constant. S t + I t = N…………………………....(1) and homogeneous mixing of population. Infection rate was proportional to the number of infectives, i.e. 𝛽 = 𝑟𝜆𝐼…………………………………..(2) Susceptible Infective Recovery model Under this model which was formulated by [11], it is assumed that the population size is large and constant (except for death from the disease) and homogeneously mixing for continuous time t ≥ 0. Any person who had completely recovered from the disease acquired permanent immunity and the disease had a very short incubation period (so an individual who contracts the disease becomes infective immediately afterwards). This enabled the division of the population into three compartments: 𝑆 𝑡 − susceptibles, 𝐼 𝑡 − infectives, 𝑅(𝑡)-recovered. SEIR model The SEIR model contained one more compartment, the so called exposed compartmentE: These included the people who were infected but the symptoms of the disease were not yet visible. They could not communicate the disease either. These people are in so called latent period: For some disease, it took certain time for an infective agent to multiply inside the host up to the critical level so that the disease actually manifested itself in the body of the host. This is called incubation period. The same assumptions as in the previous models still apply, that is homogeneous mixing (mass action principle), constant population size and the rates of change from one compartment to the other.
Volume 4 Issue 9, September 2015 www.ijsr.net Licensed Under Creative Commons Attribution CC BY
1665
International Journal of Science and Research (IJSR) ISSN (Online): 2319-7064 Index Copernicus Value (2013): 6.14 | Impact Factor (2013): 4.438 Epidemic size at any given time In studying the spreading of the epidemics and its mathematical models, questions concerning how long it will take for the epidemic to diminish are sometimes sought. Is that going to be days, weeks, months or even years? The value N for which infection tends to maintain in the population can be found, whereas for n it would die out and the reintroduction of the infectious agent would be necessary in order for the spread of the infection. The idea of the critical community size appeared. To better understand the TB disease dynamics both the deterministic and stochastic models were implemented. The main aim for this approach is to better understand which of the model provides better and robust estimates which can be used to model tuberculosis disease. In the framework, two important parameters were considered and included; transmissible acts i.e. how many cases one infectious individual will infect and the recovery rate which is how many of those who are infected will recover. In addition, the time considered was 63 years and taken to be the current life expectation at birth in Kenya. In this modelling framework it started with simulations for both deterministic and stochastic models using and initial population of 1000 and once stable models were obtained, real notified cases were subjected to the model and results obtained.
3. Results
respectively. The transmissible act of 5 tends to peak by the 10th year and reduce to zero by the 27th year. While when transmissible acts are 1 or 3 the numbers which move from the susceptible pool to the infectious pool.
Figure 2: DCM Model for the Susceptible to Infected Number of Cases Figure 3 shows the number of infected cases at any particular year. It shows that when the transmissible acts is high the numbers rapidly peaks and also rapidly declines thereafter, when the transmissible acts are 15 and 10 respectively but when transmissible acts is 5 the number of infected numbers tends to assume a normal distribution peaking by year 11 and declines to zero by year 31. When transmissible acts are either 1 or 3 the numbers are barely noticeable and moves to zero by year 3.
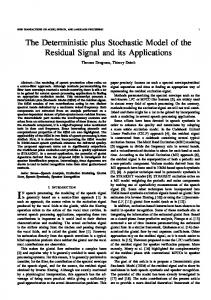
Deterministic Model Simulation Results We carried out simulation using an initial population of 1000 individuals while assuming that transmissible acts can either take 1, 3, 5, 10 or 15 individuals being infected by one single individual at the start of the epidemic. We further assumed that the recovery rates for those who get infected can be 0.80, 0.85 or 0.90. Figure 1 shows that when the transmissible act is large there is a significant drop in the number of cases up to the 5th year and begins to rise and remains close to 200 susceptible cases over all the duration. When the transmissible acts are few i.e. 1 and 3 cases the number of susceptible cases remains high throughout the period, while when transmissible acts are 5 the susceptible cases show an exponential decay over the period but remains high.
Figure 3: DCM Model for the Infected Number of Cases Figure 4 shows the number of infected cases which move to the recovery compartment at any particular year. It shows that when the transmissible acts is high the numbers rapidly peaks and also rapidly declines thereafter, when the transmissible acts are 15 and 10 respectively but when transmissible acts is 5 the number of infected numbers tends to assume a normal distribution peaking by year 11 and declines to zero by year 31. When transmissible acts are either 1 or 3 the numbers are barely noticeable and moves to zero by year 3.
Figure 1: DCM Model for the Susceptible Number of Cases Figure 2 shows that the number of cases that transition from the susceptible group to the infection group is highest when the transmissible acts is large i.e. 10 and 15 and reduces dramatically by the 11th year while peaking by year 3 and 5
Paper ID: SUB158139
Figure 4: DCM Model for the Infected to Recovered Number of Cases
Volume 4 Issue 9, September 2015 www.ijsr.net Licensed Under Creative Commons Attribution CC BY
1666
International Journal of Science and Research (IJSR) ISSN (Online): 2319-7064 Index Copernicus Value (2013): 6.14 | Impact Factor (2013): 4.438 Deterministic Model Results with reported notified cases of Tuberculosis The results presented here relates to the model that is obtained when it is subjected to the actual notifications reported in Kenya. The assumption taken was that a third of the population is infected with the Tuberculosis albeit it could be in latent form and some may never develop TB in their lifetime. Thus in Kenya with an approximate population of 44 million people it is estimated that close to 15 million individuals would be susceptible of developing TB in a lifetime. Figure 5 shows that when the transmissible act is large there is a significant drop in the number of cases up to the 5th year and begins to rise and remains close to 1.5 million susceptible cases over all the duration. When the transmissible acts are few i.e. 1 and 3 cases the number of susceptible cases declines uniformly and remains high throughout the period at approximately 7-8 million susceptible cases, while when transmissible acts are 5 the susceptible cases show an exponential decay over the period but remains high. The observed data shows consistent behavior as the simulated data.
transmissible acts are 15 and 10 respectively but when transmissible acts is 5 the number of infected numbers tends to assume a normal distribution peaking by year 12 and declines to zero by year 31. When transmissible acts are either 1 or 3 the numbers are barely noticeable and moves to zero by year 3.
Figure 7: Observed DCM Model for the Infected Number of Cases Figure 8 shows the number of infected cases which move to the recovery compartment at any particular year. It shows that when the transmissible acts is high the numbers rapidly peaks and also rapidly declines thereafter, when the transmissible acts are 15 and 10 respectively but when transmissible acts is 5 the number of infected numbers tends to assume a normal distribution peaking by year 11 and declines to zero by year 32. When transmissible acts are either 1 or 3 the numbers are barely noticeable and moves to zero by year 3.
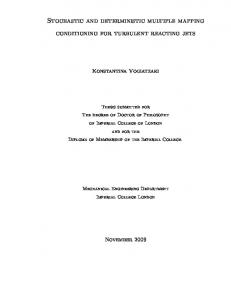
Figure 5: Observed DCM Model for the Susceptible Number of Cases Figure 6 shows that the number of cases that transited from the susceptible to group to the infected pool, the numbers which transition is highest when the transmissible acts is large i.e. 10 and 15 and reduces dramatically by the 11th year while peaking by year 3 and 5 respectively. The transmissible act of 5 tends to peak by the 11th year and reduce to zero by the 28th year. While when transmissible acts are 1 or 3 the numbers which move from the susceptible pool to the infectious pool remain fairly stable at less than 1 million cases all through the period.
Figure 6: Observed DCM Model for the Susceptible to Infected Number of Cases
Figure 8: Observed DCM Model for the Infected to Recovered Number of Cases Figure 9 shows the number of infected cases which eventually recover. The numbers rapidly increase when the transmissible acts is large i.e. 10 and 15, this number peaks by year 10 and 7 respectively. But when transmissible acts are 5 the number of infected numbers tends rise exponentially and peaks by the 17th year and begins to decline throughout the remaining period. When transmissible acts are either 1 or 3 the numbers are barely noticeable and remain constant throughout the period after the 15th year.
Figure 7 shows the number of infected cases at any particular year. It shows that when the transmissible act is high the numbers rapidly peak and decline thereafter. This could be attributed to the high recovery rates, when the
Paper ID: SUB158139
Volume 4 Issue 9, September 2015 www.ijsr.net Licensed Under Creative Commons Attribution CC BY
1667
International Journal of Science and Research (IJSR) ISSN (Online): 2319-7064 Index Copernicus Value (2013): 6.14 | Impact Factor (2013): 4.438 Figure 12 shows the infected number of cases for all the transmissible acts shows a uniform rate of decline for all the transmissible acts with exception of 15 transmissible acts. This shows that the number of infected numbers shows an exponential decay with the number coming to zero by the end of 28 years.
Figure 9: Observed DCM Model for the Recovered Number of Cases Stochastic Model Results The Stochastic Individual Contact Models (SICM) belongs to a novel class of microsimulation models which were developed to mirror the deterministic models but add random variation in all components of the transmission dynamics system, from infection to recovery to vital dynamics (births and deaths). In this research ICM modelled using Epi Model in R. The results presentedbelow relate to simulated data with 1000 individuals. The parameters of interest were transmissible acts per person (1, 3, 5, 10 and 15). This refers to the number of individuals one could potentially infect if left untreated. A total of 5,000 simulations were carried out to obtain the parameter estimates.
Figure 12: Simulated data model for the infected number of cases The figure 13 shows that the number of cases that recover increases sharply up to year 7 after which it begins to decline; the number of cases which recover decline in a stable manner. The number of cases which recover remains lower for the 1, 2 and 3 transmissible acts.
Figure 10 shows that regardless of the transmissible acts there is a uniform decline in the number of susceptible number of cases from the hypothetical 1,000 number of susceptible cases. A more pronounced decline is realized only when the transmissible acts is 15.
Figure13: Simulated data ICM Model for the recovered Number of Cases
Figure 10: Simulated ICM Model for the Susceptible Number of Cases Figure 11 showsthe transition numbers from susceptible to infected shows a rise for all transmissible and peaks after 2 years. The rate of decline is not highly pronounced when the transmissible acts is 15 and declines to zero after 27 years. While the other transmissible acts comes to a close after 13 years.
Observed data stochastic individual contact Model The results presented here relates to the models that is obtained when it is subjected to the actual notifications reported in Kenya. The assumption taken is that a third of the population is infected with the Tuberculosis albeit it could be in latent form and some may never develop TB in their lifetime. Thus in Kenya with an approximate population of 44 million people it is estimated that close to 15 million individuals would be susceptible of developing TB in a lifetime. Figure 14 shows the susceptible number of cases from the estimated Kenyan population was taken to be approximately 15 million people. With an assumed recovery rate of 80, 85 and 90% with transmissible acts per person being 1, 3,5,10 and 15, when the observed data was used it showed that there is close concordance with the simulated model. It shows a smooth decline for the susceptible numbers with exception when the transmissible act is 15, the rate of decline is higher than any other transmissible acts.
Figure 11: Simulated data ICM model for the susceptible to Infected Number of Cases
Paper ID: SUB158139
Volume 4 Issue 9, September 2015 www.ijsr.net Licensed Under Creative Commons Attribution CC BY
1668
International Journal of Science and Research (IJSR) ISSN (Online): 2319-7064 Index Copernicus Value (2013): 6.14 | Impact Factor (2013): 4.438
Figure14: Observed data ICM Model for the Susceptible Number of Cases
Figure 17: Observed ICM Model for the Infected to recovered Number of Cases
Figure 15 show the transition numbers from susceptible to infected shows a rise for all transmissible and peaks after 2 years. The rate of decline is not highly pronounced when the transmissible acts is 15 and declines to zero after 54 years. While the other transmissible acts comes to a close after 9 to 19 years.
The figure 18 shows that the number of cases that recover increases sharply up to year 7 after which it begins to decline; the number of cases which recover decline in a stable manner. The number of cases which recover remains lower for the 1, 2 and 3 transmissible acts. While for the 15 transmissible acts when the recovery rate is 0.80 it remains higher throughout the years.
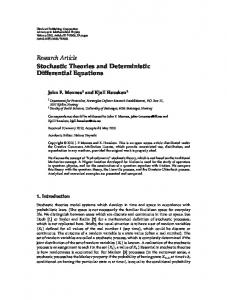
Figure15: Observed ICM Model for the Susceptible to Infected Number of Cases Figure 16 shows the infected number of cases for all the transmissible acts shows a uniform rate of decline for all the transmissible acts with exception of 15 transmissible acts. This shows that the number of infected numbers for 15 transmissible acts shows an exponential decay with the number coming to zero by the end of 53 years.
Figure 16: Observed ICM Model for the Infected Number of Cases The figure 17 shows that the number which transitioned from the infected to recovered class dramatically increases and declines after 4 years with the rate for all the transmissible acts except when the recovery rate is 0.80 when the rate of decline is exponential in nature.
Paper ID: SUB158139
Figure 18: Observed ICM Model for the recovered Number of Cases
4. Discussion Modelling of Tuberculosis has had a long history and among the first model to be developed first in the 1960s, [16]-[18]. Key TB model formulations appeared quickly thereafter. [16], developed a linear model for TB based on three compartments: susceptible, infected non-cases and infectious cases. [19], clearly formulated the connection between TB prevalence and infection rate in his model using a set of differential equations. The studies on modelling Tuberculosis have tried to provide insights into disease transmission dynamics. Among the earlier work that mark the beginning of modern approach to modelling and thoughtful consideration of probabilities in modelling have be highlighted by [16], [18], [20] and [21]. In this study we have made attempts to construct both deterministic and stochastic models which can enable us obtain insights and obtain the integral quantitative description of TB transmission dynamics. The results we obtained indicate that both deterministic and stochastic fit well to the Kenyan TB epidemic model however with varying time periods. The results show that for deterministic model the number of infected individuals increases dramatically within three years and begins to fall quickly when the transmissible acts are 10 and 15 and falls to close to zero by 15 years but when the transmissible act is 5 the number infected peaks by the 11th year and declines to zero by year 31(Figure7). For stochastic models the number infected falls exponentially but when the transmissible acts
Volume 4 Issue 9, September 2015 www.ijsr.net Licensed Under Creative Commons Attribution CC BY
1669
International Journal of Science and Research (IJSR) ISSN (Online): 2319-7064 Index Copernicus Value (2013): 6.14 | Impact Factor (2013): 4.438 is 15 the decline is slow and will get to zero by the 53rd year while for 10 transmissible acts to declines to zero by the 18th year. While the other transmissible acts (1,3,5) decline to zero by the 9th year (Figure 16). The results obtained are consistent with other findings in other studies which have attempted to investigate the broad-level transmission dynamics of tuberculosis, [22].Theirresults however indicated that most parameters do not significantly affect the severity of the TB epidemic; those that do soinclude: disease reactivation rate, fraction of infected individuals who develop TB soon after infection (instead ofa prolonged latent period), number of individuals that an infectious individual infects per year, disease death rate,and population recruitment rate i.e. the transition from the susceptible pool to those who are infected. Model results were in rough agreement with historical case rate data anddeveloping country data. Because transmission is a function of both contact rate and infectivity, [23], formulated a deterministic cluster model to specifically explore the impact of intense and long exposure to individuals with active TB on population level transmission dynamics. In contrast to work by [22]who had consistent assumptions that there is an average number of people who get infected each year from the untreated case, this model does not assume an average number of individuals infected per year from one infectious case. Specifically, this model differentiates between epidemiologically active clusters (defined as active when one member has active TB infection) and casual infections. Model results indicate that casual infections may be as or more important than cluster-generated secondary infections at a population level. In this study, it was assumed that the population is randomly mixing i.e. homogeneous and there is a constant recovery rate of those who are infected at 80, 85 or 90% because of chemotherapy and those who remain continue within the community to infect others.From this results its hypothesized that the transmissible acts can range between 1 to 5 for any infectious case if left untreated. The results obtained have congruence with the spatial stochasticmodel, developed by [24]which explored the role of social clusters in disease transmission. [23],indicated that three parameters that influence the transmission of TB: the size of each individual’ssocial cluster, and the infection rates within and outside of the cluster. When the infection rate is low outside thecluster, an epidemic is only possible when the average cluster size and within-cluster infection rate are largeenough. They then compared this to the mean field model with corresponding parameters (homogenous mixing, except by cluster), and discover that the qualitative model behavior is unchanged, indicating that the model results are robust to mixing heterogeneity. The results we present here however did not explicitly focus on the effects of heterogeneity in demographically distinct populations. More work must be done to better understand the dynamics of disease spread in heterogeneous populations including the exogenous factors that affect disease transmission, and implicit population heterogeneity. This
Paper ID: SUB158139
could hopeful augment more clearer understanding of TB epidemiology.
5. Conclusion From this study it can be concluded that if the national control program continues with the current interventions it could take them up to the next 31 years to bring the infection numbers to zero if the deterministic model is considered while in the stochastic model with accelerated interventions and high recovery rate and assuming that there is no change in the risk factors it could take them upto 11 years to bring the infections to zero. Despite the significant increase in the information from molecular TB studies, some major questions remain unresolved because the natural history of the disease makes its comprehensive study difficult coupled with surveys based on tuberculin skin test are hard to interpret because of the cross-reactivity of BCG vaccine; case notification data underestimates TB burden in the country. Thus there is need to have well detailed models which include both environmental and biological factors into the understanding of the TB transmission dynamics.
References [1]
Legrand N, Ploss A, Balling R, Becker PD, Borsotti C, et al., “Humanized Mice for Modeling Human Infectious Disease: Challenges, Progress, and Outlook.” Cell Host Microbe,6(1):5-9. 2009. [2] Hethcote, H. W. “The Mathematics of Infectious Diseases” : SIAM Review: Vol. 42, No. 4. 2000. [3] Diekmann O, Heesterbeek J.A.P. Mathematical Epidemiology of Infectious Diseases - Model Building, Analysis and Interpretation. New York: John Wiley and Sons, LTD, 2000. [4] Dooley S.W.; Villarino M.E, Lawrence M, Salinas L, Amil S, Rullan J.V, Jarvis W.R, Bloch A.B, Cauthen G.M. Nosocomial transmissions of tuberculosis in a hospital unit for HIV-infected patients. Journal of the American Medical Association.;267:2632-2634.1992 [5] Cadmus S, Palmer S, Okker M, Dale J, Gover K, . “Molecular analysis of human and bovine tubercle bacilli from a local setting in Nigeria.” Journal of clinical microbiology44: 29–34, 2006 [6] WHO. Global tuberculosis report. Geneva: World Health Organization, 2012 [7] Division of Leprosy, TB and Lung Disease Annual Report. Nairobi: Kenya Ministry of Health, 2013. [8] National Leprosy, TB and Lung Disease Annual Report-2014. Nairobi: Kenya Ministry of Health, 2014. [9] Jacob, C. “Branching Processes: Their Role in Epidemiology”. International Journal of Environmental Research and Public Health, 7(3), 1186–1204, 2010. doi:10.3390/ijerph7031204 [10] Bailey, N.T.J. The Mathematical Theory of Infectious Diseases. London: Griffin, second edition, 1975. [11] McKendrick, A. G. “A contribution to the mathematical theory of epidemics.” Proc. R. Soc. Lond. A 115, 700–721, 1927.
Volume 4 Issue 9, September 2015 www.ijsr.net Licensed Under Creative Commons Attribution CC BY
1670
International Journal of Science and Research (IJSR) ISSN (Online): 2319-7064 Index Copernicus Value (2013): 6.14 | Impact Factor (2013): 4.438 [12] Wearing HJ, Rohani P, Keeling MJ. “Appropriate Models for the Management of Infectious Diseases.” PLoS Med2(8), 2005: e320. doi: 10.1371/journal.pmed.0020320 [13] Sandro, M.. Modeling human mobility responses to the large-scale spreading of infectious diseases : Scientific Reports 1, Article number: 62,2011 doi:10.1038/srep00062. Nature Publishing Group. [14] Mossong J, Hens N, Jit M, Beutels P, Auranen K, et al. “Social Contacts and Mixing Patterns Relevant to the Spread of Infectious Diseases”. PLoS Med 5(3): e74, 2008. doi: 10.1371/journal.pmed.0050074 [15] Glass, K., Becker ,N ., Clements, M. “Predicting case numbers during infectious disease outbreaks when some cases are undiagnosed”. Stat. Med., 2006. (doi:10.1002/sim.2523) [16] Waaler H, Geser A, Anderson S. “The use of mathematical models in the study of the epidemiology of tuberculosis.” Am J Public Health; 52:1002-13, 1962. [17] Brogger S. “Systems analysis in tuberculosis control: A model.” American Review of Respiratory Disease. 95:419-434, 1967. [18] Waaler HT, Piot MA.. The use of an epidemiologic model for estimating the effectiveness of tuberculosis control measures: sensitivity of the effectiveness of tuberculosis control measures to the coverage of the population. Bull World Health Organ;41:75-93, 1969. [19] ReVelle CS, Lynn WR, FeldmannF.. “Mathematical models for the economic allocation of tuberculosis control activities in developing nations.” American Review of Respiratory Disease. ;96:893-909, 1967. [20] Azuma Y. A simple simulation model of tuberculosis epidemiology for use without large-scale computers. Bull World Health Organization, 52:313-22, 1975. [21] Styblo K. “The global aspects of tuberculosis and HIV infection.” Bulletin of the International Union against Tuberculosis and Lung Disease; 65:28-32, 1990. [22] Porco TC, Blower SM. “Quantifying the intrinsic transmission dynamics of tuberculosis.” Theoretical Population Biology. 54:117-132, 1998. [23] Aparicio JP, Capurro AF, Castillo-Chavez C. “Transmission and dynamics of tuberculosis on generalized households.” Journal of Theoretical Biology, 206:327-341, 2000. [24] Schinazi RB. “On the role of social clusters in the transmission of infectious diseases.” Theor. Popul. Biol. ;61:163–169, 2002.
Paper ID: SUB158139
Volume 4 Issue 9, September 2015 www.ijsr.net Licensed Under Creative Commons Attribution CC BY
1671