International Journal of Innovation, Management and Technology, Vol. 6, No. 4, August 2015
An Approach for Modeling Inter-arrival Time of Floods P. Stoynov, P. Zlateva, and D. Velev
disasters in a vulnerable geographic area. Statistical data point out that floods are the most frequent natural disasters with 40% of all disasters. It is important to estimate the inter-arrival time between two consecutive floods. The aim of this paper is to propose an approach for modeling inter-arrival time of floods. It is shown that the inter-arrival time between floods can be modeled by a newly proposed type of distribution called ST distributions [4]-[6]. The corresponding stochastic point process registering the appearances of the floods is called ST process. ST distribution and process are defined and their application to modeling flood appearances is demonstrated. The proposed approach is applied for modeling inter-arrival time between two consecutive floods based on a specific type of stochastic distributions and processes.
Abstract—The paper proposes an approach for modeling inter-arrival time of floods. It is shown that the inter-arrival time between floods can be modeled by a newly proposed type of distribution called ST distributions. The corresponding stochastic point process registering the appearances of the floods is called ST process. ST distribution and process are defined and their application to modeling flood appearances is demonstrated. The proposed approach is applied for modeling inter-arrival time between two consecutive floods based on a specific type of stochastic distributions and processes. Index Terms—Natural disasters risk, flood, ST distribution, ST process.
I. INTRODUCTION United Nations International Strategy for Disaster Reduction defines risk of natural disaster as “a potentially damaging phenomenon that may lead to loss of life or injury, property damage, social and economic disruption or environmental degradation”. Each hazard is characterized by location, intensity, frequency and probability. It is interesting to study inter-arrival time between two disasters in a vulnerable geographic area [1]. Directive 2007/60/EC of the European Parliament and of the Council of 23 October 2007 on the assessment and management of flood risks (Floods Directive – FD) provides for drafting of Flood risk management plans (FRMPs) for each river basin management region in EU member countries. [2]. Floods have the potential to cause fatalities, displacement of people and damage to the environment, to severely compromise economic development and to undermine the economic activities of the Community. Floods are natural phenomena which cannot be prevented. However, some human activities and climate change contribute to an increase in the likelihood and adverse impacts of flood events. It is feasible and desirable to reduce the risk of adverse consequences, especially for human health and life, the environment, cultural heritage, economic activity and infrastructure associated with floods [3]. It is interesting to study inter-arrival time between two
II. DEFINITION OF ST FAMILY OF DISTRIBUTIONS In this study, a random variable with probability mass function f (x) has distribution of ST (n, ) family and this fact is denoted ST (n, ), if the probability mass function of is given by the formula:
n1 n n P( D k ) f ( x | D k ) k 1 n1 f ( x ) P( D n k ) f G k ( x), x 0 , k 1 0, x 0.
where G k are random variables with probability mass function f Gk ( x) f (k , ) and D n are positive integer mixing random variables. Here for G k different families of distributions are adopted. The case of ST family of first kind is considered when
1 1 G k (k , ) Erlang (k , ), Manuscript received May 24, 2015; revised July 28, 2015. This work was supported in part by the Bulgarian National Science Fund for the support under the Grant No. DFNI-I02/ 15 from 2014. P. Stoynov is with the Sofia University St. Kl. Ohridski, Bulgaria (e-mail:
[email protected]). P. Zlateva is with the ISER, Bulgarian Academy of Sciences, Sofia 1113, Bl. 2, Bulgaria (e-mail:
[email protected]). D. Velev is with the University of National and World Economy, Sofia 1700, Bulgaria (e-mail:
[email protected]).
DOI: 10.7763/IJIMT.2015.V6.613
i.e.
1 | D n Erlang ( D n , ). Correspondingly, D n is a random variable, taking values k 1,, (n 1) with probabilities: 267
International Journal of Innovation, Management and Technology, Vol. 6, No. 4, August 2015
P( D n k )
C (n, )n! (n k 1)! k
, k 1,, (n 1) ,
C (n, )e x (1 x) n C (n, )e x
I (0, )
n
k x
k
k 0
where the coefficients C (n, ) are given by the formulas:
C (n, )
n
n
n
C (n, ) k x e
k x
k 0 n
1 , I (n, )
1 ,
C (n, )n! x k e x k!(n k )! k 0
n
C (n, )n! k 1 x k e x
k 0
k 1 (n k )! k!
C (n, )n! k 1 x k e x k 1 k! (n k )! k 0 n
1 n I (n, ) I (n 1, ), n 1,2,
n
~ Also, variables D n D n 1 can be introduced taking values k 0,, n with probabilities
P( D k 0 n 1
C (n, )n! ~ P( D n k ) k 1 , k 0,, n. (n k )!
n 1
k 1 n 1
n ~n ~n P( D k ) f ( x | D k ) k 0 n ~ f ( x ) P( D n k ) f G k 1 ( x), x 0 k 0 0, x 0.
k
C (n, )n!
k x k 1e x k (n k 1)! (k 1)! C (n, )n!
P( D k 1
(n k 1)! (k 1)!
k x k 1e x k (k ) k 1 ( n k 1)!
n 1
presented also by the formula
k 1) f G k 1 ( x)
C (n, )n! k x k 1e x
k 1
Then the probability mass function f (x) of can be
n
n
k ) f G k ( x).
So, the proof is completed. The distribution ST1(n, ) can be considered as a special kind of generalized gamma distribution [4]. It is said that a random variable has generalized gamma distribution if its probability density function is given by
If a random variable has ST distribution of first kind, this fact is denoted as ST1(n, ).
f ( x)
In the case when D n k , i.e.
u s ()U (, 1 s, u) ,
e x x 1 (u x) s , x 0
P( D n k ) 1, P( D n i) 0,
where s , 0, 0, u 0 and
1 i k 1 k 1 i n 1,
which may be considered as degenerate ST distribution of first kind, Erlang distribution is actually obtained, i.e.
U (a, b, z )
1 e zt t a 1 (1 t )b a 1 dt , (a) 0
a 0, z 0
1 Erlang (k , ).
is the integral representation of the hyper-geometric function of second kind [7]. In this case, for can be written G (, , u, s).
The following theorem holds: Theorem 1. Let ST1(n, ). Then its probability mass
It is necessary to remember that the random variable has
function can be presented as
C (n, )e f ( x) 0, x 0
a gamma distribution and denote (, ), if its x
(1 x) , x 0 . n
probability mass function is given by
1 x x e ,x0 f ( x ) ( ) . 0, x 0
Proof: The probability density can be represented as:
268
International Journal of Innovation, Management and Technology, Vol. 6, No. 4, August 2015
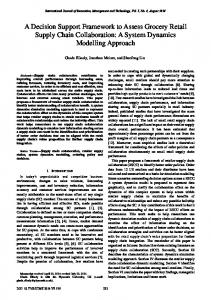
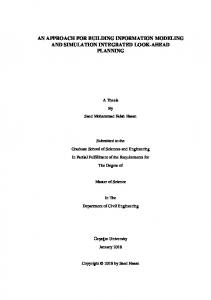
The graphics for the case n 100 and 2 is given in Fig. 1. The graphics for the case n 40 and 2 is given in
Here () is defined by
() x 1e x dx.
Fig. 2.
0
So, (, ) G (, , u, s 0).
IV. DEFINITION OF ST PROCESSES The process X (t ) is a ST process of first kind or ST1(n, ) process, and this fact is denoted as
Actually, it is obtained that
ST1(n, ) G ( 1, , u 1, s n).
X (t ) ST1(t; n, ), if for it:
Another generalization of ST1(n, ) distribution is presented in [5]. The exponential distribution is a special kind of ST1(n, )
1) X (0) 0. 2) X (t ) is pure jump process with jumps at times
Ti ' , i 1,2, and jump sizes
distribution and ST1(0, ) Exp () . To recall that the random variable has exponential
X (Ti ) 1.
distribution and this is denoted Exp ( ), if its probability mass function is given by
3) The intervals between two jumps are i Ti Ti 1 ST1(n 1, ), i 0,1,, T0 0.
e x , x 0 f ( x) 0, x 0.
The process X (t ) is compound ST1(n, ) process if condition 3) is replaced by condition: 3’) X (t ) is pure jump process with jumps at times
The case ST1(1, ) Lindley() can be considered as a weighted version of exponential distribution with weighting function w( x) 1 x. The random variable has Lindley
Ti , i 1,2, and jump sizes X (Ti ) Yi , where the variables Yi , i 1,2, are independent and identically distributed random variables.
distribution and this is denoted Lin(), if its probability mass function is given by
2 (1 x)e x , x 0 f ( x) 1 . 0, x 0 The case n 2 leads to ST1(2, ) distribution which can be defined as weighted exponential distribution by the weight function w( x) (1 x) 2 .
Fig. 1. The graphics of ST1(n, ) distribution for the case n 100 and 2 .
The random variable has ST1(2, ) distribution and this fact is denoted ST1(2, ), if its probability mass function is given by
3 ex (1 x) 2 , x 0 2 f ( x) 2 2 0, x 0. To check that the weight function in the definition of the distribution is the right one, it can be shown that
Ew()
2 2 2 2
Fig. 2. The graphics of ST1(n, ) distribution for the case n 40 and 2 .
.
V. SIMULATION OF ST PROCESSES III. SIMULATION OF ST DISTRIBUTION The
simulation
of
ST1(n, )
distribution
To make simulation of ST (n, ) process, the following and
algorithm can be applied:
corresponding PMF graphics for different values of the parameters n and can be done by using R language.
1. Define interval [0, T ] of the simulation.
269
International Journal of Innovation, Management and Technology, Vol. 6, No. 4, August 2015
2. Set k 0.
The floods are two types. The first type is “surface waves”. They are sea floods caused by storm and tides, or river floods caused by the heavy release of water either through snow or ice melting or heavy rain. Another type of sea surface waves is “freak waves”. They are explained by spatial and temporal interference, and are defined as being at least three times the size of an average storm wave. In contrast to surface waves, tsunamis are deep-sea waves caused by under-sea earthquakes. They have a great wave length and wave speed, and usually are not noticeable at sea. However, at coastal regions, they can cause great damage. In this section, it is demonstrated how ST processes can be used to model the point process of occurrence of surface wave floods. It is supposed that there are two types of events related to floods. The first type is “condition for floods”. The process which counts number of appearances of this kind of events is Poisson with parameter . The second kind of events are
k
3. While
T i
do:
i 1
3.1. Set k k 1 3.2. Generate
k ST1(n 1, ) (k ST 2(n 1, ), k ST 3(n 1, )).
3.3. Set Yk 1 for standard ST (n, ) process or simulate Y based on a given distribution f for compound
ST (n, ) process. Then the trajectory of X (t ) ST (t; n, ) is given by the formula N (t )
X (t )
Y , i
i 1
called “real flood”. It can be modeled by process t ST1(n [ max ], ) where t max is the maximal and t min - the tmin
where
N (t )
1
{Ti T }.
minimal observed interval between two major floods in a country (area, region) and [.] is the integer part of a number.
i
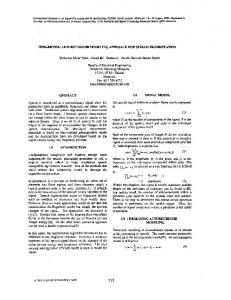
This kind of processes are considered and simulated in [6] where also the R code for simulation is presented. The graphics of a trajectory of ST1(n, ) process for the
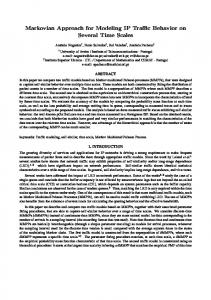
This approach can be illustrated with data about floods caused by river Elbe presented in the below table. 1 So, it can be estimated that 15.
case n 6 and 0.1 is given in Fig. 3.
Also, n [
VI. A PROPOSAL FOR MODELING FLOODS ARRIVALS BY ST PROCESSES
tmax 154 ] 10 and the realizations of the tmin 14
random variables Din are as shown in Table I.
Floods are one of the biggest natural hazards in terms of fatalities. Probably the biggest natural disaster ever was the Henan Flood in China in 1887 with between 900 000 and 1.5 million victims [8]. The flood in summer 2002 in Central Europe was probably the costliest European natural disaster over. First estimation ranged from 20 to 100 billion euro.
TABLE I: HISTORICAL MAXIMUM WATER LEVELS OF THE RIVER ELBE AT DRESDEN [9] Water level (m)
Volume (m3/s)
Time interval (years)
Din
16 August 1501
8,57
5,0
154
10
7 February 1655
8,38
4,8
129
9
1 March 1784
8,57
5,2
15
1
24 February 1799
8,24
4,4
31
2
2 March 1830
7,96
3,95
15
1
31 March 1845
8,77
5,70
17
1
3 February 1862
8,24
4,493
14
1
20 February 1876
7,76
3,286
14
1
7 September 1890
8,37
4,35
50
3
17 March 1940
7,78
3,36
62
4
17 August 2002
9,4
4,7
-
Date
Fig. 3. The graphics of ST1(n, ) distribution for the case n 6 and 0.1 .
Historical data of floods in Europe have shown that floods are correlated. In fact, so called “time clusters” could be found. There exist several theories to describe such effects, for example climate cycles or the fatigue of the water storage capacity of a landscape after a flood. Therefore, the next flood can occur even with a lower water supply.
VII. CONCLUSION ST distributions presented in the article posses some suitable properties for modeling process of arrival of floods. The present work may be extended by studying other choices of G k . 270
International Journal of Innovation, Management and Technology, Vol. 6, No. 4, August 2015
For example, it is possible to choose G k NB(k , е ). In
[7]
this case, | D n NB( D n , е ) and ST 2(n, ) distribution is obtained.
[8]
As another example, the random variable G k k (x) can
[9]
be considered which takes value
k with probability one.
Then D D (). In this case, that random variable n
n
H. Zamani and N. Ismail, “Negative binomial-Lindley distribution and its applications,” Journal of Mathematics and Statistics, vol. 6, no. 1, pp. 4-9, 2010. D. Proske, Catalogue of Risks, Natural, Technical, Social and Health Risks, Springer, 2008. D. Fischer, “Jahrhundert-Hochchwasser oder drastische Klimaveranderung,” in Als den Lowen das Wasser bis zum Rachen stand. Elbhang-Photo-Galerie, F. D. Dresden and J. Frohse Eds., 2003, pp. 71-75.
has ST 3(n, ) distribution and this fact is denoted Pavel Stoynov has graduated at the Sofia University St. Kl. Ohridski, Sofia, Bulgaria. Currently he is an assistant professor at the Faculty of Business and Administration of Sofia University St. Kl. Ohridski. His research interests are in the field of mathematics, economics, geosciences, information technologies and statistics. He is a member of AMS and Bulgarian Statistical Society.
ST 3(n, ). These processes with suitable parameters can also be used to model times of occurrence of floods. The model can also be used to model arrivals of other natural hazards. ACKNOWLEDGMENT The authors express their gratitude to the Bulgarian National Science Fund for financial support under the Grant No. DFNI-I02/ 15 from 2014, titled "Information System for Integrated Risk Assessment from Natural Hazards".
Plamena Zlateva is currently an associate professor at the Institute of System Engineering and Robotics at the Bulgarian Academy of Sciences, Sofia, Bulgaria. She holds the M.Sc. degrees in applied mathematics from the Sofia Technical University and in economics from the Sofia University St. Kl. Ohridski, and the Ph.D. degree in manufacturing automation from the Institute of Conrol and System Research - BAS.
REFERENCES [1]
[2]
[3]
[4]
[5]
[6]
United Nations International Strategy for Disaster Reduction. (2009). [Online]. Available: http://www.unisdr.org/files/ 7817_UNISDRTerminologyEnglish.pdf A European Flood Action Programme. European Commission. [Online]. Available: http://ec.europa.eu/environment/water/flood_risk/key_docs.htm Directive 2007/60/EC of the European Parliament and of the Council of 23 October 2007 on the assessment and management of flood risks. [Online]. Available: http://eur-lex.europa.eu/legal-content/EN/TXT/PDF/?uri=CELEX:32 007L0060&from=EN P. Stoynov, “Mixed negative binomial distribution by weighted gamma mixing distribution,” in Proc. the Fortieth Spring conference of the Union of Bulgarian Mathematicians, Borovets, Bulgaria, 5-9 April, 2011, pp. 327-331. P. Stoynov, “Some properties of a special class generalized Stoynov distributions,” in Proc. the International Conference Financial and Actuarial Mathematics, Sofia, Bulgaria, 2012, pp. 102-106. P. Stoynov, “Stoynov process – Definition and simulations,” in Proc. the International Conference Financial and Actuarial Mathematics, Sofia, Bulgaria, 2013, pp. 97-104.
Her main areas of academic and research interest are control theory, mathematical modeling and system identification, risk management.
Dimiter Velev is a professor in the Department of Information Technologies and Communications at the University of National and World Economy, Sofia, Bulgaria. He holds the M.Sc. degree in electroengineering from the Sofia Technical University, Bulgaria and the Ph.D. degree in engineering sciences from the Institute of Modeling Problems in power engineering at the National Academy of Sciences of Ukraine, Kiev, Ukraine. His main areas of academic and research interest are internet-based business systems modeling and development, service oriented architectures, online social networks, cloud computing, web applications development and programming. His lectures cover such disciplines.
271