ple of the use of this model by simulating T-Wave Alternans. (TWA). The magnitude of the TWA effect is modeled as a disturbance on the T-loop of the dipole with ...
An Artificial Multi-Channel Model for Generating Abnormal Electrocardiographic Rhythms GD Clifford1,2 , S Nemati2 , R Sameni3,4 1
Harvard-MIT Division of Health Sciences and Technology (HST), Cambridge, MA 02142, USA 2 Massachusetts Institute of Technology (MIT), Cambridge, MA 02139, USA 3 Biomedical Signal and Image Processing Laboratory (BiSIPL), School of Electrical Engineering, Sharif University of Technology, PO Box 11365-9363, Tehran, Iran 4 Laboratoire des Images et des Signaux (LIS), CNRS-UMR 5083, INPG, Grenoble, France Abstract
TWA to be associated with a critical HR-related activation level is simulated. Finally, to generate multi-lead signals, the VCG is mapped to any set of clinical leads using a Dower-like transform derived from a least-squares optimization between known VCGs and known lead morphologies. ECGs with calibrated amounts of TWA were generated by this model and included in the PhysioNet/CinC Challenge 2008 data set.
We present generalizations of our previously published artificial models for generating multi-channel ECG so that the simulation of abnormal rhythms is possible. Using a three-dimensional vectorcardiogram (VCG) formulation, we generate the normal cardiac dipole for a patient using a sum of Gaussian kernels, fitted to real VCG recordings. Abnormal beats are then specified either as new dipoles, or as perturbations of the existing dipole. Switching between normal and abnormal beat types is achieved using a hidden Markov model (HMM). Probability transitions can be learned from real data or modeled by coupling to heart rate and sympathovagal balance. Natural morphology changes form beat-to-beat are incorporated as before from varying the angular frequency of the dipole as a function of the inter-beat (RR) interval. The RR interval time series is generated using our previously described model whereby time-and frequency-domain heart rate (HR) and heart rate variability (HRV) characteristics can be specified. QT-HR hysteresis is simulated by coupling the Gaussian kernels associated with the T-wave in the model with a nonlinear factor related to the local HR (determined from the last n RR intervals). Morphology changes due to respiration are simulated by coupling the RR interval to the angular frequency of the dipole. We demonstrate an example of the use of this model by simulating T-Wave Alternans (TWA). The magnitude of the TWA effect is modeled as a disturbance on the T-loop of the dipole with a magnitude that differs in each of the three VCG planes. The effect is then turned on or off using a HMM. The values of the transition matrix are determined by the local heart rate, such that when the HR ramps up towards 100 BPM, the probability of observing a TWA effect rapidly but smoothly increases. In this way, no ‘sudden’ switching from nonTWA to TWA is observed, and the natural tendency for
ISSN 0276−6574
1.
Introduction
This article presents an extension of our previously described multi-lead ECG model [1], [2], [3] [4] to simulate the morphological dynamics of abnormal rhythms. The motivation for this model was to provide a set of standard signals for the ninth annual PhysioNet/Computers in Cardiology Challenge (PCinCC) [5], which aims to improve understanding of methods for identification and analysis of ECG T-wave alternans (TWA).
2.
Methods
2.1.
Dynamic VCG model
Following [1], [2], [3] and [4], the dynamic model for the d(t) dipole vector is given by: θ˙ = ω x˙ = − y˙ = − z˙ = −
773
X αx γω
(∆θix )2 ∆θix exp[− ] x 2 (bi ) 2(bxi )2 (∆θiy )2 αiy γω y ∆θ exp[− ] i (byi )2 2(byi )2 αiz γω z (∆θiz )2 ∆θ exp[− ] i (bzi )2 2(bzi )2 i
i
X i
X i
(1)
Computers in Cardiology 2008;35:773−776.
where ∆θix = (θ−θix )mod(2π), ∆θiy = (θ−θiy )mod(2π), ∆θiz = (θ−θiz )mod(2π), and ω = 2πf , where 60/f √ is the instantaneous (beat-to-beat) heart rate and γ = 1/ fav is a dimensionless Bazett-like correction where fav is the mean of the last n beats, typically with n = 6. The first equation in Eq. (1) generates a circular trajectory rotating with the frequency of the heart rate. Each of the three coordinates of the dipole vector d(t), is modeled by a summation of Gaussian functions with the amplitudes of αix , αiy , and αiz ; widths of bxi , byi , and bzi ; and located at the rotational angles of θix , θiy , and θiz . The VCG is then generated by V CG(t) = H · R · Λ · s(t) + W (t) where V CG(t)N ×1 is a vector of the ECG channels recorded from N leads, s(t)3×1 = [x(t), y(t), z(t)]T contains the three components of the dipole vector d(t), HN ×3 corresponds to the body volume conductor model (as for the Dower transformation matrix [6]), Λ3×3 = diag(λx , λy , λz ) is a diagonal matrix corresponding to the scaling of the dipole in each of the x, y, and z directions, R3×3 is the rotation matrix for the dipole vector, and W (t)N ×1 is the noise in each of the N ECG channels at the time instance of t. Note that H, R, and Λ matrices are generally functions of time.
2.2.
2.4.
HMM state transition matrix for TWA HR dependence
The transition from one beat type to another is determined by a state transition matrix (STM), ST M = [p1 p2 ; p3 p4 ], (1 ≥ p1 , p2 , p3 , p4 , ≥ 0). For this application we chose a symmetric formulation, ST M = [ 1 − p p ; p 1 − p ], so that the probability of transition of normal to abnormal best is the same as the probability of transition from abnormal to normal. For stationary continuous TWA, p = 1 and for sinus rhythm, p = 0. More generally, the STM has the same rank as the number of beat types. To simulate the dependence on HR of the TWA effect, we modified p so that p = tanh((h−hT W A +r)/5) where h is the instantaneous heart rate, hT W A = 95 BPM is the HR at which the TWA effect manifests, with a random ±5 BPM offset at the point at which TWA begins to manifest (r = 10χ − 5). Figure 1 illustrates an example of instantaneous heart rate and resultant probability of transition to TWA derived form such a procedure. Note that as the instantaneous heart rate rises above 110 BPM, the transition probability saturates to unity (corresponding to continuous stationary TWA).
Generating the RR time series
The RR interval time series (which forms the input for ω in Eq. (1)) is generated as per [1], to last 300 seconds, with a baseline heart rate of 110 BPM, a standard deviation of 5 BPM, and an LF/HF-ratio of 2 (see [1]). To simulate a sudden, but realistic change in heart rate, we apply a tanh ramp function to the time series, with a magnitude equal to hr = hb + (χ − 12 )ho , where hb = 23 BPM, ho = 6 and χ is a random number uniformly distributed between 0 and 1. The ramp is then given by hr = hr (tanh(t) + 1)/2 + M30χ , where M = |hr (tanh(t) + 1)/2|max . A randomly-seeded HR time series, h, is then generated according to [1], to which the ramp hr is added.
2.3.
VCG generation; normal and abnormal beats
Figure 1. Example of instantaneous heart rate and resultant probability of transition to TWA.
The VCG is generated by Eq. 1 and with a sampling frequency of 500 Hz. Abnormal beats (every second beat in the TWA time series) can be generated by adding an offset of ν µV to the 11th Gaussian amplitude (α11 ). However, for the data in the PCinCC the αi were modified to ναi for i = 9, 10 and 11. ν is generally a 3-dimensional quantity corresponding to each of the three VCG planes (Vx, Vy and Vz). To mimic the observation by Mart´ınez et al. [7] that there is a preferred plane of TWA activity, we arbitrarily forced the scaling to be different in each plane (ν x = ν z /2 = ν z /3). Thirteen different levels of TWA activity were then generated (1µV ≤ ν ≤ 40µV ).
2.5.
Generation of full 12-lead ECG
To generate five different artificial ‘patients’, we used the model parameters in [4] and derived a set of five individual Dower transforms (IDTs) [6] using the the first five patients in the Physikalisch-Technische Bundesanstalt Diagnostic ECG Database (PTBDB) [8, 9]. The PTBDB, consists of 549 records from 290 subjects with 15 simultaneously measured signals: the conventional 12 leads (I,
774
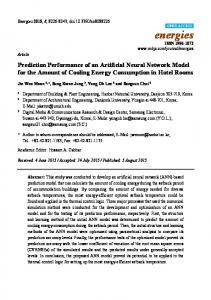
Figure 2. Example of 12 lead ECG after application of IDT.
VCG from which this 12 lead example is derived (using a patient-specific IDT) is illustrated in figure 3. Figure 4 illustrates the ‘ABAB’ phenomenon of the resulting TWA effect with an amplitude of 23 µV .
II, III, AVR, AVL, AVF, V1, V2, V3, V4, V5, V6) together with the 3 Frank lead ECGs (Vx, Vy, Vz). The individual (3 by 12) Dower-like matrix is derived by a nonlinear least square optimization fit [10] between the VCG and the 12 leads, using the first 10 seconds of each patient. Although such a method ignores the changes in the IDT from beat to beat due to respiration, morphological changes due to respiration are already accounted for in the model, using a Bazett-like correction [1] to the Gaussian parameters. Application of each IDT to the VCG, together with randomized seeds for the RR interval generation provides 12 lead ECG for the five different patients.
3.
4.
Discussion and conclusions
The dynamic model presented in this article if fully generalizable, using an optimization procedure to fit the VCG to any given subject or observation to an arbitrary level of accuracy. Each beat class can be fitted to real examples separately, and the probability transition matrix that determines how likely it is for one beat type to follow another can be derived from empirical studies of known databases. The STM is coupled to heart rate, but can also be coupled to autonomic tone, sleep state or any other relevant input parameter. Therefore, abnormal beats such as ectopy can be simulated by using new beat classes (fitted in the same manner as the derivation of the IDT), and adding an appropriate shortening of the associated RR interval. Each new beat class increases the rank of the STM by one. An appropriate transition probability between this new beat and
Results
In order to evaluate our simulator we used visual inspection to empirically verify the TWA amplitudes with no QT variation. In tests we generated TWA amplitudes of 2, 3, 4, 5, 6, 7, 8, 10, 11, 12, 20, 30 and 40 µV for each of the five artificial patients. The generated 12 lead ECG for one of the realizations of this model is illustrated in figure 2 and the corresponding
775
in an accompanying paper [12].
Acknowledgements The authors were supported by the U.S. National Institute of Biomedical Imaging and Bioengineering (NIBIB) and the National Institutes of Health (NIH) (grant number R01 EB001659), the NIH Research Resource for Complex Physiologic Signals (grant number U01EB008577), and the Information and Communication University (ICU), Korea. The content of this article is solely the responsibility of the authors and does not necessarily represent the official views of the NIBIB, the NIH or ICU Korea.
References [1]
McSharry PE, Clifford GD, Tarassenko L. A dynamical model for generating synthetic electrocardiogram signals. IEEE Trans Biomed Eng 2003;50(3):289–294. [2] Clifford GD, Shoeb A, McSharry PE, Janz BA. Modelbased filtering, compression and classification of the ECG. Int J Bioelectromag 2005;7(1):158–161. [3] Clifford GD. A novel framework for signal representation and source separation. Journal of Biological Systems June 2006;14(2):169–183. [4] Sameni R, Clifford GD, Shamsollahi MB, Jutten C. Multichannel ECG and noise modeling: application to maternal and fetal ECG signals. EURASIP Journal on Advances in Signal Processing 2007;2007(43407):1–14. [5] Moody GB. The Physionet / Computers in Cardiology Challenge 2008: T-wave alternans. Computers in Cardiology September 2008;35. In Press. [6] Dower GE, Machado HB, Osborne JA. On deriving the electrocardiogram from vectorcardiographic leads. Clin Cardiol 1980;3:87. [7] Mart´ınez JP, Olmos S. Methodological principles of T wave alternans analysis: a unified framework. Biomedical Engineering IEEE Transactions on April 2005;52(4):599–613. [8] Bousseljot R, Kreiseler D, Schnabel A. Nutzung der EKGSignaldatenbank CARDIODAT der PTB uber das Internet. Biomedizinische Technik 1995;40(1):S317–S318. [9] Kreiseler D, Bousseljot R. Automatisierte EKGAuswertung mit hilfe der EKG-Signaldatenbank CARDIODAT der PTB. Biomedizinische Technik 1995;40(1):S319– S320. [10] Marquardt DW. An algorithm for least-squares estimation of nonlinear parameters. SIAM Journal on Applied Mathematics 1963;11(2):431–441. [11] Clifford GD, Villarroel M. Model-based determination of QT intervals. Computers in Cardiology 2006;33:357–360. [12] Khaustov A, Nemati S, Clifford GD. An open-source standard T-wave alternans detector for benchmarking. Computers in Cardiology September 2008;35. In Press.
Figure 3. Example of VCG generated by model.
Figure 4. Typical alternating ‘ABAB’ TWA pattern (with 23 µV amplitude) generated from our model.
other beat classes can be derived by training the HMM on real databases. Since our model employs a dipole representation, with an individual Dower-like transform to map the dipole onto clinical observational axes (such as the standard 12 lead ECG), correlated noise can be added in multiple dimensions, and hence can manifest in a realistic manner on all observational ECG leads. Multiple noise sources can be treated as other dipole moments in the model, and the relative motions of sources and sensors can be simulated using a Givens rotation matrix to multiply the IDT [4]. Finally, clinical features of the simulated signal can be extracted directly from the model [11]. An open source TWA detection algorithm developed for PCinCC, which was evaluated on this model, is described
Address for correspondence: Gari D. Clifford, M.I.T., 77 Massachusetts Av., Cambridge, MA 02139, USA
776