An Assessment of Differences in Algorithms For Computing Fundamental Topographic Parameters Su Jin Lee and Keith C. Clarke* Department of Geography, University of California Santa Barbara. *
[email protected]. Abstract:
The extraction of fundamental topographic parameters from digital elevation models (DEMs) is a common procedure in terrain analysis. Research to date has identified a set of derived parameters that in themselves are nearly complete descriptors of surface form, and that are highly correlated to surface structure. Different algorithms for calculating these fundamental topographic parameters from a DEM have been derived. Each makes assumptions about how surface properties should be calculated, and so produces different results when executed. This work assessed the method-derived differences among algorithms for computing fundamental topographic parameters. We used DEMs of 3m, 30m, and 90m resolutions covering Santa Barbara, CA. We assessed the quantity and location of the algorithmic differences between methods for computing aspect, slope, curvature, and flow. These were programmed from first principles into the MATLAB package. We analyzed aggregate surface mean, minimum, maximum, standard deviation, and variance. We also mapped the error, to characterize the magnitude of the differences in terms of terrain properties, and then examined them for scale dependences. The study permits conclusions about choice of method for the attainment of less overall, and more predictably located, error when terrain properties are computed for GIS-based terrain analyses.
KEYWORDS: Topography, digital elevation model, fundamental parameters, Matlab. Introduction An extraordinary amount of detailed data about the terrain surface of the earth has become available in the last few decades. The increasing availability of higher resolution and more timely digital elevation data force us to devote attention to terrain surface generalization. How can all of these DEMs be reduced from mere digits and map tiles to terrain constructs of use in the interpretation of the earth’s form and its surface processes? The issue is not that of cartographic generalization, itself the source of volumes of research, but of terrain syntax and even semantics. For example, are there common shapes and forms into which all natural and human-made features on the earth’s surface fall? The human mind can quickly reason from a contour loop with hachures to an enclosed depression and so to a karst sink-hole. The automated cartographic challenge is to have a computer follow the same detection-identification-explanation sequence as the trained geographer. The raw elevation data need to be automatically organized into features related to the land surface and its terrain structure, not structures imposed by data collection and storage. Only through building automated computational solutions to terrain abstraction can we deal with the rapidity with which new data can be captured. To advance our knowledge of terrain syntax and semantics requires a comprehensive understanding of the fundamental parameters of topography (Evans, 1998). The fundamental parameters are the set of metric descriptors computable from any terrain data structure at any point on a surface that fully and completely describe the relations between that point and the overall surface. This includes both simple metrics, such as 1
derivatives, and the more complex terrain structure or skeleton, which may involve a recursive sub-division of the surface into line and area features such as slope facets, ridges, break-lines, and drainage features. A truly versatile terrain model would apply to all features on the earths surface, be they large scale geomorphological, at the scale of the drainage basin, or influenced by human action and construction. The fundamental topographic parameters should be computable from any of the GIS surface models: the square grid, the Triangulated Irregular Network, and the contourbased network (Wilson and Gallant, 2000), or indeed any possible surface abstraction. Nevertheless, the majority of the literature is heavily focused on the DEM and methods for computing from the grid. Moore et al. (1991) generated a list of parameters, which Wilson and Gallant (2000) summarized in a table. The table lists eighteen parameters: elevation, upslope height, aspect, slope, upslope slope, dispersal slope, catchment slope, upslope area, dispersal area, catchment area, specific catchment area, flow path length, upslope length, dispersal length, catchment length, profile curvature, plan curvature, tangential curvature, and elevation percentile. There is clearly correlation among these parameters, and we argue that elevation, slope, aspect, slope curvature, downslope direction and downslope accumulation are sufficient to characterize terrain. In and of themselves, these parameters are almost completely descriptive of surface form sufficient for a vast number of terrain analysis applications (Moore et al., 1991). Yet agreement on which fundamental topographic parameters are indeed fundamental is trivial compared to differences created by what might be termed method-induced error. Wilson and Gallant’s standardization of the formulae for the parameters (Wilson and Gallant, 2000), and the widespread availability of computer code for their computation though packages such as TAPES-G, have led to the incorporation of some or many of the parameters into GIS and other analytical software packages. However, the devil is often in the details, and the exact assumptions, computation methods, and handling of numerical error can make a huge difference in mapped and computed terrain values. The question posed in this study is: what differences in the computation of fundamental terrain parameters are the product of method-induced error, and how is that error manifested spatially, quantitatively and across spatial scales? Our goal is to sufficiently compute and describe the error for the same piece of terrain at three different spatial resolutions, to compare the computed parameters across methods, and to make recommendations about which algorithms to use to compute each parameter at different map scales. To implement this goal, we have coded selected algorithms from Wilson and Gallant (2000) in the MATLAB mathematical analysis package, and used the result to conduct an exhaustive cross-algorithm analysis for three nested DEMs. In the following discussion, we start by reviewing prior work on the computation of fundamental topographic parameters, and then discuss the subset of methods that were implemented in MATLAB. A major computational challenge, the treatment of enclosed depressions by the algorithms, is discussed separately. We then describe the data sets used, and the results, analyzed across algorithm type (slope/aspect, slope curvature, and downslope measures) and by scale. The differences between the solutions are mapped for statistical and visual comparison, and conclusions are drawn. We conclude with a summary of recommendations for how to proceed with computing the fundamental topographic parameters from an unknown terrain sample at known scale and surface complexity.
2
Research on Topographic Structure Terrain parameters such as slope gradient and orientation of slope (aspect) are important controls in many surface processes (Moore et al. 1993). O’Callaghan (1983) judged that the extraction of drainage networks from digital elevation data is critical for quantitative studies in geomorphology and hydrology, including sedimentary processes (Zevenbergen and Thorne, 1987). Early work on terrain description centered on the four topographic indices of slope, aspect, profile curvature and plan curvature (Evans, 1980). These topographic parameters are related to the central point of a 3 x 3 window within the DEM (Zevenbergen and Thorne, 1987). Douglas (1986) extended the research to develop methods to define ridges, channels, watersheds, and other hydrologic features from DEMs. Jenson and Domingue (1988) then devised methods to compute flow direction and flow accumulation. The flow direction for a cell is the direction in which water will flow out of the cell. It is encoded using a numbering convention to correspond with the center cell of a 3 x 3 neighborhood (figure 1). Speight (1974) described over twenty topographic attributes that can be used to describe the land surface form. A series of hydrologic topographic attributes was then adapted from the list (Speight 1974, 1980). Lea (1993) presented an aspect-driven kinematic routing algorithm. The algorithm is based on calculation of the aspect vector. This routing algorithm models flow moving kinematically from a point source at the center of the source pixel until it reaches a perimeter point on the cell boundary. In this study we adopted Lea’s algorithm, but instead of a perimeter point we used a hollow point. In terms of tools for terrain analysis, Costa-Cabral and Burges presented the DEMON (Digital Elevation Model Networks) model (Costa-Cabral and Burges, 1994). Gallant and Wilson (1996) followed with TAPES-G, a grid-based terrain analysis program that computes slope, aspect, profile curvature, and plan curvature and several other topographic attributes for each cell of a squared-grid DEM. Wide availability of these tools has served to increase interest in and ability to compute measures of accuracy for terrain analysis algorithms. Computing the Fundamental Parameters from DEMs In the work reported on here, we chose to implement the computation of the fundamental topographic parameters from first principles, using formulae and heuristics described in the published literature rather than simply using one of the terrain analysis packages. To do so, we implemented the algorithms in MATLAB, a technical language for scientists. MATLAB is convenient for handling matrices, and DEMs have long been treated mathematically as matrices (Tobler, 1968). Prior to creating a simple ASCII file of elevations as {x, y, z} records of the array sizes listed in Table 2, however, the maps were reprojected to a common map projection and datum (NAD83 on UTM). We applied MATLAB programs that computed the fundamental topographic parameter using algorithms selected from Wilson and Gallant’s list (Wilson and Gallant, 2000, p. 31). We chose three basic types of algorithm: slope and aspect, slope curvature, and downslope flow direction and accumulation.
3
Slope and Aspect Algorithms Various slope and aspect algorithms are defined by the equations included in Table 1. In all cases, we refer to the gridded case and the simple 8-cell or Moore neighborhood, as shown in figure 1, with clockwise cell numbering that is unit indexed starting from the north-east. Z7
Z8
Z1
Z6
Z9
Z2
Z5
Z4
Z3
Figure 1. 3 X 3 window showing cell numbering.
Topographic slope is the first derivative of elevation, given as the rise in elevation over the run in distance and obviously impacted by direction. In general, assuming angles clockwise from north in degrees, and Zx representing east-west and Zy representing north-south gradients:
Slope = arctan( Z 2 x + Z 2 y ) Aspect = 180o − arctan(
Zy Zx ) + 90o ( ) Zx | Zx |
(eq. 1) (eq. 2)
We define the horizontal resolution as h, and chose the following algorithms from the Wilson and Gallant list (Table 1). The algorithms are named using the Wilson and Gallant TAPES-G labels. Algorithm 2FD is the Second-order Finite Difference method (Fleming and Hoffer, 1979; Zevenbergen and Thorne, 1987; Ritter 1987). This algorithm deals only with the principal compass directions, and normalizes the slope vector between them. The 3FD algorithm is similar, termed the third-order Finite Difference (Sharpnack and Akin, 1969; Horn, 1981; Wood, 1996). This algorithm takes an average of the three vertical and horizontal cross vectors, ignoring the center grid cell in each case, and again normalizing the vector for X and Y. This algorithm is likely to be more smooth than 2FD, since it is an average over more samples. A modification of this method is the 3FDWRD or third-order Finite Difference Weighted by Reciprocal of Distance (Unwin, 1981). This method is the same as 3FD, but double-counts the vertical and horizontal profile running through the kernel cell, simulating a distance-decay effect. A further modification uses squared distance weighting, computing the third-order Finite Difference Weighted by Reciprocal of Squared Distance (3FDWRSD) (Horn, 1981). This method weights the center by twice root 2 rather than the square. The far simpler FFD (Frame Finite Difference) method (Chu and Tsai, 1995) uses the cell corners rather than the kernel profiles, but otherwise resembles 2FD. Lastly, the SIMPLE Difference (SIMPLE D or SIMPLD) method (Jones, 1998) uses only a 4 cell neighborhood, looking only west and south and using only a single cell distance. This latter method is most sensitive to local variance, but similarly suffers a bias since the north and east cells slopes are not represented. In all cases, the slope and aspect solutions are yielded from equations (1) and (2).
4
Table 1. Formulae for slope and aspect computation from a DEM
Zx
Zy
( z 2 − z6 ) 2h
2FD
Zx =
3FD
Zx=
3FDWRD
( z3 − z5 + 2( z2 − z6 ) + z1 − z7 ) Zx= 8h
Zy =
( z3 − z5 + z2 − z6 + z1 − z7 ) 6h
Zy=
( z8 − z4 ) 2h
( z7 − z5 + z8 − z4 + z1 − z3 ) 6h
Zy=
( z7 − z5 + 2( z8 − z4 ) + z1 − z3 ) 8h
Zy=
( z3 − z5 + 2 z2 − z6 + z1 − z7 )
( z7 − z5 + 2 z8 − z 4 + z1 − z3 )
4+2 2
4+2 2
3FDWRSD
Zx=
3FFD
Zx=
( z3 − z5 + z1 − z7 ) 4h
Zy=
( z7 − z5 + z1 − z3 ) 4h
SIMPLD
Zx=
( z9 − z 6 ) h
Zy=
( z9 − z 4 ) h
A Note on Hollows and Flows Various authors in terrain analysis have noted that “the horizontal and vertical resolution of most square-grid DEMs is such that that flow lines become trapped in pits and depressions (hollows) in key parts of the landscape” (Wilson and Gallant, 2000). Many proposed solutions have advocated preprocessing the DEM to eliminate these features (Jenson and Domingue, 1988; Hutchinson, 1989; Reiger, 1998). Hollows are represented by groups of cells whose aspects prevent downslope flow from escaping. This is illustrated by the three examples in figure 2. When constructing flow paths it is therefore necessary to record cells already in the flow path so that when hollows are reached, flow is prevented from moving indefinitely backwards or round and round (Lea,
5
1993). Typically, hollows are filled to the height of the next lowest cell in the eight-cell neighborhood, unless a more sophisticated tracking system is used.
Figure 2. Typical hollow cases.
Curvature Curvature attributes are based on second derivatives: the rate of change of a first derivative such as slope or aspect, usually in a particular direction. The two curvatures most frequently computed are plan (or contour) curvature, Kc, the rate of change of aspect along a contour, and profile curvature, Kp, the rate of change of slope down a flow line. Since profile curvature measures the rate of change of potential gradient, it is important for characterizing changes in flow velocity and sediment transport processes. Plan curvature measures topographic convergence and divergence and hence the propensity of water to converge as it flows across the land. Mitasova and Hofierka (1993) have suggested that tangential curvature, Kt (plan curvature multiplied by the sine of the slope angle), is more appropriate than plan curvature for studying flow convergence and divergence because it does not take on extremely large values when slope is small. The distribution of convex and concave area is the same for both plan and tangential curvature. Formulae for the three curvature values are as follows: Z xx Z 2 x + 2Z xy Z x Z y + Z yy Z 2 y Kp = 3 (eq. 3) PQ 2
Kc =
Z xx Z 2 x − 2Z xy Z x Z y + Z yy Z 2 x PQ
Kt =
3
2
(eq. 4)
Z xx Z 2 x − 2 Z xy Z x Z y + Z yy Z 2 x PQ
1
(eq. 5)
2
Using these formulae, profile curvature is negative for slope increasing downhill (convex flow profile, typically on upper slopes) and positive for slope decreasing downhill (concave, typically on lower slopes). Plan curvature is negative for diverging flow (on ridges) and positive for converging flow (in valleys) (Wilson & Gallant, 2000). Downslope Flow Flow is assumed to originate at the center of the source pixel and travel kinematically from a point source. Flow originates at the source point (SP: 2,2) and proceeds in the direction of the aspect (θ), until it reaches the next cell (Lea, 1993). For our purposes, we computed the flow direction and flow accumulation. Each of the downslope cells are affected by the aspect of the source cell, the source cell affects its adjacent rooks case neighbors (1,2), (2,3), (3,2), (2,1) as shaded zone in figure 3.
6
1,1
1,2
1,3
2,1
SP
2,3
3,1
3,2
3,3
Figure 3. 3 x 3 window for initial flow path from the center point of a pixel.
Flow within the source cell is assumed to travel from the cell center (the source point) to the outlet point (Xo,Yo). The outlet point (Xo,Yo) translates to an inlet point (Xi,Yi) on the perimeter of the neighboring pixel that shares the edge on each outlet point. If the aspect of the source pixel is 45o, 135o, 225o, or 315o, the outlet point has two adjacent cells. Flow directions and accumulations are constructed by the repeated application the algorithm. Figure 4. shows the diagram of the flow direction and flow accumulation.
Figure 4. Flow chart of downslope flow: Direction and accumulation
The Multi-Resolution Test Data
As a test dataset we sought varied data at three spatial resolutions three orders of magnitude apart that reflected both steep and flatter terrain, and that were not devoid of typical DEM artifacts. We sought areas that varied from flat to steep, and with land uses from wildland to agriculture and urban. We were also aware of the precision effect on computed aspects noted by Carter (1992), and so treated all elevations as rounded integers. A search of the Santa Barbara, California region using the National Map viewer (http://nmviewogc.cr.usgs.gov/viewer.htm) led us to DEMs for the region at 30m from the National Elevation Database (composed of mosaiced seven-and-a-half-minute DEMs) and at 90m from the Shuttle Radar Topographic Mapping mission, both with one meter vertical precision. These were chosen to overlap an existing 3m DEM (with 2 ft. vertical resolution) obtained by detailed digitizing of topographic maps by Ed Keller and Mark De La Garza of the UCSB Department of Geological Sciences.
7
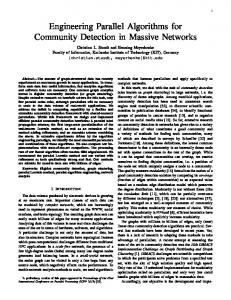
The overlapping areas chosen begin with the detailed 3m DEM, which covers only a small portion of Ellwood Canyon, just west of Goleta, California. This zone is an agricultural valley with areas of citrus orchards on flatter land and increasingly steep slopes covered by chaparral at the edge. Ellwood Canyon is one of several intermittent stream canyons draining the foothills of the Santa Ynez coastal range mountains, which rise to about 1200m. This is an east-west running range, and the study area covers the south facing slopes of approximately the center of the range. Zooming out to the 30m dataset includes both the neighboring canyons to the east and west, but also the peak regions along the ridge-following road, and the flatter urban and agricultural land of northern Goleta and unincorporated Santa Barbara County. At 90m, the region stretches from beyond the mountains into the Santa Ynez Valley through the San Marcos Pass, a saddle followed by the only major road to cross the mountains. The DEM at 90m includes the entire city of Goleta, the UCSB campus, the coastal plain and wetlands, the airport, and stretches to the ocean, in the south of the dataset. Figure 5 (a) shows the digital orthophoto coverage of the study area. Figure 5 (b) shows a hill-shaded rendition of the study area (Solar Azimuth 45o, Elevation 45 o). In each figure, the orange box is the 3m resolution DEM, the green box is 30m resolution DEM, and the whole image is 90m resolution DEM. Table 2 lists the extent, size and resolution of the three data sets.
(a)
(b) Figure 5. Digital Orthophoto and Hill-shaded DEM
Statistics describing the DEM elevation values were computed and are recorded in table 3. All units are in meters. Since the extents are different for the three different resolutions, the extremes and variances are not directly comparable. In the 3m DEM, elevations ranged from 50 to 215 m. The 30m and 90m DEMs both stretched from sea level to over 900m, zero elevations in the ocean were excluded from the computations. The mid-slope nature of the 3m DEM is obvious from the histograms of elevation shown in figure 6. In each case, elevations showed the characteristic exponential drop in frequency with elevation, with a secondary peak in the foothills of the mountains at about 700m. The 3m DEM was located further down the slope than this, and so has a far lower variance and elevation standard deviation.
8
Table 2. Extent of each DEM. Resolution
Top left 34 º 28’16.89”N
Bottom right
Length
X_cell
Y_cell
34 º 27’14.64”N
E-W: 1050 m N- S: 1950 m
350
650
34 º 25’57.99”N
E-W: 9000 m N- S: 9000 m
300
300
34 º 31’49.63”N
34 º 24’44.23”N
119 º 55’47.08”W
119 º 46’43.62”W
E-W: 13500 m N- S: 13500 m
150
150
3m
119 º 53’51.99”W
30m
119 º 54’26.83”W
90m
34 º 30’41.58”N
119 º 53’8.71”W 119 º 48’24.52”W
Table 3. Descriptive statistics for each DEM (units are meters) Resolution 3m 30m 90m
Average 119.56 283.00 306.66
3m
Median 120.0 148.0 163.0
Minimum 50.0 1.0 1.0
Maximum 215.0 931.0 992.0
30m
Standard Deviation 35.13 276.51 296.14
Figure 6. Histograms of elevation.
Variance 1234.30 76452.76 87699.79
90m
Results
The six methods used to calculate slope, aspect, curvature, and down slope were statistically compared with each value, using average (AVE), median (MED), minimum (MIN), maximum (MAX), standard deviation (STD), and variance (VAR). The below left figures show images from each of the 2FD, 3FD, 3FDWRD, 3FDWRSD, 3FFD, and SIMPLE D algorithms, and right figures are showing the statistical analysis AVE, MED, MAX, VAR, STD, and MIN, from top left clockwise. Slope In the slope case, the values of SIMPLE D method are significantly different with the others in all analysis and resolution. The minimum values of 3FD, 3FDWRD, and 3FDWRSD methods are comparatively less. Among those minimum values, 3FDWRD’s is the most significant low value. Especially, only in the lowest resolution (90m), the 3FFD method distinguishes the results that the values of AVR, MED, MAX, STD, and VAR are apparently different from the others.
9
Table 4. Statistical analysis of Slope Resolution
Average Median Minimum Maximum Std. Dev. Variance Average Median Minimum Maximum Std. Dev. Variance Average Median Minimum Maximum Std. Dev. Variance
3m 3 3 3 3 3 30 30 30 30 30 30 90 90 90 90 90 90
2FD
19.29 18.43 9.46 77.67 8.84 78.08 13.55 12.60 0.95 50.65 9.42 88.74 13.52 10.39 0.32 82.94 15.53 241.32
3FD
3FDWRD
17.92 16.66 3.18 76.81 9.03 81.50 13.06 12.21 0.32 46.83 9.26 85.82 13.28 9.82 0.11 80.64 15.38 236.45
17.92 17.12 1.64 76.88 9.06 82.14 13.10 12.23 0.07 47.08 9.29 86.22 13.37 9.92 0.04 80.87 15.44 238.52
3FDWRSD
17.94 16.72 3.37 77.00 9.11 83.04 13.14 12.26 0.34 47.63 9.31 86.66 13.44 10.02 0.11 81.15 15.52 240.90
3FFD
18.05 14.76 6.72 76.99 8.97 80.49 12.97 12.05 0.67 46.94 9.18 84.26 12.7302 9.4338 0.2250 80.1483 15.0672 227.02
SIMPLE D
23.92 18.43 18.43 80.04 8.10 65.69 14.60 13.52 1.90 54.47 9.65 93.05 14.31 11.24 0.64 86.45 15.43 238.09
Aspect In the aspect analysis, the SIMPLE D method shows a quite different result compared to the other methods. The 3FDWRD method makes the lowest minimum value in all the resolutions. Generally, the result trend of 3FD, 3FDWRD, 3FDWRSD, and 3FFD are similar. Depending on resolution, there is no special trend save for the median value of 3m resolution. Slope and aspect, the two most basic of the fundamental topographic parameters, show clearly that there is method-induced difference attributable to the various algorithms. In most cases, the 3FDWRD algorithm computed the lowest minimum value and had a high or the highest variance. The SIMPLE D algorithm consistently underestimated the values and showed structurally different comparative the results. Plan curvature Negative values of plan curvature show a divergence flow (e.g. on a ridge), and positive values represent convergent flow (e.g. in a canyon or valley). The 3FD (3m) and the 2FD (90m) method yielded quite different results compared to the other methods. This was not true of the 30m resolution, where all the results are similar. In Table 6, first of all, the plan curvature values for 3FD, 3FDWRD, 3FDWRSD, and 3FFD are shown. According to these results, the 3FD, 3FDWRD, 3FDWRSD, and 3FFD algorithms vary widely across the resolutions, but only minimally within each dataset.
10
Table 5. Statistical analysis of Aspect Resolution
Average Median Minimum Maximum Std. Dev. Variance Average Median Minimum Maximum Std. Dev. Variance Average Median Minimum Maximum Std. Dev. Variance
3m 3 3 3 3 3 30 30 30 30 30 30 90 90 90 90 90 90
2FD
193.85 225.00 3.81 352.87 101.84 10371.71 189.17 216.03 1.19 358.90 121.26 14702.90 184.35 191.31 0.0559 359.94 117.56 13819.62
3FD
3FDWRD
196.39 225.00 2.49 357.40 106.36 11312.59 189.00 213.69 0.39 359.51 123.27 15195.05 183.84 189.44 0.0189 359.98 119.26 14224.15
196.38 225.00 0.86 358.78 106.44 11329.83 188.93 213.37 0.035 359.93 123.43 15234.50 183.96 189.07 0.0097 359.99 119.57 14297.94
3FDWRSD
196.41 225.00 1.74 357.71 106.46 11332.92 188.93 213.50 0.29 359.64 123.31 15206.57 184.05 189.59 0.028 359.99 119.23 14215.66
3FFD
195.53 225.00 3.81 356.19 104.91 11005.13 189.12 215.54 0.61 359.33 122.93 15111.23 183.46 189.25 0.0279 359.97 118.81 14116.04
SIMPLE D
181.88 225.00 7.13 348.69 95.28 9078.27 188.31 216.87 2.05 357.88 118.86 14127.61 180.20 191.31 0.056 359.94 114.93 13208.08
Table 6. Statistical analysis of Plan curvature Resolution
Average Median Minimum Maximum Std. Dev. Variance Average Median Minimum Maximum Std. Dev. Variance Average Median Minimum Maximum Std. Dev. Variance
3m 3 3 3 3 3 30 30 30 30 30 30 90 90 90 90 90 90
2FD
-0.0013 0 -1.53206 2.66667 0.26217 0.06873 0.00006 0 -1.03709 1.06667 0.0337 0.00113 -0.01914 0 -44.7111 44.48889 1.185955 1.406489
3FD
3FDWRD
-0.001 0 -2.14663 8 0.29462 0.0868 -0.00002 0 -2.46667 2.4 0.04214 0.00177 -0.02969 0 -134.133 70.86388 2.128928 4.532333
-0.00107 0 -4.85702 6.4379 0.2931 0.0859 -0.00007 0 -4.45584 4.66274 0.04783 0.00228 -0.02798 0 -134.297 41.17848 1.889189 3.569036
3FDWRSD
-0.00106 0 -2.35702 5.33333 0.29308 0.08589 -0.00004 0 -4.57262 3.91266 0.0434 0.00188 -0.03014 0 -157.339 39.8676 1.874926 3.515346
3FFD
-0.00106 0 -1.64992 2.66667 0.30756 0.094593 0.00001 0 -1.15494 2.26667 0.03851 0.00148 -0.02802 0 -78.6696 63.28606 1.652424 2.730506
SIMPLE D
0.00102 0 -2.33333 2.33333 0.18396 0.03384 0.00025 0 -0.43333 0.80728 0.02355 0.00055 -0.01377 0 -11.1778 1.98972 0.314503 0.098912
Profile curvature Profile curvature measures the rate of change of the potential gradient, and so is important for characterizing flow velocity and sediment transport. Using equation 4, profile curvature is negative for slopes increasing downhill (convex flow profile, typically on upper slopes), and positive for slopes decreasing downhill (concave, typically on lower slopes). Except for the 2FD (90m) result, most of the results seem 11
alike, and we can see the characteristic flow lines against a fairly uniform mean value. In the statistics, the minimum value of 3FDWRD (3m) alone is positive, and the other distributions are similar save for the SIMPLE D algorithm. For the 30m DEM, there is no significant difference between the algorithms. For the 90m DEM, the 3FD, 3FDWRD, and 3FDWRSD algorithms show apparent differences from the remainder, in particular that the average value of SIMPLE D is always negative. Tangential curvature Tangential curvature was suggested by Mitasova and Hofierka (1993) as more appropriate than plan curvature for studying flow convergence and divergence because it does not trend to extremes when the slope is small. The distribution of convex and concave area is the same for both plan and tangential curvature. Tangential curvature is curvature in an inclined plane perpendicular to both the direction of flow and the surface (Gallant and Wilson, 1996). Except for the 2FD algorithm (90m) and SIMPLE D (3m), most of the results seem to be similar. In the statistical analysis of the 3m and 30m DEMs, the average values of SIMPLE D are positive. For the 90m DEM, the 2FD algorithm computed quiet different average and minimum values. As before, 3FD, 3FDWRD, and 3FDWRSD have similar values. Table 7. Statistical analysis of Profile curvature Resolution
Average Median Minimum Maximum Std. Dev. Variance Average Median Minimum Maximum Std. Dev. Variance Average Median Minimum Maximum Std. Dev. Variance
3 3 3 3 3 3 30 30 30 30 30 30 90 90 90 90 90 90
2FD 0.00019 0 -0.32911 0.38848 0.07779 0.00605 0.00006 0 -0.04306 0.04558 0.003578 1.28E-05 0.00041 0 -0.06231 0.27903 0.010432 0.000109
3FD 0.00018 0 -0.34043 0.45607 0.07766 0.00603 0.00006 0 -0.04641 0.04622 0.003586 1.29E-05 0.00011 0.00001 -0.24863 0.26039 0.007795 6.08E-05
3FDWRD 0.00019 0 0.34106 0.4501 0.07792 0.00607 0.00006 0 -0.04605 0.04638 0.003588 1.29E-05 0.00011 0.00001 -0.19422 0.26242 0.007224 5.22E-05
3FDWRSD 0.00019 0 -0.33603 0.43534 0.07813 0.0061 0.00006 0 -0.04558 0.04648 0.003591 1.29E-05 0.00013 0.00001 -0.24716 0.26217 0.007297 5.325E-05
3FFD 0.00011 0 -0.34482 0.45712 0.07608 0.00578 0.00006 0 -0.0464 0.04529 0.00357 1.27E-05 0.00027 0 -0.18555 0.24834 0.01205019 0.00014520
SIMPLE D 0.00169 0 -0.55505 0.94868 0.06015 0.00361 0.00008 0 -0.03628 0.04323 0.003549 1.26E-05 -0.00038 0 -0.18558 0.04246 0.0070469 4.965E-05
Down Slope Accumulation We calculated down slope parameters using down slope accumulation and down slope direction. In the accumulation map, flow lines are dark blue. These flow lines show streams closely in the 30m and 90m DEM. Also the high resolution, 3m DEM shows a stream line in the valley bottom. It is hard to find high convergence in the 3m DEM, but it shows clearly in the canyons in the 30m and 90m DEMs. In these analyses, generally
12
Table 8. Statistical analysis of Tangential curvature Resolution
Average Median Minimum Maximum Std. Dev. Variance Average Median Minimum Maximum Std. Dev. Variance Average Median Minimum Maximum Std. Dev. Variance
3m 3 3 3 3 3 30 30 30 30 30 30 90 90 90 90 90 90
2FD -0.00005 0 -0.72748 0.85408 0.09123 0.00832 -0.00004 0 -0.06994 0.08503 0.004732 2.24E-05 0.00153 0 0 0.13037 0.00926 8.58E-05
3FD -0.00002 0 -0.77742 0.92897 0.09658 0.00932 -0.00003 0 -0.06888 0.08079 0.004795 2.3E-05 0.00006 0 -0.30971 0.44562 0.013051 0.00017
3FDWRD -0.00002 0 -0.77369 0.92187 0.09582 0.00918 -0.00003 0 -0.0698 0.08188 0.004791 2.29E-05 0.00004 0 -0.30971 0.42716 0.012639 0.00016
3FDWRSD -0.00001 0 -0.76891 0.91331 0.095 0.00902 -0.00003 0 -0.07042 0.08282 0.004782 2.29E-05 0.00005 0 -0.349 0.4327 0.012356 0.000153
3FFD -0.00006 0 -0.78378 0.94898 0.09843 0.00968 -0.00002 0 -0.06621 0.07574 0.004796 2.3E-05 -0.00019 0 -0.3097 0.49505 0.013469 0.000181
SIMPLE D 0.00789 0 -0.94868 1.79196 0.08711 0.00758 0.0001 0 -0.04666 0.06536 0.004558 2.08E-05 -0.00037 0 -0.24801 0.03361 0.008237 6.79E-05
3FFD 0.948356 1 0 4.5 0.630442 0.397457 0.948556 0.95455 0 5.66666 0.530336 0.281257 0.962622 0.92857 0 5.36667 0.60946 0.371442
SIMPLE D 0.782163 0.5 0 4.75 0.878001 0.770886 0.903422 0.90476 0 5.41667 0.667133 0.445066 0.968 0.875 0 5.0015 0.775872 0.601978
Table 9. Statistical analysis of Down slope accumulation Resolution
Average Median Minimum Maximum Std. Dev. Variance Average Median Minimum Maximum Std. Dev. Variance Average Median Minimum Maximum Std. Dev. Variance
3m 3 3 3 3 3 30 30 30 30 30 30 90 90 90 90 90 90
2FD 0.916044 0.91667 0 4.5 0.758103 0.57472 0.931256 0.93452 0 5.875 0.614504 0.377615 0.955378 0.904765 0 5.625 0.722315 0.521739
3FD 0.931565 0.975 0 4.5 0.551382 0.304023 0.952056 0.95455 0 5.73333 0.526282 0.276973 0.9684 0.932895 0 5.14167 0.628034 0.394426
3FDWRD 0.930207 0.98223 0 4.5 0.549287 0.301716 0.9507 0.95669 0 5.76776 0.519127 0.269493 0.969511 0.93934 0 5.26429 0.61547 0.378803
3FDWRSD 0.930466 0.97368 0 4.5 0.553524 0.306389 0.951567 0.95555 0 5.80357 0.527487 0.278242 0.967956 0.93394 0 5.38333 0.634062 0.402034
the results of 3FD, 3FDWRD, 3FDWRSD, and 3FFD algorithms seem to be similar. We conclude from the accumulation analysis that at all three scales down slope accumulation represents converging water flow better than down slope direction. Summary The statistical tabulation of fundamental topographic properties computed across scales using the various algorithms has shown that there is indeed statistically significant 13
method-produced error in the algorithms, and that this error is some function of scale, although not in all cases. This does not, however, answer the question of where the differences are manifested within the DEM. In the following section, we seek to map the algorithmic differences, and to assess what elements are present about which general recommendations might be made. Spatial Distributions of Algorithmic Difference
We computed the paired differences for the three DEMs between all combinations and permutations of algorithms. With three resolutions and five fundamental parameters, the results are too many to show in this paper. We have selected, therefore only two instances that show maximal method-produced difference. Figure 7 and 8 show two examples, the 3m data sets for each algorithm for two parameters. In each case only one half of the paircomparison matrix is shown since they are symmetrical about the leading diagonal, with only the sign changed. In the two figures, the axis of each figure is the same size, therefore different colors represents the differences between each pair of algorithms. Green is at the center of the scale, corresponding to no difference between algorithms. Table 10. Statistical analysis of Down slope direction Resolution
Average Median Minimum Maximum Std. Dev. Variance Average Median Minimum Maximum Std. Dev. Variance Average Median Minimum Maximum Std. Dev. Variance
3m 3 3 3 3 3 30 30 30 30 30 30 90 90 90 90 90 90
2FD 11.1493 2 0 4363 60.21325 3625.636 13.15108 3 0 1479 47.86049 2290.627 7.213511 2 0 509 18.44081 340.0636
3FD 13.34403 3 0 4068 68.53191 4696.623 13.70862 4 0 1582 49.65852 2465.969 7.625244 3 0 375 18.97207 359.9396
3FDWRD 13.37593 4 0 4067 68.60219 4706.261 14.00507 4 0 1458 52.59124 2765.838 7.548978 3 0 374 18.63233 347.1637
14
3FDWRSD 13.41589 4 0 4087 68.86897 4742.935 13.83769 4 0 1458 51.19556 2620.986 7.398356 3 0 360 17.47034 305.2129
3FFD 12.83983 4 0 4430 63.35333 4013.644 14.08023 4 0 1335 49.28985 2429.49 8.111422 3 0 555 23.32765 544.1791
SIMPLE D 4.743477 1 0 1491 22.68011 514.3874 12.16021 3 0 1075 40.36706 1629.499 6.049822 2 0 307 14.19683 201.55
Figure 7 (3m) shows the values for aspect computed with the six algorithms. Of these, the greatest variations in results are between SIMPLE D and 2FD versus the remainder, which are comparable. The differences are most striking at the highest resolution, but are similar in structure at the other two scales. The 2FD differences are negative (i.e. 2FD overestimates aspect) although the differences are minor. SIMPLE D in all cases underestimates aspect, it tends to smooth and oversimplify the surface. This is more the case at north and south-facing slopes, implying quantization error at 180 and 360 degrees. It is also the highest on steeper slopes and at higher elevations. A similar result is the case for considering Tangential curvature at 3m (Figure 8). Again, by far the majority of differences are between the SIMPLE D method and all others. This effect is also mitigated by scale, i.e. differences are highest at 3m and diminish with smoothing to 30 and 90m. In this case, the difference in Tangential curvature between any of the other methods and SIMPLE D was both positive and negative, and remarkably consistent. There is apparently a strong correlation with aspect error, note that the blues and reds in figure 8 match the browns and yellows in figure 7 respectively quite well. This plan curvature error in SIMPLE D seems derivative of the fact that SIMPLE D does a relatively poor job of computing terrain aspect, especially in the principal compass directions.
Figure 7. Difference of aspect
15
Figure 8. Difference of Tangential curvature
Error and Stream Flow
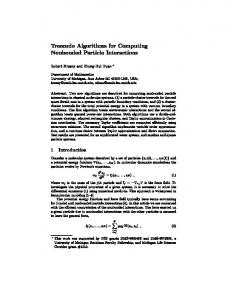
We compared the different algorithms’ abilities to enhance the stream network by comparing the down slope accumulation data with digitized stream symbols extracted from the National Map, these derived from the blue lines of seven-and-a-half minute 1:24,000 map quadrangles. Almost all streams in this area are ephemeral. In the case of the down slope accumulation, both 10% and 20% thresholds (of all pixels) were used to distinguish between cells likely to contain streams and those not likely. As before, these are shown at the three spatial resolutions and extents. In each case there is a very close degree of correspondence between the highest values of the down slope accumulation ratio and the digitized stream network. There is a noticeable one pixel offset to the south and east, most likely reflecting the pixel processing order in the algorithms. Such an effect could be easily compensated for in actual systems. Overlay of the digital map stream pixels with the thresholded down slope flow accumulation images creates a map of correct/incorrect assignments of pixels to streams. The values shown are the percentage of pixels that fall into the digitized stream lines as a proportion of all stream line pixels, comparable to a percent-correct accuracy measure (Table 11). This allows an accuracy assessment of sorts, although the digital map versions of the streams could be significantly improved by detailed image interpretation, and the elimination of the stream tunnel visible on the 90m DEM. Accuracy varied from a low of 7% (3FDWRD at 90m, using a 10% threshold) to a high of 73% (2FD at 30m with a 20% threshold). Thus the 16
2FD method, while generating significant error, may yield good stream networks. Ironically the worst performing algorithm, SIMPLE D, also had accuracies of up to 59% (3m with a 20% threshold). Table 11. Accuracy Statistics for Stream Recognition
100
(%)
80 60 40 20 0 2FD 3m(20%)
3FD
3FDWRD
3FDWRS D
3FFD
SIMPLE D
52.580567 35.643324 35.643324 35.643324 41.604071 67.603586
30m(20%) 92.673308 78.559568 77.770859 78.767123
83.3956
83.540888
90m(20%) 82.261155 68.929647 67.615658 68.573775 78.346564 69.203394 3m(10%)
40.780228 26.362976 26.387206 26.387206 26.653744 59.922462
30m(10%) 59.838107 47.011208 47.031963 47.73765 45.828144 59.381486 90m(10%) 47.878456 36.079934 35.860936 37.202299 35.532439 40.514645
Conclusions
According to the results, the 3FD, 3FDWRD, 3FDWRSD, and 3FFD algorithms at most resolutions have similar characteristics to each other in all the cases (except for the down slope accumulation parameters at 30m and 90m at the 20% threshold) In this final result, the 2FD and SIMPLE D algorithms created far more overlay area than the others, resulting in apparent but not necessarily repeatable high accuracies. There are statistically significant differences between the fundamental topographic parameter, slope, aspect, curvature, and down slope among all six methods. From all of these results, the result calculated for slope and aspect shows that the 3FDWRD algorithm gives comparatively the most precise results. The 3FD, 3FDWRSD, and 3FFD algorithms have very similar results with 3FDWRD. The SIMPLE D algorithm shows by far the greatest differences when comparing among the algorithms. This algorithm is apparently unique because SIMPLE D uses only a 2 pixel neighborhood to calculate the fundamental topographic parameter. It is interesting that the SIMPLE D assessed accuracies are high in every resolution and method, but this may be due to overestimation of stream area. As a summary recommendation, the 3FDWRD algorithm is preferred in all instances, it yields a more precise result, and over a wide range of values. In this study, we have investigated the difference between six algorithms. In future work, we hope to both give a more complete set of results, and to further investigate the inter-relations of the fundamental topographic parameters.
17
3m DEM
30m DEM
90m DEM Figure 9. Digitized flow line and assessed accumulation at the 3 resolutions
18
References Carter, J., (1992). The Effect of Data Precision On The Calculation Of Slope And Aspect Using Gridded DEMs. Cartographica, Vol. 29, No. 1, p. 22-34.. Chu,T.H.and T.H. Tsai., (1995). Comparison of accuracy and algorithms of slope and aspect measures from DEM, in Proceedings of GIS AM/FM ASIA’95, p. 21-24 August, Bamgkok. Costa-Cabral, M., and Burgess, S., (1994). Digital Elevation Model Networks (DEMON): A model of flow over hillslopes for computation of contributing and dispersal areas. Water Resources Research, Vol. 30. No. 6, p. 1681-1692. Douglas, D.H., (1986). Experiments to locate ridges and channels to create a new type of digital elevation model. Cartographica Vol. 23, p. 29-61. Evans, I.S., (1980). An integrated system of terrain analysis and slope mapping, Zeitschrift fur Geomorphologie, Supplement Band, Vol. 36, p.274-295. Evans, I.S., (1998). What Do Terrain Statistics Really Mean?. In: Landform Monitoring, Modelling and Analysis, Edited by S. N. Lane, K. S. Richards and J. H. Chandler, John Wiley and Sons, 300 pp. Fleming,M.D., and R.M. Hoffer., (1979). Machine processing of Landsat MSS data and LARS Technical Report 062879, Laboratory for Applications of Remote Sensing, Purdue University, West Lafayette, Indiana. Gallant, J.C. and Wilson, J. P., (1996). TAPES-G: A Grid-Based Terrain Analysis Program for the Environmental Sciences, Computer & Geosciences, Vol. 22, No. 7, p. 713-722. Horn, B.K.P., (1981). Hill shading and the reflectance map, Proceedings of IEEE, Vol. 69, No. 1, p. 14-47. Hunter, G. and Goodchild, M., (1997). Modeling the Uncertainty of Slope and Aspect Estimates Derived From Spatial Databases. Geographical Analysis, Vol. 29, No. 1, p. 35-49. Hutchinson, M. F., (1989) A New Procedure for Gridding Elevation and Stream Line Data With Automatic Removal of Pits. Journal of Hydrology, Vol. 106, p. 211-232. Jenson, S. and Domingue, J., (1988). Extracting Topographic Structure from Digital Elevation Data for Geographic Information System Analysis. Photogrammetric Engineering and Remote Sensing, Vol. 54, No. 11, p. 1593-1600. Jones, K.H., (1988). A comparison of algorithms used to compute hill slope as a property of the DEM, Computer and Geosciences, Vol. 24, No. 4, p. 315-323. Lee, J., (1996). Digital Elevation Models: Issues of Data Accuracy and Applications. ESRI User Conference, www.esri.com/resources/userconf/proc96. Lee, J., Snyder, P., and Fisher, P., (1992). Modeling the Effect of Data Errors on Feature Extraction From Digital Elevation Models. Photogrammetric Engineering and Remote Sensing, Vol. 58, No. 10, p. 1461-1467. Lea Nicholas J., (1992). An aspect-driven kinematic routing algorithm, in Over Land Flow: Hydraulics and Erosion mechanics, edited by A.J. Parsons and A.D. Abrahams, . Chapman and Hall, p. 393-407. Moore, I. D., Gessler, P. E., Nielsen, G. A., and Peterson, G. A., (1993). Soil attribute prediction using terrain analysis. Soil Science Society of America Journal, Vol. 57, p. 443-455. Moore, I. D., Grayson, R. B. and Ladson, A. R., (1991) Digital terrain modeling: A review of hydrological, geomorphological, and ecological applications. Hydrological Processes, Vol. 5, p. 3-30.
19
O’Callaghan, J.F. and Mark, D.M., (1984). The extraction of drainage networks from digital elevation data, Computer vision, Graphics and Image Processing, Vol. 28, p. 323-344. Quinn, P., Beven, K., and Lamb, R., (1995). The ln(A/TanB) index: How to calculate it and how to use it within the Topmodel framework. Hydrological Processes, Vol. 9, p. 1611-182. Quinn, P., Beven, K., Chevallier, P. and Plancon, O., (1991). The prediction of hillslope flow paths for distributed hydrological modeling using digital terrain models. Hydrological Processes, Vol. 5, p. 59-79. Reiger, W., (1998) A Phenomenon-Based Approach to Upslope Contributing Areas and Depressions in DEMs. Hydrological Processes, Vol. 12, p. 857-872. Ritter, D., (1987) A vector-based slope and aspect generation algorithm, Photogrammetric Engineering & Remote Sensing, Vol. 53, No. 8, p. 857-872. Ryder, W. and Voyadgis, D., (1996). Measuring the Performance of Algorithms for Generating Ground Slope. p. 208-216, In: Spatial Accuracy Assessment in Natural Resources and Environmental Sciences: Second International Symposium, United States Department of Agriculture, Rocky Mountain Forest and Range Experiment Station, Fort Collins, CO, Report RM-GTR-277. Salzmann, N., Kaab, A., Huggel, C., Allgower, B and Haeberli, W., (2004). Assessment of the Hazard Potential of Ice Avalanches using remote sensing and GIS-modelling. Norsk Geografisk Tidsskrift-Norwegian Journal of Geography, Vol. 58, p. 74-84. Sharpnack, D.A., and G. Akin., (1969). An Algorithm for computing slope and aspect from elevation, Photogrammetric Survey, Vol. 35, p. 247-248. Speight, J.G., (1974).A parametric approach to landform regions. In E.H. Brown and R.S Waters(eds.), Progress in Geomorphology. London: Alden, p. 213-230. Speight, J.G., (1980).The role of topography in controlling throughflow generation: a discussion. Earth Surface Processes, Vol. 5, p. 187-191. Tarboton, D., (1997). A new method for the determination of flow directions and upslope areas in grid digital elevation models. Water Resources Research, Vol. 33, No. 2, p. 309-319. Tarboton, D., Bras, R., and Rodriguez-Iturbe, I. (1993). On the extraction of channel networks from digital elevation data. In: Terrain Analysis and Distributed Modeling In Hydrology, Edited By: K. Beven, I.D. Moore, John Wiley and Sons, New York, NY, p. 85-104. Tobler, W. (1967), “Of Maps and Matrices,” Journal of Regional Science, Vol. 7, p. 275-280. Unwin, D., (1981). Introductory Spatial Analysis. Methuen, London and New York. Wolock, D. and McCabe, G., (1995). Comparison of single and multiple flow direction algorithms for computing topographic parameters. Water Resources Research, Vol. 31, No. 5, p. 1315-1324. Wood, J.D., (1996). The Geomorphological Characterization of Digital Elevation Model, PhD Thesis, University of Leicester. Wilson, J. P. and John C. Gallant., (2000). Terrain Analysis. Principles and Applications. New York: J. Wiley. Zevenbergen, L.W., and C.R. Throne., (1987). Quantitative analysis of land surface topography. Earth Surface processes and Landforms.,Vol.12, p. 47-56. Zhou, Q. and X. Liu., (2002). Error assessment of grid-based flow routing algorithms used in hydrological models, International Journal of Geographical Information Science, Vol.16, No. 8, p. 819-842. Zhou, Q. and X. Liu., (2002). Error analysis on grid-based slope and aspect algorithms, Photogrammetric Engineering & Remote Sensing, Vol. 70, No. 8, p. 957-962.
20