PEOPLE: International Journal of Social Sciences ISSN 2454-5899
Barcelona, 2017 Volume 3 Issue 3, pp.392-409 Date of Publication: 6th December 2017 DOI-https://dx.doi.org/10.20319/pijss.2017.33.392409 This paper can be cited as: Barcelona, A. (2017). An Assessment Of The Non-Graded System Based On Learners’ Learning Satisfaction, Behavior, And Outcomes. People: International Journal Of Sciences , 3(3), 392-409.
AN ASSESSMENT OF THE NON-GRADED SYSTEM BASED ON LEARNERS’ LEARNING SATISFACTION, BEHAVIOR, AND OUTCOMES Alvin B. Barcelona UST-Angelicum College Inc., Quezon City, Philippines
[email protected]
Abstract This study aimed to assess the Non-graded System of a progressive school which advocates selfpaced and individualized mode of learning, mastery learning program, and modular approach to learning based on learners’ Learning Satisfaction, Behavior, and Outcomes. A combined evaluation model was used which is Outcome Evaluation with influence of Kirkpatrick’s’ Four Level training evaluation. The concurrent mixed method design was used in gathering and interpreting the answers provided by the respondents. Data gathering tools used include a learning satisfaction survey, school archives, individual interviews, and focused group discussions. For the learning satisfaction, 217 higher level learners were chosen using stratified random sampling and for the learning outcomes, K4-10 Summary of Learners’ Academic Performance (SLAP) of all the learners were included. Results showed that non-graded system causes less academic pressure but gives opportunities to correct mistakes; provides more engaging learning experiences; strengthens independent and individualized learning; offers opportunities for academic advancement and academic freedom; and highlights the advantages of non-existence of grades. In general, the respondents were satisfied with the non-graded system. In terms of learning outcomes, the proportions of the learners who finished their © 2017 The author and GRDS Publishing. All rights reserved. Available Online at: http://grdspublishing.org/
392
PEOPLE: International Journal of Social Sciences ISSN 2454-5899
academic requirements for two academic years were very high (94.30%). Moreso, report on periodical accomplishments that focus on the self-paced learning showed that on average, 69.36% of the total learners accomplished the set targets. The identified positive changes in the behavior of the learners as a result of their learning experiences were strengthened self-reliance and self-esteem, improved patience, and appreciation towards studying. However, it was also revealed that there are a number of learners who needed to be more motivated to become more academically productive. Keywords Assessment, non-graded system, outcome evaluation, learning satisfaction, behavior, outcomes
1. Introduction 1.1 Background of the Study Not every child is successfully catered in traditional school settings. The traditional system of education is broken and ineffective in meeting the diverse and rapidly changing needs of young people in today‟s society (Fizell & Raywid, 1997 as cited by Quinn and Poirier, 2007). The rigidness of the structure of traditional delivery of education has provoked the need for the schools to be more flexible in responding to the academic needs of the learners. It is for this reason that alternative structures of the educational system began to surface as early as the first half of 19th century. For almost two centuries after the emergence of alternative education, various forms of traditional -nonconformist schooling have moved into the mainstream. Alternative education describes different approaches to teaching and learning other than the state-provided mainstream education, usually in the form of public or private schools with special and innovative curriculum and a flexible program of study which is based on the individual student‟s interests and needs (Raywid, 1988; Koetzsch, 1997; Aron, 2003; Carnie, 2003 as cited by Sliwka, 2008). The non-graded approach to learning which also advocates self-paced learning and mastery learning program is one of most popular forms of alternative education in the present. This approach, which spurred high interest to educators in the 1960‟s, recognizes that students learn at different rates. Students are allowed to progress at an individual pace where there are flexible groupings, modified instruction which are developmentally appropriate to each learner,
© 2017 The author and GRDS Publishing. All rights reserved. Available Online at: http://grdspublishing.org/
393
PEOPLE: International Journal of Social Sciences ISSN 2454-5899
and increased student mastery (Tullis et.al, 1990). In this kind of set up, students enjoy more academic freedom but assume greater responsibility to learn mostly on their own. Moreover, the non-graded set up adheres to the philosophy of John Dewey that primarily concerns on valuing the differences in individuals and allowing students to learn from their experiences in and out of the classroom (Goodland & Anderson, 1959 as cited by Evanshen 2001). The continuous progress of learners is reflected in the learners‟ growth of knowledge, skills, and understanding, and not movement through a predetermined sequence of curriculum levels (Pavan, 1977) There are various characteristics of alternative education that are frequently cited in the literature: personalized school environment, flexibility, choice, effective classroom management, high expectation of students, special teacher training, parent involvement, and collaboration. These characteristics unclearly produce positive outcomes or correlated with positive outcomes (Quinn & Porier, 2007). Literature about non-graded schools, more specifically about their processes, experiences, and more importantly assessment and evaluation of the system are very limited. Research studies and commentaries on non-graded and multi- education at the onset of 2000 became limited (Kreide, 2011). Some advantages of the non-graded schools are noted like (1) students may avoid the damaging effects of failure and repetition; (2) student learning becomes the primary focus as compared to the number of years a student spends in schools; (3) a sense of success, confidence, and self-reliance enhances positive development of the students‟ self-concept;(4) the instructional philosophy moves in the direction of individual diagnosis and prescription;(5) the elimination of pressures due to boredom and excessive competition might reduce some forms of undesirable behavior (Tullis et. Al, 1990) Ball (2002) believes that the main advantage of a non-graded school is its ability to adopt a totally needs- based approach. The child development is always considered and learning activities and experiences are based on what the learners need. There are previous studies conducted favoring the non-graded schools with respect to academic performance and behavior development. Pavan (1977) as cited by Evanshen in 2001 on his research projects on non-graded system found out that students in non-graded groups performed well and possibly better than the graded groups on test designed for graded schools. © 2017 The author and GRDS Publishing. All rights reserved. Available Online at: http://grdspublishing.org/
394
PEOPLE: International Journal of Social Sciences ISSN 2454-5899
Moreover, the same research concluded that positive self-concepts and good attitudes toward school were more likely to be found in non-graded schools than graded schools. Gutierrez & Slavin (1992) in their study about the “Achievement Effects of a NonGraded Elementary School” shows that in a system where children are flexibly grouped not according to their age but based on their performance level and can proceed across levels at their own rate, consistent positive achievement effect of simple forms of non-grading generally developed early. However, forms of non-grading making extensive use of individualization were less consistently successful.(median ES = + .02). Studies of Individually Guided Education (IGE), which used non-grading and individualization, also produced inconsistent effects (median ES = + .11). Overall, the study concludes that non-graded organization can have a positive impact on student achievement if cross-age grouping is used to allow teachers to provide more direct instruction to students but not if it is used as a framework for individualized instruction. Non- Academic Reports on Non-Graded Schools Multiage students scored significantly higher on “Happiness and Satisfaction Factors” than their single aged student counterparts. (Way as cited by Kreide, 2011). The study also shows that teachers were able to form stronger teacher-parent connections, understand each student‟s development and personality at the onset, plan appropriate individualized curriculum over summer, and experience fewer discipline issues when compared to single-age classrooms. As a result non-graded educators were able to avoid typical beginning of the year introductions and instead could focus immediately on instruction. For parents, teachers, and students the nongraded classroom provided a less stressed environment representing familiarity and comfort (Anderson & Pavan, 1993; Elkind, 1987; Logue, 2006; Miller, 1994 as cited by Kreide. 2011). Further studies were made about learners in the non-graded system but are quite outdated. In an analysis of 30 studies, every learner shows a positive association between nongraded learners‟ self-concept and attitude toward school (Pratt 1986 as cited by Kreide, 2011). A meta-analysis study found a significantly positive effect in students‟ attitude toward school and students were “more advanced” in “interpersonal intelligence” than their peers in age-segregated or “straight” classes” (Lloyd 1999 as cited by Kreide, 2011). A higher self-concept and positive attitude towards the non-graded school meld with ethic of care” where such characteristics are visible when a school is able to “nurture the whole child” (Noddings‟ 2005 as cited by Kreide, 2011). © 2017 The author and GRDS Publishing. All rights reserved. Available Online at: http://grdspublishing.org/
395
PEOPLE: International Journal of Social Sciences ISSN 2454-5899
Also, positive outcomes in the non-cognitive realm such as, “more positive attitudes towards school, greater leadership skills, greater self-esteem, and increased pro-social and fewer aggressive behaviors, compared to peers in traditional graded classrooms” (Kinsey 2001 as cited by Kreide, 2011). With regards to students „attitude towards attending a non-graded school, Anderson & Pavan, 1993 (as cited by Evanshen, 2001) claimed that 52% of the studies indicated that nongraded schools are better in relation to school attitudes and that the longer the students are in the non-graded schools, the more favorable are the school attitude On the other hand, some concerns challenge the non-graded schools like (1) the significant amount of time and planning which are needed to establish and carry out an effective program ; (2) teachers‟ turnover may increase because of the level of flexibility and personality demands to teachers; (3) finding textbooks may be difficult since most textbooks are designed for graded programs; (4)students will not put forth the effort to achieve grade standards because non-grading has no fixed standards; (5) it is not certain that the program will result to improved learning (Tullis, 1990). While the graded setting remains to be the dominant educational paradigm, discussion and assessment on the shift to non-graded is now more relevant considering the revolution in the way learners learn, changes in educational environment, impact of technology, and basically failure of traditional schools to respond to the varying and individual needs of each learner. Indeed, there is a need for a program or system evaluation to measure its impact to the learners. 1.2 Research Objectives and Problems For this purpose, the researcher had an initial assessment of then non-graded system of a certain institution guided by outcome evaluation model to determine if such system can produce the desired outcomes. Specifically, this study aimed to assess the non-graded system of a private
school based on learners‟ learning satisfaction, behavior, and outcomes. Specifically, the researcher sought to answer the following questions: (1) What are the strengths and weaknesses of the system of the school as perceived by the learners? (2)What is the level of satisfaction of the learners about the non-graded system offered in the school? © 2017 The author and GRDS Publishing. All rights reserved. Available Online at: http://grdspublishing.org/
396
PEOPLE: International Journal of Social Sciences ISSN 2454-5899
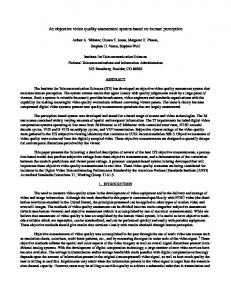
(3) To what extent do the learners acquired the intended knowledge, skills, and attitudes as a result of the implementation of the system? (4). To what extent do the learners change their behavior as a result of their experiences in a non-graded school? (5)Are the desired impacts being felt? What impact will improve the school‟s system? 1.3 Gap Identification The non-graded system the subject school has evolved through the years. For almost half a century of existence, there are no documented studies evaluating the system. According to the pioneer and seasoned facilitators, the school had its glorious period before the 21st century where enrolment numbers were still quite higher compared to the present. It is only in the recent years that the school has been experiencing decrease of enrolment and increase of cases of learners who have backlogs ( unmastered skills). While the decrease in the enrolment and problems on mastery performance of learners can be accounted for so many reasons, the researchers believed that there is a need to evaluate the system that has been running for almost half a century. While the purpose of this study is to evaluate the school‟s non-graded system, the researcher considered that it was only fitting to conduct an assessment study of the school‟s system in order to have basis of evaluating the worth of the program. This can also serve as basis of decision to improve areas or features of the system to improve the services of the school to its stakeholders. The logic model that follows describes the school‟s system inputs, activities, and outcomes.
© 2017 The author and GRDS Publishing. All rights reserved. Available Online at: http://grdspublishing.org/
397
PEOPLE: International Journal of Social Sciences ISSN 2454-5899
Inputs
Activities
• Funding from Learners' tuition fees • Curriculum • Non-Graded System • School Leaders and Administrators • Expert Facilitators • Learning Stations, Laboratories and other Facilitators • Modules • Parents
• delivers quality education using the non-graded system • Implements curriculum based on the individual needs and skills of the learners • implements learning activities, both academic and non-academic to develop the totality of the learners • continuous training of facilitators and adminstrators
Short- Term Outcomes The learners will have improved acquisition of knowledge and skills and have increased awareness on the behavior and attitude expected of them as stipulated in the curriculum.
Long- Term Outcomes Incresed in academic competence, social responsiveness ,moral uprigthness and functionality in the society
Source: School’s Vision and Mission
Figure 1: Logic Model of the Evaluand 1.4 Scope and Delimitation This study which aimed to assess the non-graded system of a school was based on the learners‟ learning satisfaction, their behavior, and outcomes only. The researcher delimited the sources of both quantitative and qualitative data from the learners only and excluded the perception of the other important stakeholders because of time constraint and availability of significant data. Also, in measuring the level of learning satisfaction of the learners, the researcher intentionally involved a sample form the Junior High School population only as to gather a more apt perception because the JHS students are assumed to be more mature than the students in the primary level. In terms of the learning outcomes of the learners, only the Summary of the Learners’ Academic Performance (SLAP) was used by the researcher which was obtained from the data © 2017 The author and GRDS Publishing. All rights reserved. Available Online at: http://grdspublishing.org/
398
PEOPLE: International Journal of Social Sciences ISSN 2454-5899
archives of the office of the team- principal. The limitation of this source may be the quality of learning that the learners were acquired because the SLAP only measured the quantity of students who are in the right pacing in a self-paced and individualized mode of learning. Furthermore, only the JHS students were involved in the individual interviews and focus group discussions for the reason that the researcher because they these learners have significant time exposure to the non-grade system.
2. Methodology The researcher made use of a concurrent mixed -method design. The purpose of a convergent (or parallel or concurrent) mixed methods design is to simultaneously collect both quantitative and qualitative data, merge the data, and use the results to understand a research problem. A basic rationale for this design is that one data collection form supplies strengths to offset the weaknesses of the other form, and that a more complete understanding of a research problem results from collecting both quantitative and qualitative data (Creswell,2012). Moreover, the descriptive evaluation design was used to determine whether a program is meeting the target outputs, identify areas for improvement, and ways to improve the program. It is also used by researchers to know whether the participants of the program increased in knowledge, skills, behavior, and attitudes. 2.1 Evaluation Model The researcher came up and combined evaluation models in assessing the non –graded system of the school of interest. This study made used of the outcome evaluation model with influence of Kirkpatrick's Four-Level Training Evaluation Model. Primarily, outcome based evaluation model consist of activities that are designed to measure the effects or results of program, rather than their inputs or processes (Stufflebeam, et. al 2000). Outcomes are important because they provide a mechanism by which programs are able to assess the impact that they have had on their beneficiaries. After describing the implementation and process of delivering services, at some point programs and services need to produce evidence to document what they have realized for the populations with whom they have been working ( Myers & Barnes, 2005).
© 2017 The author and GRDS Publishing. All rights reserved. Available Online at: http://grdspublishing.org/
399
PEOPLE: International Journal of Social Sciences ISSN 2454-5899
An approach to evaluation that focuses on outcomes of the learners benefits the administrators and teachers significantly. It provides information that can help them improve their work with program participants, learn model about program priorities, participants‟ needs and most of all documents the successes that they achieve. All programs, when committed to evaluating outcomes, will need those individuals delivering services to be committed to the process of an outcome focused approach that an evaluative culture can engender as they are often involved in collecting vital information, and recording it appropriately ( Myers & Barnes, 2005) The evaluation questions are also based on the Kirkpatrick‟s Four Level model which is primarily used to evaluate the effectiveness of certain training. Although this model is mostly used in evaluating trainings, the researcher thinks that the experiences of the learners in a school is similar to that of “training experiences” in many ways. Also, the researcher thinks that Kirkpartrick‟s four levels of evaluation are the exact outcomes that the researcher wishes to measure and assess with regard to the delivery of the non-graded system. EVALUATION FRAMEWORK BASED ON OUTCOME EVALUATION MODEL (Short Term & Intermediate Outcome Evaluation)
Figure 2: Evaluation Framework 2.2 Sampling A probabilistic sampling, specifically, stratified sampling method was used by the researcher to find a sample of the population in measuring the learning satisfaction of the © 2017 The author and GRDS Publishing. All rights reserved. Available Online at: http://grdspublishing.org/
400
PEOPLE: International Journal of Social Sciences ISSN 2454-5899
learners. The researchers considered the higher level learners (Grade 7-10) only to make the results more credible since they are more mature than the lower levels. Originally, the researcher tried to include 30% of the population of the higher levels. However, only 217 learners 27.17% of the total population responded to the survey. A purposive sampling was used to determine the respondents who participated on the interviews and focus- group discussions. The selections of the respondents are based on the issues that these respondents raised when they responded to the survey like those who gave extreme assessment scores. 2.3 Research Instrument In order for the researcher to measure the learning outcomes of the learners in the school which has a non-graded system, the researcher made reference to the Summary of Learners’ Academic Performance (SLAP). The SLAP is the main tool of the teachers and administrators to determine the performance of the learners in different subject areas throughout the year where in it contains the percentage of the learners who can accomplish the set targets per period and for the entire academic year. The researcher also compared the performance of the learners for the past three years to make the assessment of their learning outcomes more credible. Furthermore, the researcher developed and used a questionnaire to measure the learning satisfaction of the learners. The domains in which learning satisfaction are measured based on the literature are (1) instruction and teaching quality, (2) learning materials and facilities, (3) learning outcomes, (4) learning environment, (5) peer relationship and (6) attitude towards learning. The face and content validity of the questionnaire are secured by three experts who are Ph .D. holders who looked through the items of the scale. The internal consistency of the scale was also determined. The Cronbach‟s Alpha each domain are instruction and teaching quality ( (
, (3) learning outcomes (
relationship (
, learning materials and facilities
, learning environment (
and (6) attitude towards learning (
, (5) peer
. All domains have a
good internal consistency index except peer relationship with an acceptable index only. Individual interviews and focus group discussion were also conducted. Interview is a method to gain more in-depth information to supplement surveys and focus group interviews can give the researchers deeper information in a more economical way (Nagle &Williams, 1999). © 2017 The author and GRDS Publishing. All rights reserved. Available Online at: http://grdspublishing.org/
401
PEOPLE: International Journal of Social Sciences ISSN 2454-5899
These are used by the researcher to know the learning satisfaction and experiences of the learners in an on-grade school. 2.4 Data Gathering and Analysis Procedure The researcher sought the permission of the school officials to conduct this assessment study. After which, the learning satisfaction survey was administered to the respondents for a period of one week. Concurrently, the researcher also requested for the relevant school records particularly the Summary of Learners’ Academic Performance (SLAP) to describe the learning outcomes of the learners. The second week of the data collection was spent for the interviews, both individuals and group, including focus group discussion participated by the higher level learners. The selected respondents who participated in the interviews and group discussions were selected on purpose to add depth to their responses on the questionnaire. The quantitative data which were collected which included learners‟ level of satisfaction and outcomes were summarized using descriptive statistics such as frequency, percentage, mean, and standard deviation. No statistical tests of inferences were carried out since it is an unnecessary action with respect on the purpose of the researcher. On the other hand, the qualitative data ware analyzed by transcribing the results of the conducted interviews and focus group discussions. Each time database were read, the researcher developed a deeper understanding about the information supplied by the participants. Qualitative researchers usually work with text when analyzing data; data can be transcribed in entirety or focus on selected sections. The challenge for qualitative researchers is to present a cohesive representation of the data, which can be „vast‟ and „messy‟ and needs to make sense of diverse viewpoints or complex issues (Noble & Smith, 2013).Thematic analysis was used to determine the ideas of the learners as revealed during the data gathering procedure.
3. Findings and Discussion 3.1 Perceived Strengths and Weaknesses of the Non-Graded System Table 1: Learners’ Perceived Strengths of the Non-Graded System Rank 1 2
Themes Less Academic Pressure Independent Learning & Improved Study Habits
© 2017 The author and GRDS Publishing. All rights reserved. Available Online at: http://grdspublishing.org/
Frequency 59 42 402
PEOPLE: International Journal of Social Sciences ISSN 2454-5899
3 4 5 6 7 8
More engaged & Deepen Learning Opportunity for Academic Advancement Non- Existence of Grades Individualized Learning Academic Freedom Opportunity to Correct Mistakes on the Tests
30 27 23 22 16 15
The perceived strengths and weaknesses of the non-graded system were identified by the learners. It can be noticed that the response of the students on their learning satisfaction were very similar on how the learners describe the system. According to the learners, the strengths of the non-graded system are (1) studying entails less academic pressure, (2) more engaged and deepen learning experiences, (3) independent learning and improved study habits (4) opportunity for academic advancement, (5) non-existence of grades, (6) individualized learning, (7) academic freedom, (8) opportunity to correct mistakes on the tests. Table 2: Learners’ Perceived Weaknesses of the Non-Graded System Rank 1 2 4 5
Themes Very Lax Environment Lacks of Motivation and Incentives Monitoring of Academic Performance Less Challenging Academic Tasks
Frequency 143 25 19 18
On the other hand, the perceived weaknesses are the following : studying in a non-graded system entailed (1) a very relax environment, (2) lacks of motivation and incentives., (3) not well monitored academic improvements, and (4) less challenging academic tasks. Based on the analysis of the responses of the learners, it raised conflicting reactions from the respondents in a way that for some, studying in a non-graded school entails less academic pressure, but to some, is the same reason why learners become less productive. It was also true to other themes where in for some learners, they are motivated to be more engaged and have deepen learning which is contradicting for some who claimed that there was less challenging academic tasks in the school. It was very evident that the identified strengths of the system are indeed the best features of the system that the school desires to be acknowledged by all the learners. However, it is worth mentioning that weaknesses of the system are the reasons of the © 2017 The author and GRDS Publishing. All rights reserved. Available Online at: http://grdspublishing.org/
403
PEOPLE: International Journal of Social Sciences ISSN 2454-5899
dissatisfaction of the learners to system and the periodic backlogs or academic deficiencies of the learners. 3.2 Level of Satisfaction of the Learners on the Non-Graded System The recorded over-all mean learning satisfaction of the learners was 4.73 in a scale consisting of six levels which implies that the learners, in general, were satisfied with all the learning domains. The learning satisfaction domain in which the learners have the highest mean is on the “values and attitude towards learning” which is 4.99 (satisfied) and lowest mean was recorded in the domain “learning environment which is 4.59. Table 3: The Level of Satisfaction of the Learners on the Non-Graded System Mean Level Satisfaction Instruction and Teaching Quality 4.74 Satisfied Learning Materials and Facilities 4.67 Satisfied Learning Outcomes 4.80 Satisfied Learning Environment 4.59 Satisfied Peer Relationship 4.66 Satisfied Values and Attitude Towards Learning 4.90 Satisfied Overall 4.73 Satisfied Area
of
The data further shows that the learners were satisfied in how their experiences in the non-graded system influence them that learning is a personal responsibility that promotes their independence. On the other hand, the learners were only somehow satisfied with the environment that provides less pressured and greater level of academic freedom in school. 3.3 The Learning Outcomes of the Learners in the Non-Graded System Table 4: Percentage of Promoted Learners for Academic Year 2015-2016 Subject Mathematics Science English Filipino Speech History Religion Music Health Arts
Grade 4
Grade5
Grade 6
Grade 7
Grade 8
Grade 9
98.00
Grade 10
Average
87.00
98.00
87.36
83.09
70.60
80.00
86.29
93.00
80.85
96.30
95.00
84.40
84.00
84.81
88.34
99.75
95.00
99.00
88.50
70.00
80.59
84.33
88.17
96.00
94.00
97.51
94.00
96.39
94.09
89.00
94.43
100.00
100.00
100.00
94.00
99.00
86.47
95.00
95.75
98.00
81.00
96.42
99.00
90.50
93.99
76.00
90.7
100.00
92.90
97.50
95.55
92.44
94.40
94.54
95.33
100.00
100.00
100.00
95.00
98.00
91.00
99.00
97.57
-
-
-
-
95.00
90.50
96.00
93.83
100.00
100.00
100.00
99.00
90.00
85.00
97.00
95.86
© 2017 The author and GRDS Publishing. All rights reserved. Available Online at: http://grdspublishing.org/
404
PEOPLE: International Journal of Social Sciences ISSN 2454-5899
PE TLE Computer Robotics Average
100.00
100.00
100.00
98.00
91.00
91.00
94.00
96.29
100.00
92.85
98.00
98.00
89.50
93.13
93.59
95.01
94.00
93.00
98.00
83.39
86.30
81.97
91.03
89.67
100.0 98.37
100.00 93.58
100.00 98.52
99.00 94.29
100.00 90.40
97.00 88.12
99.00 90.95
99.29 93.32
*Source: Summary of Learners‟ Academic Performance (2015-2016)
Table 5: Percentage of Promoted Learners for Academic Year 2016-2017 Subject
Grade 4
Grade5
Grade 6
Grade 7
Grade 8
Grade 9
Grade 10
Average
Mathematics
100.00
98.14
99.00
89.20
97.14
78.30
86.58
92.62
Science English Filipino Speech History Religion Music Health Arts PE
100.00
99.00
99.00
82.00
95.00
96.00
83.00
93.43
99.39
100.00
100.00
78.53
79.54
77.55
84.54
88.51
100.00
100.00
98.00
96.00
96.00
94.00
93.00
96.71
100.00
100.00
100.00
100.00
98.00
97.20
98.00
99.03
100.00
100.00
98.00
91.95
95.40
98.17
94.00
96.79
97.57
98.00
97.88
88.70
94.85
94.28
94.42
95.10
100.00
100.00
100.00
93.00
95.00
90.00
92.00
95.71
-
-
-
-
88.00
97.87
90.00
91.96
100.00
100.00
100.00
89.00
93.00
94.00
94.00
95.71
100.00
100.00
100.00
100.00
100.00
100.00
99.00
99.86
TLE Computer Robotics Average
100.00
100.00
100.00
91.00
92.52
97.00
97.00
96.79
95.00
97.00
98.00
86.00
90.00
89.00
87.00
91.71
100.00
100.00
100.00
100.00
100.00
99.52
99.52
99.86
99.38
99.40
99.22
91.18
93.89
93.06
92.29
95.27
*Source: Summary of Learners‟ Academic Performance (2016-2017)
The data on the learning outcomes for two academic years implies that the desired impact of the school is also very evident with 93.32% of the total learners in A.Y. 2015-2016 and 95.27% of the total learners in A.Y. 2016-2017 finished and completed all the academic requirements. This means that almost all the learners are promoted to the next level after their exposure to the non-grade system experiences. However, when the learners‟ accomplishments were analyzed periodically in a year, data showed that percentages of the learners who were accomplishing the set targets were quite lower than the percentages annually.
© 2017 The author and GRDS Publishing. All rights reserved. Available Online at: http://grdspublishing.org/
405
PEOPLE: International Journal of Social Sciences ISSN 2454-5899
Table 6: Percentages of Learners Who Have Sufficient Quarterly Accomplishment Subject
1st Quarter August 2016
2nd Quarter October 2016
3rd Quarter December 2016
4th Quarter February 2017
Average
Mathematics
68.75
67.53
69.06
72.08
69.36
Science
52.92
51.38
41.16
42.41
46.97
English
70.63
64.75
62.55
51.73
62.42
Filipino
81.97
64.24
50.92
73.03
67.54
Speech
78.78
59.54
72.75
56.21
66.82
History
76.25
71.23
67.54
61.86
69.22
Religion
64.77
55.07
56.21
55.04
57.77
Music
75.99
83.31
83.69
81.10
81.02
Health
77.54
75.98
76.70
25.55
63.94
Arts
100.00
72.37
100.00
100.00
93.09
PE
100.00
100.00
100.00
100.00
100.00
TLE
71.08
73.95
59.46
69.58
68.52
Computer
67.95
44.05
29.75
40.34
45.52
Robotics
100.00
94.84
100.00
92.84
96.92
Average
68.75
67.53
69.06
72.08
69.36
*Source: Summary of Learners‟ Academic Performance (2016-2017)
Because of the self-paced and individualized learning feature of the system, the researcher also made an analysis of the quarterly performance of the learners to give the readers the idea of the pacing of the learners and how well they comply to the set standards of their facilitators in every PFC. However, results showed that the average percentage of the total learners who were in acceptable pacing is only 70.65%. Data also showed that there were even subjects wherein only 30% of the total learners in that level who performed well. This means that there were a number of learners who were not complying with the set target which also implies that there were also learners who were taking advantage of the self-paced mode of learning. 3.4 Learners’ Changed Behavior as a Result of their Experiences in the Non- Graded System The changes in the behavior of the learners as a result of their experiences in the nongraded system were also identified during the conducted interviews and focus group discussions. It is remarkable that there are four positive changes in their behavior against one identified © 2017 The author and GRDS Publishing. All rights reserved. Available Online at: http://grdspublishing.org/
406
PEOPLE: International Journal of Social Sciences ISSN 2454-5899
negative behavior. The positive behaviors were (1) increased self-reliance, (2) increased selfesteem; (3) improved patience, and (4) improved appreciation towards studying while the negative effect on their behavior is the fact that some learners become lenient in accomplishing their academic responsibilities.
4. Conclusion The strengths of the non-graded system as perceived by the learners were
the
environment that entails less academic pressure, more engaged and deepen learning experiences, independent learning and improved study habits, opportunity for academic advancement, nonexistence of grades, individualized learning, academic freedom, and opportunity to correct mistakes on the tests while the weaknesses are the lax environment, lacks of motivation and incentives, not well monitored academic improvements, and (d) less challenging academic tasks. The learners were very satisfied on the fact that the non-graded system promotes independence while the learners felt somewhat satisfied on the fact that the non-graded system entailed a very relax and less academic pressure environment and on the fact that the learners respect each other. In general, the learners are satisfied, on all facets of the non-graded system. The learning outcomes of the learners of the non-graded school for two academic years 2015-2016 and 2016-2017 were highly acceptable. However, periodical accomplishment that focused on the pacing of the learners shows that there were an estimated 30% of the learners who had academic deficiencies. The positive changes in the behavior of the learners as a result of their learning experiences in the non-graded school were the increased self-reliance, self-esteem; improved patience, and appreciation towards studying while the negative effect on their behavior was the fact that the learners became lazy and less productive. In reference to the previous studies conducted to describe the learning outcomes and behavior of the learners in non –graded schools (Pavan, 1997 and Gutierrez & Slavin, 1992) ,the positive results on the academic achievement and behavior of the learners were comparable. The assessment of the non-graded system based on learning satisfaction, experiences, and outcomes of the learners showed evidence that the impact of the system is felt and very apparent. However, there were identified areas that need to be improved especially the standpoint where learners became relax, lazy, and less productive.
© 2017 The author and GRDS Publishing. All rights reserved. Available Online at: http://grdspublishing.org/
407
PEOPLE: International Journal of Social Sciences ISSN 2454-5899
Improvement of the system may include streamlining the delivery of curriculum and instruction with focus on facilitating learners‟ performance. There is also a need to strictly improve the periodic monitoring of learners performance. 4.1 Scope of Future Researches Since the assessment of the non-graded system was made solely on the level of the learners, it is strongly suggested to conduct further studies which focus on involving the other stakeholders like the teachers, school administrators, and parents. The utilization of comprehensive sources of school documents is also suggested. Also, method of triangulation should be employed using multiple data sources for a more thorough investigation. While the summary of the learners‟ academic performance was used in the study to describe the learning outcomes of the learners, results of standardized tests should be included in future studies to measure and describe the quality of learning outcomes of the learners. Finally, make use of other evaluation models in order to capture other important concerns and viewpoints about the non-graded system of education.
References Ball, T. (2002). The non-graded continuum. Free to learn: The Journal of the Multiage Association of Queensland, 8(1), 2-5. Creswell, J. (2012). Educational research. Pearson Education, Inc., Evanshen, P. (2001). An analysis of configurations in a non-graded elementary school in northeast
Tennessee.
East
Tennessee
State
University.
Retrieved
from
http://dc.etsu.edu/cgi/viewcontent.cgi?article=1126&context=etd Guttierez, R. & Slavin, R. (1992). Achievement effects of the non-graded elementary school: A best evidence synthesis .Sage Journals Vol.62, Issue 4 Kreide, A. (2011). Literacy achievements in non-graded classrooms. Loyola Marymount University. Retrieved from https://eric.ed.gov/?id=ED533133 Myers, P. & Barnes, J.(2005). Measuring outcomes: guidance on outcome evaluation for sure start local programs. Institute for the Study of Children, Families and Social Issues, Birkbeck,
University
of
London.
Retrieved
from
http://www.ness.bbk.ac.uk/support/GuidanceReports/documents/1190a.pdf Nagle, B., & Williams, N.(1999). Methodology brief: Introduction to focus groups. Center for Assessment, Planning and Accountability. 1-12. © 2017 The author and GRDS Publishing. All rights reserved. Available Online at: http://grdspublishing.org/
408
PEOPLE: International Journal of Social Sciences ISSN 2454-5899
Noble, H. & Smith, J. (2013). Qualitative data analysis: Practical analysis. BMJ Journals Pavan, B. N. (October, 1977). The benefits of non-graded schools. Educational Leadership. Retrieved
from
http://www.ascd.org/publications/educationalleadership/oct92/vol50/num02/
The-
Benefits-of-Nongraded-Schools.aspx Quinn M. & Porier J. (2006).Study of effective alternative education: Final Grant Report. American Institutes for Research (2006) Sliwka
A.
(2008).
The
contribution
of
alternative
education.
Retrieved
from
http://www.oecd.org/edu/ceri/40805108.pdf Stufflebeam, D. et. al. (2000).Evaluation models: Viewpoints on educational and human services evaluation. Springer Science and Business Media Tullis R. et. al (1990).An evaluation of the non-graded primary learning communities program. Institution of Houston Independent School District, TX. Dept. of Research and Evaluation.
© 2017 The author and GRDS Publishing. All rights reserved. Available Online at: http://grdspublishing.org/
409