Nov 5, 2012 - Molde University College, Molde, Norway. ** Graduate ... of stops, arcs and tours of VRP solutions, our measure can handle most extensions to.
Decision Making in Manufacturing and Services Vol. 6 • 2012 • No. 2 • pp. 65–83
Special Issue on Optimization in Supply Chain Management
An Attribute Based Similarity Function for VRP Decision Support Arne Løkketangen� , Johan Oppen� , Jorge Oyola� , David L. Woodruff��
Abstract. When solving problems in the real world using optimization tools, the model solved by the tools is often only an approximation of the underlying, real, problem. In these circumstances, a decision maker (DM) should consider a diverse set of good solutions, not just an optimal solution as produced using the model. On the other hand, the same DM will only be interested in seeing a few of the alternative solutions, and not the plethora of solutions often produced by modern search techniques. There is thus a need to distinguish between good solutions using the attributes of solutions. We develop a distance function of the type proposed in the Psychology literature by Tversky (1977) for the class of VRP problems. We base our difference on the underlying structure of solutions. A DM is often interested in focusing on a set of solutions fulfilling certain conditions that are of specific importance that day, or in general, like avoiding a certain road due to construction that day. This distance measure can also be used to generate solutions containing these specific classes of attributes, as the normal search process might not supply enough of these interesting solutions. We illustrate the use of the functions in a Multiobjective Decision Support System (DSS) setting, where the DM might want to see the presence (or absence) of certain attributes, and show the importance of identifying solutions not on the Pareto front. Our distance measure can use any attributes of the solutions, not just those defined in the optimization model. Keywords: Solution Variety, Solution Similarity, Vehicle Routing Problem (VRP), DSS Mathematics Subject Classification: 91–08 Revised: November 5, 2012 � ��
Molde University College, Molde, Norway Graduate School of Management, UC Davis, Davis Ca 95616 USA
DOI: http://dx.doi.org/10.7494/dmms.2012.6.2.65
65
66
1.
A. Løkketangen, J. Oppen, J. Oyola, D.L. Woodruff
INTRODUCTION
The family of Vehicle Routing Problems (VRP), constitute a diverse and at the same time practically important family of problems. Many organizations solve VRPs daily or even more often. Instances of many of the different forms of the VRP are commonly solved manually, or by some tool that is often optimization-based and embedded in a DSS. Common features of the VRP are usually that each instance is defined by a series of n stops that must be served by some number of vehicles using a shared depot where all routes start and end, and that there are resource constraints, the most common being a limited capacity on each vehicle. The goal of the VRP is then to find routes so as to minimize some function that depends on things such as the cost of making deliveries using the chosen routes, the number of vehicles needed, etc. In Toth and Vigo (2002) a variety of extensions to the classical VRP are described, some of which are usually required in order to make the VRP rich enough, and thus suitable for modeling the real world problem at hand. For more information about rich VRPs see, e.g., Hartl et al. (2006); Oppen et al. (2010). Our goal in this paper is the specification of similarity measures between solutions to a VRP instance. These functions should be based on some measure apart from the objective function value of the solutions. Our function is based on the structural difference between the solutions, because this is what a human dispatcher bases her valuations of difference on. We produce measures of difference of the type proposed in the Psychology literature by Tversky (1977). We also show how these measures can be extended by including solution attributes not explicitly modeled in the underlying optimization tool. For convenience, we will define the output of the similarity functions on the range zero to one. This means that they can be subtracted from 1 to yield a distance function. We emphasize that we have no interest in describing optimization methods in this paper, we simply provide means to measure the similarity between two VRP solutions. It should also be stated that because we base our measure on the attributes of stops, arcs and tours of VRP solutions, our measure can handle most extensions to the classical VRP model, thus making it suitable for embedding in a real-world DSS. Such distance measures can have many applications. The focus of this paper is their use in a DSS to help a decision maker (DM). The DM might want to see multiple good solutions that are different. We presume that an objective function and the problem constraints determine the meaning of “good.” We give methods here for quantifying the notion of “different,” based on the solution structures. Such a measure, based on the difference between the solution attributes is also of high value in Multi Criteria Optimization, MSO, as shown in Løkketangen and Woodruff (2005). The opposite use is in plan recovery, where the original plan has to be abandoned due to some unforeseen event, e.g., a breakdown or accident. Here, the DM wants a new plan that deviates as little as possible from the original. There is a similar concern when trying to make robust plans, where small changes in the input should give as little disruption as possible to the original plan, see e.g. S¨ orensen (2006). If one observes that similarity is complimentary to difference, the same measure can of course be used for this purpose also.
An Attribute Based Similarity Function for . . .
67
There are other uses for diversity measures. For example, in search algorithms such as scatter search ((Laguna and Marti, 2003) or genetic algorithms (Reeves, 2003) it is assumed that a variety of solutions are available. In some cases, random construction can reasonably be assumed to create variety, but in highly constrained settings it might be important to verify that solutions are in fact mutually distant (see S¨ orensen and Seveaux, 2006). In local search based meta-heuristics such as tabu search (Glover and Laguna, 1997), there are several uses. The most obvious is as a diversity measure, to make sure that the search has moved to a significantly different part of the search space. A distance function can also be used in a constructive heuristic, to make sure that the newly constructed solutions are sufficiently different from earlier solutions to justify launching a local search from the new solution. A DM is often interested to focus on a set of solutions fulfilling certain conditions that are of specific importance that day, or in general, like avoiding a certain road due to road-works that day, or, making sure that the routes are sufficiently similar (for fairness reasons). The normal search process might not supply enough of these interesting solutions. Our distance measure can also be used in a multi-criteria optimization setting, to generate more of solutions containing “sufficient” levels of certain attributes. Since the words “similarity” and “distance” are complimentary, the literature for computing values for them is intertwined. We will use the terms similarity and distance function in their broad, intuitive sense. This introduction is followed by Section 2, which gives examples of other distance measures in the literature. Section 3 gives an introduction to Tversky’s similarity measure that we use as a basis for our distance measures, and in Section 4 our distance measures are defined. We then show examples in Section 5. A description of computational experiments illustrating our methods is in Sections 7 and 6. The final section offers conclusions.
2.
OTHER DISTANCE MEASURES
The need for measuring distances between solutions is not new, and many metrics have been suggested. The Euclidean distance is, of course, not directly applicable to permutation vectors representing routing order. Our discussion here will be restricted to functions that measure the distance between solutions represented as permutation, as this is the common way to represent solutions to routing problems like the VRP and TSP. We highlight here a few distance measures from the literature, even though they all were designed for other purposed so that differences in the tour structure and other attributes are not addressed properly for use in a DSS. They are typically applied within an algorithm that is searching for good solutions. Exact Match Distance. This can also be called the hamming distance (Hamming, 1950) for permutations (see Ronald, 1998); the distance is the number of positions that are different in the two solutions. If S and T are the two solutions, then the
68
A. Løkketangen, J. Oppen, J. Oyola, D.L. Woodruff
distance between them is given by the following formula � N � 0 if S(i) = T (i) xi where xi = dem (S, T ) = 1 otherwise i=1
(1)
The Deviation Distance. This is also called “Spearman’s footrule”. The measure here is based on the sum of the total deviation of all items between the two strings (see Ronald, 1998). ddev (S, T ) =
N �
|i − j| where T (j) = S(i) = k
(2)
k=1
Bontoux-Feillet Distance. This measure is defined in Bountoux and Feillet (2005) for a Traveling Purchaser Problem. Here the distance between two solutions is defined to be the quotient of the number of markets (i.e. nodes) in the symmetric difference between the two solutions, divided by the number of markets in the union of the two solutions. The Edit Distance. Given three edit operations (add, delete and substitute). The edit distance (also called the Levenshtein distance) is then the minimum number of operations to transform string S into string T (see Seveaux and S¨ orensen, 2005; Wagner and Fisher, 1974; S¨ orensen, 2007). This measure is more a search space distance than a solution space distance, as the edit operations can be considered neighborhood operations. The Reversal Distance. This is the number of substring reversals required to transform string S into string T (see Caprara, 1999). This measure is important in molecular biology. Apart from the Bontoux-Feillet distance, these functions are designed to operate on permutations without regard to their perception by a DM as a VRP. An important objective for our distance function is to be able to produce an explanation of the differences that is understandable to a DM using attributes of a VRP solution. We also go beyond the attributes of solutions that are used in the optimization process. The Bontoux-Feillet Distance is for a single tour, and is similar to the Tversky ratio that we now describe. That distance is specialized for the traveling purchaser problem, while we will introduce a distance function specialized for VRPs. 3.
TVERSKY’S SIMILARITY MEASURE
We begin our investigation with a ratio version of Tversky’s similarity measure (Tversky, 1977). This ratio has been widely used to measure similarity and there is extensive discussion of its properties in the psychology literature (Goertzel, 1997; Medin et al., 1993). It has been used in diverse contexts such as spam detection (Dimmock and Maddison, 2004) and clustering (Ryu and Eick, 2005). For two non-empty sets A and B, define |A ∩ B| J(A, B) ≡ |A ∩ B| + |A − B| + |B − A|
An Attribute Based Similarity Function for . . .
69
where |A| denotes the cardinality of set A. It is well known that 1 − J(·) is a semimetric; i.e., it satisfies the definition of a metric apart from, perhaps, the triangle inequality. We will base our similarity measures on generalizations of the ratio given by J(·). Insights into creation of a generalization can be gleaned by considering the literature on two related problems: comparing vectors of categorical data and comparing sets of categorical data. This work has been extended to consider comparisons of vectors of sets of data, which is not our current problem but it is close enough so that solutions to it are instructive. A unifying proposal for vectors of sets and a nice summary of related work is provided by Ryu and Eick (1998). 4.
METHODS FOR COMPARING VECTORS, SETS OF VECTORS AND VECTORS OF SETS OF VECTORS
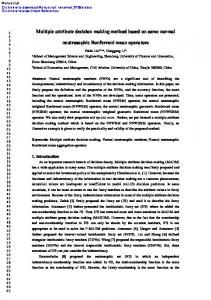
Our interest here is strictly in the similarity and difference between solution, not optimization, per se. We can assume that all the solutions we look at are good enough, that is, the objective function value is within some fraction of the best found, or some other threshold. Additionally, it should also be stressed that similarity is not the same as visual pattern matching. This is exemplified in Figure 1, where the two solutions may look very similar, but in fact may be very different in terms of the attributes of interest to the DM.
Fig. 1. Two Distinct VRP Solutions.
A solution to a VRP instance consists of a collection of vehicle routes that traverse some of the arcs to serve all the stops included in the instance. Each stop, each potential arc, (whether included in the solution or not), and each tour has associated with it a vector of attributes. Given the attribute vectors of two stops, two arcs or two routes, we want to compute the similarity between them. The elements of an attribute vector might be categorical, binary, measured, or might even be sets. A unique identifier of the stop, the arc or the tour needs to be included in the attribute vector and treated as categorical data. This is to avoid a situation where, e.g., two different stops with identical sets of attributes are compared and their similarity is computed to be 1.
70
A. Løkketangen, J. Oppen, J. Oyola, D.L. Woodruff
Our similarity functions are based on the attributes of the solutions. Before getting into the formalisms, we can get intuition by thinking of VRP solutions from the point of view of each stop. Each stop is on a tour, hence for each stop there is a set of other stops that are on the same tour, a set of arcs that are in the tour and a vector of attributes for the tour itself. Given sets of stops, sets of arcs and attributes of tours for a given stop, we want to compute the similarity between the tour this stop is on in one solution and another. Once we have the similarity for each stop we can compute the similarity between solutions by summing the similarity over the stops. In order to build up the similarity function, we need functions to find the similarity between vectors, sets of vectors, and vectors of sets of vectors. The vectors correspond to single stops, arcs or tours, the sets of vectors correspond to sets of stops or arcs that share the same tour. Finally, the vector of sets of vectors correspond to a complete solution for a VRP instance, viewed from the point of view of each stop. Løkketangen and Woodruff (2005) developed a method for finding the distance between sets of vectors, where each vector in the set gives the attributes of that member of the set. We use their method as a basis for our similarity function. In order to generalize Tversky’s function, Løkketangen and Woodruff generalized the intersection using a function h(·) and the difference using a function g(·); these functions are described in Subsection 4.2. The functions, in turn, require functions to compare attribute vectors which we obtained based on the work of Ryu and Eick; this is described in the next subsection. In Section 5 we give a method of representing VRP solutions so that differences between them can be computed. Subsequent sections give an example and some computational experience. 4.1.
COMPARING ATTRIBUTE VECTORS
For two particular values of vector element j, let the function ηj (·) take values on [0, 1] corresponding to the dissimilarity between the two attribute values. For a measured attribute, ηj (·) should provide a continuous measure of dissimilarity scaled by the variability as measured across all potential measurements or some other set of interest. For example the distance between vectors x and y attributed to element j is, � � |xj − yj | ηj (x, y) ≡ min 1, sj where sj is a measure of the dispersion of the values for attribute j; we have in mind the standard deviation, but other measures of dispersion could be used. We assume that 0/0 is zero. Scaling by the dispersion puts the difference on the same scale in terms of deviation regardless of the original scale of the values. For categorical attributes, including binary attributes, difference is replaced by an indicator of inequality so it will take the value zero or one. If any of the vector elements are sets, then a function such as Tversky’s can be used. We then define p p � � ηj (x, y)wj )/( wj ) δ(x, y; w) ≡ ( j=1
j=1
An Attribute Based Similarity Function for . . .
71
to be a measure of dissimilarity between vectors x and y. Here, p is the number of vector elements (attributes) and w is an optional vector of user-specified weights giving the relative importance of the different attributes. 4.2.
COMPARING SETS OF VECTORS
In Løkketangen and Woodruff (2005) functions are developed that allow for a generalization of the Tversky difference function given in Section 3 to compare two sets of vectors. Given two sets A and B, � � g(A, B; w) ≡ δ(k, k� ; w)/|B| k∈(A−B) k� ∈B
provides a generalization of |A − B|. Observe that if the vector size is one and all vector elements are treated as categorical variables (i.e., A and B are sets), then g(A, B; w) = |A − B| as shown in Løkketangen and Woodruff (2005). This extends to binary set elements if the range is used to scale δ. The numerator in Tversky’s ratio as given in Section 3 is the cardinality of A∩B. One can make use of the fact that for simple sets, |A∩B| = |A|−|A−B| = |B|−|B−A|. Since, in general, |A|−g(A, B; w) �= |B|−g(B, A; w), to obtain symmetry we use both in our bounding approximation to |A ∩ B|, namely h(A, B; w) ≡ (|A| − g(A, B; w) + |B| − g(B, A; w))/2 As with g(·), h(w, A, B) = |A ∩ B| if A and B are simple sets and w is a vector of ones. This enables extension of Tversky’s similarity ratio to compute dissimilarity between sets of vectors. Define d(A, B; w) ≡ 1 −
h(A, B; w) h(A, B; w) + g(A, B; w) + g(B, A; w)
(3)
The function d(·) that we have given offers the advantage over the Tversky ratio that instead of simply using the number of elements in the difference sets, the δ(·) function is used to find out how different they are. In the next section we show how these functions, originally developed for portfolio optimization problems, can be extended to rich VRP solutions. 5.
AN ATTRIBUTE BASED MEASURES FOR SIMILARITY BETWEEN VRP SOLUTIONS
In a VRP setting, several different attributes for stops, arcs and tours might be of interest for doing comparisons: – For stops, attributes of interest could be related to accessibility (parking, maneuvering, loading/unloading facilities etc.), time windows, type and amount of load picked up or delivered.
72
A. Løkketangen, J. Oppen, J. Oyola, D.L. Woodruff
– For arcs, attributes could include length, road quality (number of lanes, type of pavement, average altitude, slope, curves etc.), average travel time, travel time variations (rush hours, ferry routes etc.). – Tours could be characterized by day/time for the tour, vehicle and driver. In some applications, it might also be of interest to measure the importance of the tour. If e.g. production and/or inventory constraints are involved, a tour would be important if the goods picked up on the tour is critical to keep the production process from stopping and less important if the load from the tour is put into inventory for use the next day. The attributes listed here are meant only as examples; the actual attributes used could be fewer or more and have to be decided based on the application at hand. Note also that a unique identifier is always included as an attribute, and that many of these attributes might not be used in the optimization model. Consider the following solution representation that leads to a fairly compact expression of our similarity function. Order the stops (arbitrarily) and index them from 1 to n; we will then use vectors of length n referred to as n-vectors. Given a solution X, we can represent it in a way that is useful for our purpose. Represent X ˆ X ˜ and X, ¯ where X ˆ and X ˜ are n-vectors of sets and X ¯ is an n-vector. by X, ˆ In X, each vector element i corresponds to a particular stop and gives the attributes of the stops that share the route with i, omitting stop i and the depot. ˜ gives the atThe arc representation of a solution we will use is analogous: X tributes of the arcs that are on the route of each stop. ¯ i , gives the attribute vector of the tour that stop i is The third representation, X on. We can now give an abstract definition of distance for two VRP solutions represented as X and Y that generalizes the Tversky function: 1� ˆ ˆ 1� ˜ ˜ 1� ¯ ¯ d(Xi , Yi ; w) ˆ +β d(Xi , Yi ; w) ˜ +γ δ(Xi , Yi ; w). ¯ n i=1 n i=1 n i=1 n
t(X, Y ) ≡ α
n
n
where the parameters α, β and γ control the relative importance of stops, arcs and tours, respectively. The sum of these three parameters should equal one to have the function take values on [0, 1]. The vector w ˆ gives the weights for the different attributes of stops, while w ˜ and w ¯ give the weights for attributes of arcs and tours, respectively. 6.
EXAMPLE
To illustrate the computations, we will make use of a very small example with five stops and three vehicles. For this example, we associate with each stop three attributes: the stop number, the number of pallets to pick up and a binary variable indicating whether the vehicle has to park in the street or not while loading. With each arc we associate its (origin, destination) pair of nodes, the arc length and number of lanes, and with each route we associate the number of the vehicle performing the route.
An Attribute Based Similarity Function for . . .
73
We will make use of two solutions: – E: stops one, four and five are the route for vehicle one; stops two and three are the route for vehicle two. – F : stops five and three are the route for vehicle one; stops two, one and four are the route for vehicle three. Table 1. Attributes for VRP example. Stop attributes:
Arc attributes:
Stop
Pallets
Street parking
Arc
Length
Lanes
1
3
No
0-1
20 km
2
2
3
Yes
0-2
10 km
2
3
4
No
0-3
20 km
2
4
1
Yes
0-4
5 km
1
5
5
No
0-5
10 km
2
1-2
25 km
4
1-3
40 km
2
1-4
15 km
4
1-5
25 km
4
2-3
15 km
4
2-4
15 km
1
2-5
20 km
2
3-4
25 km
1
3-5
20 km
2
4-5
10 km
4
Table 1 gives the attributes for the stops and the arcs in our small example. Even though some of the arcs are not used in any of the two solutions listed here, their attributes are given because they may be used in some solution. Note also that vehicle one is the only vehicle used in both solutions. The actual tours can be visualized as in Figure 2. ˆ1 gives the attributes of the stops that share So for the small example given, E a route with stop one in this solution so it is {(4, 1, Yes), (5, 5, No)} because in solution E, stop one shares the route with stops four and five. The other elements of ˆ can be constructed in the same way, so E ˆ2 = {(3, 4, No)}, E ˆ3 = {(2, 3, Yes)}, E ˆ4 E ˆ ˆ = {(1, 3, No), (5, 5, No)}, and E5 = {(1, 3, No), (4, 1, Yes)}. This is repeated for F , so Fˆ1 = {(2, 3, Yes), (4, 1, Yes)}, Fˆ2 = {(1, 3, No), (4, 1, Yes)}, Fˆ3 = {(5, 5, No)}, Fˆ4 = {(1, 3, No), (2, 3, Yes)}, and Fˆ3 = {(5, 5, No)}. ˜ gives the attributes The arc representation of a solution we use is analogous, X ˜ 1 = {((0 − of the arcs that are on the route of each stop. If X represents solution E, X ˜ 1), 20, 2), ((1−4), 15, 4), ((4−5), 10, 4), ((5−0), 10, 2)} and X2 = {((0−2), 10, 2), ((2− 3), 15, 4), ((3 − 0), 20, 2)}.
74
A. Løkketangen, J. Oppen, J. Oyola, D.L. Woodruff 1
1
4
4 2
5
2
5
3
3 Order Size 1
2
3
4
5
Parking -Yes -No
Vehicle 1 2 3
Road Type 1 Lane 2 Lane 4 Lane
Fig. 2. Solutions E and F.
¯ i , gives the attribute vector of the tour that stop i The third representation, X ¯1 = 1 because we have defined so is on. Following our example, it means that, e.g., E few attributes for this simple, small example. Writing down the representations is tedious and doing the calculations by hand is treacherous, but the representations and calculations are easily programmed. To help the reader verify any such programming, we illustrate some of the calculations to complete the example by working backwards down one thread. We start with the distance between the stop attributes for the first stop: ˆ1 , Fˆ1 ; w) ˆ d(E that creates a need for generalized set differences for stops attributes, e.g.: � � ˆ1 , Fˆ1 ; w) ≡ δ(k, k � ; w)/|B|. g(E ˆ1 −Fˆ1 ) k� ∈Fˆ k∈(E
ˆ1 − Fˆ1 has only one member; the set difference is {(5, 5, No)} so The set E ˆ1 , Fˆ1 ; w) = δ(w, ˆ (5, 5, No), (2, 3, Yes)) + δ(w, ˆ (5, 5, No), (4, 1, Yes)) g(E To compute this, we need to compute δ function values. For example, with an importance weight vector of w ˆ given by the user: ˆ2 η2 (5, 3) + w ˆ3 η3 (No, Yes) δ(w, ˆ (5, 5, No), (2, 3, Yes)) = w ˆ1 η1 (5, 2) + w
An Attribute Based Similarity Function for . . .
75
The η function requires some value for the expected spread of each vector element. The first and third vector elements are categorical so since we do not have a full data set to use estimate a value, we will assume 1/2 rather than estimating it from the limited data we have. This results in, η3 (No, Yes) =
1 1/2
Since “No” differs from “Yes.” The value of η1 (5, 2) is also 2 because stop 5 is not the same as stop 2. The number of pallets for stops that we have (namely: 3,3,4,1, and 5) has a sample standard deviation of 1.48 so we use that for illustration purposes. This yields 5−3 η2 (5, 3) = 1.48 We note that it actually takes less time to write computer code for the distances in general than it takes to work through one full example by hand, even when the example is small. 7.
COMPUTATIONAL EXPERIMENTS
This section reports on computational experiments using the distance measure. Our example instance is from http://branchandcut.org/VRP/data (as are all of our examples). It has 5 vehicles and 32 customers. This has simple example to illustrate calculations has the following attributes. A stop has the customer ID given as a number and the customer demand, normalized by dividing with the capacity of the vehicle. The arcs are represented by the pair of end-point nodes, and the arc length. The tour attributes are just the number of the tour and the set of customers on the tour, as all vehicles are the same, and there are no operational costs associated with a vehicle. Table 2 shows 4 different, good solutions to the instance A-n32-k5. In Table 3 shows the distances between them assuming equal weights on solution attributes. The 4 solutions are shown graphically in Figures 3 ,4 ,5 and 6. It is evident that solutions A and B are similar. On the other hand, solutions C and D are very different. This is reflected in the pair-wise distances shown in Table 3. In order to illustrate the usefulness of our distance function t(X, Y ) for the VRP, we will look at this in a multi-criteria DSS setting (For an overview of multi-criteria optimization and VRP see Jozefowiez and Semet, 2008). This will show the usefulness of having a distance measure both for selecting between solutions to consider, and for generating solutions containing specific attributes. We show our results on a set of benchmark instances from the literature, modified for our multi-objective setting. A user might also want to ask: what makes two solutions different? and what are the important stops for determining the distance?. Because our distance function is decomposable by stop, it is easy to answer these questions. In other words, since t(X, Y ) is computed by summing over the stops, the contribution of each stop can be directly determined.
76
A. Løkketangen, J. Oppen, J. Oyola, D.L. Woodruff
Table 2. Different solutions to the instance A-n32-k5. Solution
Tour
A
B
C
D
Customers
1
30, 26, 28, 18, 22, 15, 29, 27
2
21, 31, 19, 17, 14, 24, 20
3
8, 13, 7, 16, 12
4
6, 3, 2, 23, 4, 11, 9
5
5, 25, 10, 1
1
30, 26, 23, 28, 18, 22, 15, 29, 27
2
21, 31, 19, 17, 14, 24, 20
3
8, 11, 13, 16, 12
4
7, 6, 3, 2, 4, 9
5
5, 25, 10, 1
1
30, 26, 31, 19, 23, 28, 18, 29, 27
2
12, 1, 21, 14, 24, 10, 20
3
15, 22, 8, 11, 13, 16
4
7, 6, 3, 2, 4, 9, 5
5
25, 17
1
29, 15, 10, 25, 5, 20
2
7, 21, 31, 19, 17, 13
3
23, 3, 2, 6, 30
4
14, 28, 4, 11, 8, 18, 9, 22, 27
5
12, 1, 16, 26, 24
Table 3. Solution Distances. A A
B
C
D
0.18
0.54
0.66
0.42
0.68
B
0.18
C
0.54
0.42
D
0.66
0.68
0.76 0.76
An Attribute Based Similarity Function for . . .
77
Fig. 3. Solution A to instance A-n32-k5.
Fig. 4. Solution B to instance A-n32-k5.
Fig. 5. Solution C to instance A-n32-k5.
Fig. 6. Solution D to instance A-n32-k5.
7.1.
SOLUTION DISTANCES AND λ DISTANCES
Our specific example will be in a DSS where the DM wants to be presented a small set of routes that are good w.r.t. the overall cost, and within the specified route difference threshold. We have implemented this in a solver based on Oppen and Løkketangen (2006) and Cordeau et al. (2001). This solver uses tabu search with an insert neighborhood and infeasibility penalties in the move selection function. The optimization algorithm design has been modified to work in a multi-objective setting, where the final objective is a linear combination of the individual objectives. This means that there is a control parameter λ (between 0 and 1) that gives the blend between the two objectives. Objtot = λ ∗ Obj1 + (1 − λ) ∗ Obj2 This blend may also be regarded as a policy. The goal in a multi-objective optimization setting is often to find the set of solutions that define the Pareto Front, PF
78
A. Løkketangen, J. Oppen, J. Oyola, D.L. Woodruff
(i.e. the set of undominated solutions). In practice there is a limit to both computational time and resources, so every point on the PF cannot be mapped. Also, with the weighted sum of the two objectives, concave regions of the PF may be undetected (Corne et al., 2000). A DM is also in general interested in implementing a policy, and not balance the different criteria dynamically. A typical result is shown in Figure 7, which was generated from 11 runs of our solver with λ ranging from 0 to 1 in 0.1 increments. We will call this λ-space.
Fig. 7. Pareto Front for instance A-n32-k5.
It is very easy to imagine that a large distance between solutions in λ-space (measured in λ) corresponds to a large differences between solutions, and vice-versa. This is not necessarily the case. In Table 4 are shown the distances between the solutions E, F and G for instance A-n32-k5. The λ-values used were E = 0.0, F = 0.1 and G = 1.0. Table 4. Solution Distances – Multi Objective – A-n32-k5 E E F
0.76
G
0.70
F
G
0.76
0.70 0.64
0.64
An Attribute Based Similarity Function for . . .
79
The solutions are shown graphically in Figures 8, 9 and 10. The distance between solutions E and F in λ-space is much smaller than the distance between solutions E and G. (0.1 compared to 1.0). Even so, the difference in solution space is larger between solutions E and F, than between solutions F and G. This illustrates the importance of having the difference measure in solution space.
Fig. 8. Solution E to instance A-n32-k5.
Fig. 9. Solution F to instance A-n32-k5.
Fig. 10. Solution G to instance A-n32-k5.
Table 5 shows the correlation between the solution distances for a set of quite different instances from http://branchandcut.org/VRP/data. Both linear (Pearson) and rank (Spearman) correlations are shown. All the numbers are below 0.5, which can be understood as small or medium.
80
A. Løkketangen, J. Oppen, J. Oyola, D.L. Woodruff Table 5. Correlation between distances in solution space and λ space.
7.2.
Instance
Pearson
Spearman
A-n36-k5
0.37
0.37
A-n37-k6
0.29
0.26
A-n45-k7
0.31
0.29
A-n60-k9
0.41
0.40
A-n80-k10
0.46
0.42
B-n41-k6
0.32
0.30
B-n57-k9
0.42
0.39
P-n70-k10
0.22
0.19
P-n101-k4
0.18
0.16
E-n76-k10
0.37
0.34
G-n262-k25
0.44
0.37
M-n200-k17
0-49
0.44
USING A THRESHOLD
As stated above, a given value for λ (in our two-objective setting) corresponds to a given policy, or balance between the criteria. Such a policy is often implemented as a threshold value for a given objective. In our example, a threshold on the route balance would correspond to a statement like: “The maximum difference in duration between two routes is 30 minutes.” This corresponds to saying that solutions fulfilling this policy are of interest, and the most desirable are the solutions on, or near, the PF that fulfill the criteria, and therefore have a ”good enough” solution value w.r.t. the overall route length. This thus corresponds to a section of the PF graph. In Figure 11 this is indicated as follows. The overall Pareto Front is indicated by the curved line. The DM indicates preferences using lines on the PF graph. The route balance policy is indicated by the vertical dotted line. The horizontal dotted line indicates the minimum desired solution quality. The set of optimal solutions will the be on the PF between A and B. (If the route balancing objective had is implemented as a constraint, then only the point A will be produced). As we are interested in a portfolio of different, but good, solutions, we will find these between A and B. These solutions are not necessarily positioned only on the PF, but can also be a dominated solution that is close, as indicated by X. We call the set of solutions containing such dominated solutions for the set of good solutions. Table 6 shows the 95% confidence interval for the difference between the average distance obtained from the set of good solutions and similarly from the non-dominated solution set, for a set of the benchmark problems. As can be seen, there is no evidence to say that the average distances between the solutions in the good solutions set are not greater than those in the non-dominated solutions set. The solution having Best length corresponds to the point A in Figure 11.
An Attribute Based Similarity Function for . . .
81
��� � �����
������
����� �����
��� � �����������
�
�
������ ������
Fig. 11. Threshold and the Pareto Front.
Table 6. Solution difference test. Instance A-n36-k5 A-n37-k6 A-n45-k7 A-n60-k9 A-n80-k10 B-n41-k6 B-n57-k9 P-n70-k10 P-n101-k4 E-n76-k10 G-n262-k25 M-n200-k17
2 Most Different Lower Upper 0.03 0.01 0.01 0.01 0.01 0.01 0.02 0.01 0.02 0.01 0.02 0.03
0.04 0.03 0.03 0.02 0.02 0.03 0.03 0.03 0.05 0.04 0.03 0.05
Best length Lower Upper 0.02 0.01 0.00 0.00 0.01 0.01 0.01 0.01 0.02 0.00 0.02 0.03
0.04 0.03 0.03 0.02 0.02 0.03 0.02 0.03 0.05 0.03 0.03 0.04
We can say that including dominated solutions in the set to give to the DM will increase the diversity of the presented solutions. This is, according to previous considerations, something that could be of interest for the DM. The results presented here are intended only as illustrative examples. If attribute weights or the objective function value limit are changed, the results will be different. In practice, attribute weights and other parameters have to be set by the DM based on their preferences for the application at hand.
82
8.
A. Løkketangen, J. Oppen, J. Oyola, D.L. Woodruff
CONCLUSIONS
A decision maker (DM) is often more interested in a set of different, good solutions to their problem, rather than just the (optimal) solution produced by a tool, using a simplified model of the underlying real world problem. On the other hand, the same DM will only be interested in seeing a few of the alternative solutions, and not the plethora of solutions often produced by modern search techniques (see Dana and Woodruff, 2009). We have developed an attribute based distance function for use in a DSS for rich, real world, VRP problems. Based on Tversky’s well-known similarity ratio, the function makes use of the tour structure and other attributes of the solution. Of particular importance is that the suggested difference measure also can use solution attributes that are not explicitly modeled in the underlying optimization tool. We have used this function in a multi-objective setting to produce diverse sets of solutions having specific attributes that are of interest for the DM in a particular planning situation. The examples shown illustrate that using a solution difference measure for selecting solutions to display based on the structure and attributes of the solutions gives more varied solutions for the DM to choose from. REFERENCES Bountoux, B., Feillet, D. (2005), Ant colony optimization for the traveling purchaser problem. Working paper. Caprara, A. (1999), Sorting permutations by reversals and eulerian cycle permutations. SIAM Journal on Discrete Mathematics, 12(1),91–110. Cordeau, J.-F., Laporte, G., Mercier, A. (2001), A unified tabu search heuristic for vehicle routing problems with time windows. Journal of the Operations Research Society, 52, 928–936. Corne, D., Knowles, J., Oates, M. (2000), The pareto envelope-based selection algorithm for multiobjective optimization. In Schoenauer, M., Deb, K., Rudolph, G., Yao, X., Lutton, E., Merelo, J., and Schwefel, H.-P., editors, Parallel Problem Solving from Nature PPSN VI, volume 1917 of Lecture Notes in Computer Science, pages 839–848. Springer Berlin / Heidelberg. Dana, E., Woodruff, D. (2009), How to select a small set of diverse solutions to mixed integer programming problems: Good news and bad news. Operations Research Letters, 37:255–260. Dimmock, N., Maddison, I. (2004), Peer-to-peer collaborative spam detection. Crossroads, 11, 4–4. Glover, F., Laguna, M. (1997), Tabu Search. Kluwer academic publishers. Goertzel, B. (1997), From Complexity to Creativity: Explorations in Evolutionary, Autopoietic, and Cognitive Dynamics. Kluwer, Dordrecht. Hamming, R. (1950), Error-detecting and error-correcting codes. Bell System Technical Journal, 29(2), 147–160. Hartl, R., Hasle, G., Janssens, G. (2006), Special issue on rich vehicle routing problems. Central European Journal of Operations Research, 14, 103–104. Jozefowiez, N., Semet, F. (2008), Multi-objective vehicle routing problems. European Journal of Operations Research, 189, 293–309.
An Attribute Based Similarity Function for . . .
83
Laguna, M., Marti, R. (2003), Scatter Search: Methodology and Implementations in C. Kluwer Academic Publishers. Løkketangen, A., Woodruff, D. (2005), A distance function to support optimized selection decisions. Decision Support Systems, 39, 345–354. Medin, D., Goldstone, R., Gentner, D. (1993), Respects for similarity. Psychological Review, 100, 254–278. Oppen, J., Løkketangen, A. (2006), Arc routing in a node routing environment. Computers and Operations Research, 33(4), 1033–1055. Oppen, J., Løkketangen, A., Desrosiers, J. (2010), Solving a rich vehicle routing and inventory problem using column generation. Computers and OR, pp. 1308–1317. Reeves, C. (2003), Genetic algorithms. In Glover, F. and Kochenberger, G., (eds.), Handbook of Metaheuristics, pp. 55–82, Kluwer Academic Publishers. Ronald, S. (1998), More distance functions for order based encodings. In Proceedings of the IEEE Conference on Evolutionary Computation, pp. 558–563, IEEE Press. Ryu, T., Eick, C. (1998), A unified similarity measure for attributes with set or bag of values for database clustering. In The 6th International Workshop on Rough Sets, Data Mining and Granular Computing (RSDMGrC’98). Ryu, T., Eick, C. (2005), A database clustering methodology and tool. Information Sciences, 171, 29–59. Seveaux, M., S¨ orensen, K. (2005), Permutation distance measures for memetic algorithms with population management. In Extended Abstract Book MIC 2005, Metaheuristic International Conference. S¨ orensen, K. (2006), Route stability in vehicle routing decisions: A practical approach using meta-heuristics. Central European Journal of Operations Research, 14, 193–207. S¨ orensen, K. (2007), Distance measures based on the edit distance for permutation type representations. Journal of Heuristics, 13, 35–47. S¨ orensen, K., Seveaux, M. (2006), MA – PM: Memetic algorithms with population management. Computers and Operations Research, 33, 1214–1225. Toth, P., Vigo, D., (eds.) (2002), The Vehicle Routing Problem. Society for Industrial and Applied Mathematics, Philadelphia. Tversky, A. (1977), Features of similarity. Psychological Review, 84, 327–352. Wagner, R., Fisher, M. (1974), The string-to-string correction problem. Journal of the Association for Computing Machinery, 21, 168–173.