AN AUDIODISPLAY TOOL FOR VISUALLY IMPAIRED PEOPLE : THE SOUND SCREEN SYSTEM Claude LIARD and Azeddine BEGHDADI GAIB – CNAM, 3 boulevard Pasteur 75015 Paris France –
[email protected] L2TI- Université Paris 13, Institut Galilée, 99 avenue J. B. Clément 93430 Villetaneuse – France
ABSTRACT The aim of this contribution is to present a flexible realtime system designed for vision rehabilitation using sensory substitution. In this version, the developed substitutive sensory system is restricted to graphical informations. The system is based on some findings in psychoacoustic obtained from actual experiments. It is based on the auditive localization of virtual sound sources. This system consists of four loudspeakers located at the four corners of a square in the vertical plan in front of the listener. The basic idea is to construct an inputoutput mapping which converts graphical input information into localized sound source. The shapes of graphical forms are then converted into sounds produced by moving a virtual source. The displacement in azimuth and elevation on the plan defined by the four loudspeakers of this virtual sound source allows to draw different shapes. The temporal integration by the listener of successive positions occupied by this virtual sound source describes the global graphic object. The system has been succesfully evaluated through experiments involving a small group of sighted and blind subjects. 1
INTRODUCTION
With the increasing use of multimedia systems, there is a real need for developing tools able to offer aids to visually impaired or blind people in accessing to graphical informations. This technological development opened new prospects in the realization of man/machine interfaces for blind users. Many efforts have been devoted to the development of sensory substitution systems that may help visually impaired and blind users in accessing to visual information such as text, graphics, or images [1][3]. Some of them, inspired from Human Visual System (HVS), are based on transformation of visual information to auditive signal. These approaches assume a sufficient knowledge of both visual and auditory systems. However, in spite of our limited knowledge on HVS and auditory system, some technical solutions have been proven helpful in some specific environments. At present time, we can consider that the various solutions suggested for text access are acceptable. However, the information presented in the form of graphics or images, in increasing development, presents a major obstacle in the daily life of blind users. For these reasons, we undertook to seek a system interactive, simple and afordable, able to represent graphical informations. The proposed approach is based on the sound screen concept. Its principle rests primarily on the auditive localization of virtual sound sources (VSS). The sens of hearing presents many analogies with
the parameters intervening in the vision. The human being exploits very much this resource, in particular with the speech which transports important semantic components, just like the text with the vision. If all the parameters intervening in hearing are not used by the speech, on the other hand, the music exploits all the related resources at artistic ends. However, an important advantage with visual space is that one can represent a particular semantic in a graphical form. Whereas, there is no equivalent graphical representation of auditive semantic in the sound space. Here, as an alternative solution, we propose an audiodisplay system based on sound localization which allows to represent some graphic informations in the sound space. The basic idea is to project graphics on a virtual sound screen. This is the sound screen concept. This system has been evaluated through psychoacoustic experiments involving a group of sighted and blind subjects. 2
BACKGROUND
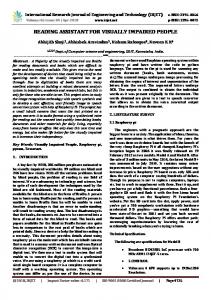
2.1 The concept of the sound screen Our objective is to provide to blind users the possibility of perceiving geometrical forms by exploiting the parameters intervening in the spatial localization of a virtual sound source (characteristics of the source, speed of displacement, azimuth, elevation, distance …). Most of the known stereophonic reproduction suffer from some drawbacks and are often limited to some parameters. As in similar approaches, the three space components of the sound source ( azimuth, elevation and distance) in a window located in a frontal plan of the listener are used here. The system consists of four loudspeakers forming a square in a vertical plane in front of the user and an electronic control unit (fig.1). In a preliminary experimental study the tested patterns are limited to simple graphical shapes. The graphic element to be reproduced is described by the successive positions occupied by a moving virtual sound source inside the plan defined by the four loudspeakers. This illusion effect is produced by controlling the speed displacement and the characteristics of the VSS. 2.2 Method To realize this sound screen, we exploit some wellestablished findings in psychoacoustics. Research in this field is not new and there are many experimental results. However, most of the theoretical models derived or inspired from these findings are limited to the spatial localization of real or virtual sound sources in a horizontal plane [9]. On the other hand, the localization in elevation is rather little studied and is limited to real sources. Current knowledge on the localization is relatively limited
1 meter
Left support Right support
Stereo amplifier Hight and Low
Sound Screen device
Figure - 1 General overview of the sound screen system For example, a pure wave is harder to localize than a complex sound and a female, rich voice in the high pitch, is easier to locate than a male voice [4]. Generally, it is noted that our auditive system is able to localize a sound in elevation and azimuth with a good precision [4]-[7]. However, the characteristics of a sound vary with its orientation and its distance from the listener. For example, for low frequencies, we know that the localization of a pure wave in azimuth is due to the interaural phase difference between the two ears. On the other hand, for high frequencies, it is the interaural intensity difference introduced by the diffraction of the head which is determining. This characteristic in azimuth is not valid for a localization in elevation. Indeed, in this case, it is the richness of the spectrum of the signal in the high pitch which provides a correct localization of the source. Similarly, the perceptual estimation of the sound source distance is facilitated when the signal is enriched by the reverberation component. It appears clearly, that a judicious compromise remains to be found between the various parameters intervening in the localization, so that a sound source could be perfectly localized in a 3d space. Taking into account these findings, it is necessary to chose a sound source that could be perceived as pinpoint, localized in space and considered by the majority of the users rather pleasant and not very tiring. 3
EXPERIMENTS AND PROTOTYPE ASSESSMENT
In this experimental study we content ourselves with a two-dimensional representation on the sound screen using
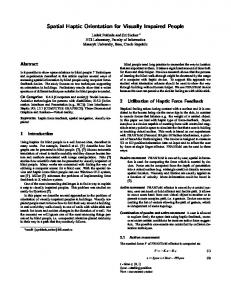
the azimuth and the elevation of the sound source. The experimental study begins with tests involving a sound source perceived like punctual, not very tiring and easily localizable at the same time in azimuth and elevation. In our psychophysical experiments, a great number of sound sources have been tested by different listeners. Finally, we choose a crenel of 75 µS, named “click”, as the elementary sound waveform. All the experiments for obtaining the sound screen are based on this waveform. To control the movement of this source, we study the resolving power, in time and space, of two " clicks " of comparable nature. The next step was to determine the laws of variation in azimuth and elevation which allow to link the subjective angular position of the VSS to the input voltage applied to the stereophonic amplifier. We began our experiments under the standard conditions of stereophonic listening, i.e. starting from a listening triangle of 3 meters side formed by the listener and the two loudspeakers. This enabled us to check the validity of our experiment by showing, for a given waveform, that our results are similar to those obtained by other authors [10]. We noticed the clear influence of the used waveform and the size of the listening triangle on our results [7]. For this reason we carried out another series of experiments using a setup close to our sound screen. From a listening triangle with one meter side and of a click of 75 µS, we experimentally determined the law of variation relating the angular position of the virtual sound source to the ratio of the voltage applied to the inputs of the amplifiers expressed in dB [7]. We carried out this experiment at the same time in azimuth and elevation with a small group of listeners. The plan of the listening triangle was horizontal in the first case, and vertical in the second. For each subject, we noted that this law was practically linear both in azimuth (fig.2) and elevation (fig.3), but with different slopes [6]. 30
25
Azimuth in degree
and there is no general theory to describe this phenomenon in the whole space according to the sound source used. Indeed, one can observe easily that the localization of a source varies according to its characteristics.
20
15 10
5 0 0
2
4
6
8
10
12
14
Ratio of inputs voltages in dB
Fig.2 Azimuth measurements of VSS (8 listeners)
16
18
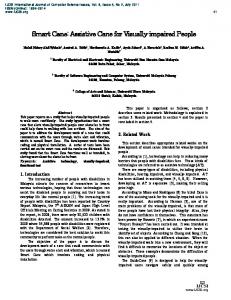
In both cases the angular reference direction in listening triangle is formed by the line joining the center of the listener head and the centre of the sound screen. We obtain the following expressions: 30
Elevation in degree
20
10
0 -18
-14
-10
-6
-2
2
6
10
14
18
-10
-20
-30 Ratio of inputs voltages in dB
Fig.3. Elevation measurements of VSS (3 listeners)
For a virtual source located in azimuth :
θ
V = − K X L .20.log L VR
(1)
θ is the angular value of the virtual sound source
or in the case of a symmetrical perception, with only two parameters KX, KY. These results enabled us to realize our sound screen. We finish our study by an evaluation of our device on a small group of listeners. This evaluation consists of the recognition of twelve reference shapes by a group of listeners (seeing and blind). 3.1 Calibration of the screen according to the listener To correctly perceive the figures presented by the sound screen, each listener, according to his auditive characteristics, realized himself a calibration of the system. The procedure of calibration includes two adjustments. First, the “static” calibration is used to balance the intensities of the four loudspeakers to perceive a virtual sound source located at some reference position in the sound screen. Then, the “dynamic” calibration allows the listener to adapt the sound screen to his auditive sensitivity. At first approximation it is considered that listener has a symmetrical perception in azimuth and elevation. Thus, only the two constants Kx and Ky are used instead of four. 3.2 Evaluation of the sound screen To evaluate the performance of the sound screen we set up a test based on the recognition of simple geometrical shapes. Each figure is represented by the displacement of the VSS in the plan defined by the four loudspeakers. The description of listeners are compared with the presented shapes. We simulated twelve shapes as shown in fig.4.
expressed in degrees. KXL is a constant related to the listener, in the range [2 3.7], for a source deviation of the center towards the left. If the deviation towards the right is not equivalent to the left, another coefficient KXR, proper to the right side, must be used. VL and VR are the left and right voltages applied to the amplifier inputs. For a virtual source located in elevation : ♦ 1 - from the origin upwards δ H = −K YH .20.log VVL H
(2)
♦
2 - from the origin downwards (3) δ L = −K YL .20.log VVL H δH and δL correspond respectively to the angular deviation upwards and downwards of the virtual sound source expressed in degrees according to the reference direction. KYH and KYL represent two constants depending on the listener; the first relates to the deviation upwards; the second, the deviation downwards. In our experiment these coefficients are between 3.3 and 7.8 for the top and 2.2 and 5.8 for the bottom. VL and VH are respectively the low and high voltages applied to the inputs of the stereophonic amplifier. Hence, the optimum conditions for an unspecified listener are summarized with 4 parameters KXL, KXR, KYH, KYL,
Figure 4. Each figure is explored with the sound index by the longest way, since the black point towards the white point.
To carry out this evaluation, we developed a software allowing the listener to adjust the sound screen to his sensitivity and to explore the catalogue of shapes. For each shape, the user has the possibility to listen as many time as he wishes and to modify the speed of exploration. In all the cases, the listener did not have the possibility of returning to the previous figure. The shapes are randomly presented to avoid the bias that may be introduced by memorization effect. For each presentation, the listener has to identify the figure. To estimate the dimension and the position of the figure we asked the subjects to indicate the extreme limits of each figure, in azimuth and in elevation. For each explored figure, the listeners are asked to describe their perception by using speech, gesture and free-hand drawings.
4
RESULTS
The total duration of the test was approximately 20 to 30 minutes per listener. The " static adjustment " of the sound screen did not present any difficulties. On the other hand, the "dynamic adjustment " appeared more difficult for the listeners for two reasons : the first, because an experiment of the sound screen is necessary to obtain a good adjustment and the second, because the experimenter cannot check the adjustments quality of the listener since they are personalized. In spite of these difficulties, the calibration in azimuth is easier than that for elevation. However, we noticed that the subjects involved in the practice of a musical instrument appeared more effective in the adjustments and more precise in their descriptions. Generally, the exploration of our catalogue of figures by the listeners was as expected. The subjects recognize the figures rather well, especially for new user of the sound screen. The subjects tend to confuse some figures like the sinusoids and the periodic isoscele triangles for example, except the listeners having a musical practice. After the experimentation, when one presents only these two figures one after the other, the subjects note a difference, but can still confuse the figures. Confusion comes from the fact that the sharp angles are perceived as rounded around extrema. We noticed that the elevation is better perceived when the shape includes a combination or a succession of horizontal and vertical displacements. 5
CONCLUSION AND PERSPECTIVES
The reasons for choosing an experimental approach are a) the dispersions, sometimes important, of the ideal models which are limited to the horizontal plane, b) the absence of theoretical work in the vertical plane, c) the reduced number of experiments in all space surrounding the listener, and especially, d) the need for taking into account the psychical state of the listener which corresponds to sound stimulations. Our objective is to study the various parameters intervening in the acoustic representation that we wish to obtain. Then, to try to converge towards an acceptable acoustic solution by a succession of choices and compromises, taking into account the cost constraint, and the ease of use for the listener. The adopted solution is not inevitably the best, but demonstrates the feasibility of our system. The resulting sound screen is based on the obtained experimental data. It can be considered as an autonomous device connected to four amplifiers and a host-computer. Its role is to calculate the signal amplitudes on each of the four amplifiers according to the sound-source coordinates on the screen, which are provided by the host-computer. The evaluation of the system was done through a test consisting in the recognition of twelve geometrical shapes by a restricted group of seeing and blind subjects. The results of our study show that the representation of curves or figures on the sound screen is possible since practically all the curves were recognized. However, some
difficulties appear in recognizing the vertical lines, shapes angles and closed figures. It was noticed that the perception in height is good when the sound index is modulated by a combined movement in azimuth and height. Another difficulty is related to the calibration of the sound. Several modifications are possible to improve the perception capabilities and the comfort of the listener, in particular, one can obtain a better perceptual localization of the source in elevation by reducing the duration of the click according to his relative position from the screen. This experimental work shows that it is possible to represent graphical shapes by using the spatial hearing of a virtual sound source. Another extension of this system is the sonification of grey-level image. This could be done on the object contours extracted from the relevant shapes in the image. This work constitutes a first promising step for this project but we are far from a satisfactory solution transposable under the headphone. 6
References
1. Meijer, P.B.L., ‘‘An Experimental System for Auditory Image Representations,’’ IEEE Transactions on Biomedical Engineering, Vol. 39, No. 2, pp. 112121, Feb 1992. 2. C. Capelle, C. Trullemans, P. Arno and C. Veraart, ‘‘A Real-Time Experimental Prototype for Enhancement of Vision Rehabilitation Using Auditory Substitution,’’ IEEE Trans. Biom. Eng., vol. BME-45, pp. 1279-1293, Oct. 1998. 3. A. C. G. Martins and R. M. Rangayyan, ‘‘Experimental Evaluation of Auditory Display and Sonification of Textured Images,’’ International Conference on Auditory Display (ICAD), Palo Alto, CA, November 2-5, 1997 4. Jonquet, A. (1979) – Holophonie et perception acoustique tridimensionnelle. Thesis, University of Provence (Aix-Marseilles I, France) 5. Butler, R. A. ; Humanski, R.A. (1992) – Localization of sound in the vertical plane with and without highfrequency spectral cues. Percept. Psychophys. 51 (2), 182-186. MEDLINE 92195767. 6. Liard, C (1995) – Représentation d’objets graphiques destinée à des personnes déficientes visuelles ou aveugles, reposant sur la localisation auditive spatiale de sources sonores virtuelles. Approches Psychoacoustique. Thesis, Univ. Paris VI, France. 7. Strybel T. Z, Manligas C. L., Perrott D. R. (1992) – Minimum audible movement angle have has function of the azimuth and rise of the source. Hum. Factors 34 (3), 267-275. MEDLINE 92375606. 8. Sakamoto N, Gotoh T, Kogure T, Shimbo M, Clegg A., (1981) – Controlling sound-image localization in stereophonic reproduction. J Audio Eng Soc 29:794-799. 9. Blauert J,( 1983) “Spacial hearing. The psychophysics of human sound localization. The MIT Press 10. Mertens, H.(1965) – L’écoute directionnelle en stéréophonie : étude théorique et vérification expérimentales. Revue de l’UER 92:2-14. (Europe)