Figure 1. Design of an augmented vision system. that is used to construct the augmented representa- tion. ..... from a light fixture on the ceiling of the hallway.
Department of Veterans Affairs Journal of Rehabilitation Research and Development Vol . 32 No . 3, October 1995 Pages 264—279
An augmented computer vision approach for enhanced image understanding Malek Adjouadi, PhD ; John Riley, ME ; Frank Candocia, ME ; Jean Andrian, PhD ; Habibie Sumargo, ME
Center for Advanced Technology and Education, Department of Electrical and Computer Engineering, Florida International University, University Park, Miami, FL, 33199
Abstract —This paper addresses the design concept of a spatially and spectrally augmented computer vision approach toward enhanced image analysis and understanding . The concept of spatially augmented computer vision refers to the inclusion of the stereo disparity measure (½-D) along with the two-dimensional (2-D) spatial coordinates of the images, together yielding the augmented (2½-D) representation . The concept of spectrally augmented computer vision refers to the implementation of the multiresolution concept of the wavelet theory to analyze and assess in detail the local properties of the 2-D images . The principal objective in applying this augmented, and more revealing, computer vision approach is to provide the added dimension in spatial and spectral resolutions for the enhanced understanding of images . To this end, imaging techniques are developed to exploit, in an optimal fashion, the information acquired by the camera system to yield useful descriptions of the viewed scenes . Experimental results are provided in support of this research direction.
INTRODUCTION The important steps considered for the augmented computer vision approach include : 1) the extraction of image features for the construction of disparity maps ; 2) the understanding and exploitation of the mapping principles between the augmented (2½-D) representation and the 3-D real world to yield enhanced image interpretation ; and 3) the development of appropriate image analysis and interpretation techniques based on this spatially and spectrally augmented image representation . It is clear that this research endeavor calls for significant theoretical and practical reflections . In an earlier publication (1), an assessment was given on earlier studies based on the applications of sonic and electromagnetic technologies for the provision of obstacle detection cues, and the tactile-based systems for object identification and recognition . Considering the progress made in the field of computer vision, along with our enhanced understanding of biological vision, more efforts should be invested in this research direction to enhance the prospects of scene analysis and understanding under the augmented representation . In taking up such a challenge, and for the formidable task of implementing such a vision-based system as a possible guidance aid for the blind individual, however, we remain conscientious to the fact that " . . .they who are blind tend to doubt the information gathered by other sources" (2) . Such doubts are legitimate. Therefore, a change in attitude, to at least accept the explora-
Key words : augmented image representation, feature
extraction, scene analysis, stereo vision.
This material is based on work supported by the National Science Foundation with the Center for Advanced Technology and Education (CATE), Department of Electrical and Computer Engineering, Florida International University. Address all correspondence and requests for reprints to : Dr . M. Adjouadi, Department of Electrical and Computer Engineering, Florida International University, University Park, Miami, FL 33199 (email: malek @vision . fiu .edu) . 264
265 ADJOUADI, et al . Augmented Computer Vision Approach
tion of computer vision-based mobility techniques, becomes another necessity which can be addressed only through a strong commitment to the development of a sound theoretical framework followed by feasible and reliable practical implementations.
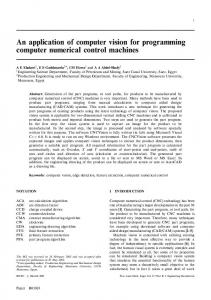
METHODS A Dimensionally Augmented Vision Approach The functional structure of the integrated vision system is illustrated in Figure 1 . In this approach, the main thrust of the research efforts is placed on taking the new direction of incorporating the stereo disparity measure along with the pixels gray-level information to enhance the interpretation of images and to seek effective results for 1) enhanced image analysis and interpretation based on the augmented image representation, while establishing the 3-D spatial relationships of the user within the context of the viewed scene; and 2) automated guidance, providing reliable guidance cues with the possibilities for obstacle detection and avoidance and the identification of objects deemed important in the guidance process. In view of this design, the feature extraction process is introduced first, using (a) the Laplacian of a Gaussian operator, (b) the multiscale edge detection of the wavelet transform, and (c) the principles of the simple cells of the hypercolumn theory . Using these features, a stereo vision algorithm is described for the extraction of the stereo disparity measure
Stereo and Time Varying Imaxes linage Sequences
{t11= .y)
Perspective Projection Modelling
2-D Rap
parity/Depth Maps Generation
anon
Nx .yl
Application of the Wavelet Theory for: a. Multiresolution Analysis b. Multiscale Edge Detection
Augmented 2 ; -D Representation
Development of Visual Algorithms for: a Enhanced Image Analysis and Understanding b. Object Recognition c. Automated Navigation
Figure 1. Design of an augmented vision system .
that is used to construct the augmented representation . Key visual algorithms are then introduced to illustrate the potential for enhanced image interpretation. Fundamentals of Image Feature Extraction The Feature Extraction Process The process of feature extraction remains an essential step for : (a) the implementation of stereo vision for the disparity extraction, (b) object recognition, and (c) automated guidance . The inherent problem of this step of feature extraction relates directly to the decision to be made about what intensity differential is significant enough such as to distinguish a potential feature point from a potential noise point . Such a decision is often subjective in nature and is based on empirical observations . Some degree of tolerance in this type of decision making is usually achieved through the use of preprocessing steps to eliminate such things as isolated potential noise points, and to correct those feature points whose disparities take on values that are considered inconsistent in the context of neighboring disparities. It will be shown here that the concept of multiscale edge detection of the wavelet theory and the functional principles of the hypercolumn theory of the visual cortex based on the notion of simple cells (depicted here as different edge operators with varying resolutions) show great promise in the resolution of the feature versus noise dilemma in the extraction process of features . The Laplacian of the Gaussian is perhaps the best known operator that can be considered for the extraction of image features (3) . The choice between the direct use of derivative-based operators versus the use of the Laplacian of the Gaussian is solely based on the compromise between accuracy in localizing image features and the attenuation of noise in the feature maps which comes from the choice of the standard deviation (a) of the Gaussian function. In a recent study (4), for example, we have shown that the first and second order 1-D Walsh operators can be used to approximate the first and second order derivative operators . The dimension n of these (nxn) operators relates to the standard deviation of the Gaussian function, in that a larger n results in an attenuation of the effect of noise, but at the expense of accuracy in locating the feature and determining its true contribution in terms of amplitude . Another recent recourse to the problem
266 Journal of Rehabilitation Research and Development Vol . 32 No . 3 1995
of feature extraction involves the application of the wavelet theory (5-8) . With respect to the application of the wavelet transform, there are two evolving concepts that are deemed of great importance for enhanced applications of computer vision: 1) the concept of multiscale edge detection; and 2) the concept of multiresolution which, through dilations and translations of the mother wavelet, allows for "zooming-in" in any part of the signal, seeking in an optimal way the desired information, with the potential to filter out unwanted fluctuations (noise) . Illustrative examples shown in this study clearly demonstrate the important reason why the wavelet is referred to as the "mathematical microscope ." The Laplacian of the Gaussian Approach In the 1960s, Hubei, Weisel, Campbell, and Robson introduced certain notions about how information is processed in the visual cortex (9,10) . In the past two decades, it has been shown that visual information is processed in parallel by innumerable spatial-frequency-tuned channels in the brain (11-14) . This implies that the visual system analyzes the scene at different resolutions . Psychological experiments have been found to be consistent with this notion. An appropriate filter for detecting separately, and at different scales, intensity changes in images, was found to be the second derivative of the Gaussian filter (15) . In general, this filter is not orientation dependent as are a majority of the other known operators . Thus, intensity changes at a given scale are best detected by locating the zero-crossings of the convolution V2G(x,y)*f(x,y) where V2 is the Laplacian operator, G(x,y) is a 2-D Gaussian distribution and f(x,y) is a 2-D image . A 2-D Gaussian distribution, with the mean value of the distribution located at zero, is given by ix2+y2 2
G(x,y) = 27ro~
e
[1]
where a is the standard deviation of the distribution or the scale of the filter . With the Laplacian operator defined as : 02 = ( a2 + a 2 ), the La t3x2 3x2 placian of the Gaussian distribution yields :
V2 G(x,Y) =
1
x2 + y2 - 2a2
2 7f Q4
e
2 2
[2]
The convolution V2G(x,y)*f(x,y) is best performed in the Fourier (F) domain as the inverse Fourier transform of a product given by : F-1{F[f(x,y)}. F{V2G(x,y)}} . The Gaussian filter has been proven to be the only filter, in any dimension, that does not create generic zero-crossings as the scale factor of the filter increases (16) . This filter has applications, not only in the extraction of image features, but in the important role of attenuating noise effects present in images. Applications of the Wavelet Theory A more objective assessment of the feature extraction process should involve both the time/spatial and frequency/scale domains . This means that a feature is now identified both in its time/spatial domain in terms of its locality and its frequency/scale domain in terms of its harmonic content. The wavelet transform provides the answer to this issue and allows for the study of 1) the time-frequency representations of the wavelet for multiscale edge detection, and 2) the multiresolution property for the analysis of the local properties of a given signal under different scales . Wavelet transforms, unlike the traditional Fourier transforms, are thus suitable to analyze a given signal containing localized variations . Moreover, these localized variations can be analyzed at different scales . Thus, if the wavelet transform is applied successively on the details of the signal, it allows for an in-depth look at the nature of the fluctuations and will allow for the separation of the trend from fluctuations, with the potential to trap unwanted fluctuations (a possible effect of noise) in a well-defined frequency band and have them filtered out . All these characteristics and attributes make the wavelet transform a very attractive tool in any automated vision or object recognition problem. Time-Frequency Representations and Multiscale Edge Detection Wavelet analysis allows, in the most optimal manner, for the extraction of image features . This is a direct result of the zooming effect which can be achieved through dilations of the analyzing wavelet.
267 ADJOUADI, et al . Augmented Computer Vision Approach
It is through such wavelet dilations that features can be represented simultaneously in both time and frequency domains . With conventional Fourier analysis, this is not possible, since the basis function for Fourier is not well localized in time . This implies that there are consequences for even the most minute change in frequency over the entire time spectrum . Wavelets, however, sacrifice some localization in frequency for localization in time . The yielded result allows for a more enhanced analysis and understanding of the signal through a more complete representation . A wavelet can thus be adjusted by dilations (compression) and translations (convolution) to localize particular feature points in both spatial coordinates and harmonic content. Thus, by considering each row of a 2-D image as a spatially/time varying signal, we can isolate image characteristics both in time and frequency . The analogy of time-frequency representation in the 2-D case relates to the property of multiscale edge detection . Through this last property, there is a potential application for data compression by storing only the information pertinent to edges, as it is possible to reconstruct images through projections of these wavelet transformations. It is this exact theme that is adopted here in the application of several operators at various resolutions to provide some insight on how the brain may interpret images projected onto the striate cortex, based on the functional principles of the simple cells of the hypercolumn theory of the visual cortex (12). Results of the Feature Extraction Process Results illustrating the process of feature extraction through the application of (a) the Laplacian of the Gaussian operator, (b) the wavelet Transform, and (c) the principles of the simple cells of the hypercolumn theory are given in Figure 2 . From these results, the next logical step is to assess the 3-D information of these features to begin the process of enhanced image analysis and interpretation under the augmented representation. Extraction of the Depth Information If somehow we were to assume a flat ground plane such as indoor walkways, it would be easy to determine the geometrical mappings relating realworld points to their image projections . Thus, an image area delimited by the image coordinates xi, xi,
yi, yi , as shown in Figure 3, can be related to the real-world width (W) and range (R) using triangulation: with R (yi ,yi) = yi — y i, we find that: R(y) =
(f + y tana) h tan ((3 + a) — fh tan a f + (f tana — y) tan 63 + a)
[3]
and, W(x;,xi) = f + R
y i,Y0)
f
(xi —
x i)
[4]
where h is the camera height . The term R (yi , y o) is evaluated as yi — y o with y o = 0. Note, for example, if the position of the image plane is such that a= 0, then Equation 3 takes the simple form: fhL 2 R(Yi,Y i ) _ (fh —
y L)(fh —
) (Yj — Yi)
[5]
Yi L
With respect to the idea of having the image analysis focused on a specific region of the environment, let us treat an example where it is desired to process the environment that is within a range R(y k) from the observer, where (R(y k) = L + R(yo ,y k)). This problem reduces to finding the image coordinate y k corresponding to the range R(y k) . From Equation 3, y k is derived as f[R(yk) + h tan a] + f[R(yk) tan a — h] tan ((3 + a) Yk
[R(y k) + h tan a] tan ((3 + a)
[6]
and if we let a— 0, Equation 6 takes the following simple form : Yk
fh [R(yk) — L] LR(y k)
[7]
Such an approach to image versus real-world mapping will be limited at best to known indoor environments . To take on a more general approach, we need to use stereo and/or motion vision with the objective to recover the third dimension . The next section will focus on an application of stereo vision to provide a solution to this problem. An Application to Stereo Vision Success in stereo matching is inherently linked to the problem of identifying corresponding feature
268 Journal of Rehabilitation Research and Development Vol . 32 No . 3 1995
(al) Input Image
a=0.65 a=0 .70 a=1,0 c3=1 .5 (a2) Feature Extraction using Laplacian of the Gaussian operator with various standard deviations
(a3) Binary Images of the Results Obtained in Part (a2)
. . . . . . .. ... . . . . . . . . ..
(b1) Wavelet 1st Order (b2)Binary Image of (bl) (b3) Wavelet 2nd Order (b4) Binary Image of (b3) Figure 2a and b. a . Image feature extraction using the Laplacian of the Gaussian operator . b . Image feature extraction using the Wavelet Transform .
269 ADJOUADI, et al. Augmented Computer Vision Approach
(cl) Detectors used for Feature Extraction
(c2-1) detector size 4x4 (c2-2) detector size 8x8
(c2-3) detector size 16x16 (c2-4)detector size 32x32
(c2)Summed Activity with Positive Response
(c3-1) detector size 4x4 (c3-2) detector size 8x8
(c3-3) detector size 16x16 (c3-4)detector size 32x32
(c3) Summed Activity with Negative Response Figure 2c. Image feature extraction using the principles of the simple cells of the Hypercolumn Theory of the Visual Cortex .
locations based on the nature of the characteristics of the features extracted and their neighborhood information . The key objective is thus to establish a matching strategy that is sensitive, reliable, and effective in evaluating a match, and with the capability to confirm such a match with a high degree of certainty (17) . The key developments introduced here are :
The establishment of a new and very effective similarity measure designed in a generalized form to reflect accurately not only the positioning of the feature(s) but the contribution of any attribute or combination of attributes that may be associated with the feature(s) . These attributes can be gathered from any contextual information surrounding a given feature point
270 Journal of Rehabilitation Research and Development Vol . 32 No . 3 1995
a search for a match should begin with those features that show the closest resemblance ; thus allowing for the validation of potential matches as correct matches with the highest possible degree of certainty . The characteristic of "closest resemblance" is reflected here by the yielding of a highest similarity measure from the global analysis view point . The challenge here lies in answering to the complex issues of matching primitives and matching rules that effectively address the problem of stereo matching, while preserving the computational requirements at a realistic level (18-21).
comes
L
R(y) - R(y) Ronge
Figure 3. Simplified 2-D mapping principles.
The Similarity Measure Given two windows that contain feature patterns, a similarity measure is established here to numerically describe the likeness of the patterns in the two windows . The window under consideration in one image of the stereo pair is referred to here as the reference window . A window in the confined search space of the other image of the stereo pair that is being compared is the non-reference window. The formulation of the similarity measure between a window A in one image to a window B in the other image of the stereo pair is denoted by \Ir(A-->B) . In this notation, the set pointed to by the arrow is considered the reference set (or window). The similarity measure is obtained as a function of the locality of features within the window and any other attributes associated with these features . That is, v [fa, C A and [fklL C B, where [f!r]E~ c A means feature points at locations i,j within window A, and given that the window size is mxn, with i,k=[0,1, . . .,m—1] and j,l=[0,1, . . .,n—1], we obtain : h
or from the elementary information, such as neighboring gray-level information and directional gradients. 2 . The development of a new matching strategy based on the application of a global analysis on similarity measures which yielded the highest values under confined search spaces, and which have passed a consistency check such as to comply with the uniqueness constraint . This global analysis, the objective of which is to assess results obtained from localized searches for potential matches, stems from the idea that
`I'(A-~B) = q
1 (D 4
1)
Rl
1_ O VS I C I S
9 [ 8]
s th where, 0 VS = vs1 is the noted variation of the attribute in the two windows under comparison with t denotes the number of attributes 0 .-5_ IA Vs considered, and ris is a normalization factor for the sth attribute such that the following condition holds for any attribute considered . Parameter P =1 /NB is the weight associated to the matching of a feature. This weight is a function of the total number of features contained in the reference window B de-
271 ADJOUADI, et at . Augmented Computer Vision Approach
noted by NB . Parameter h = min(NA ,NB)is the minimum number of total feature points found in either window A or B, and Dq is the minimum distance between the qrh feature point in the reference window and its closest feature in the non-reference window . Note that in finding Dq, the distance of all features in A to those in B are computed. The two features, one in A and one in B, which corresponded to the minimum distance, are the two considered when q = 1 . After their contribution to the similarity measure for the window pair considered is assessed, they are removed and the contribution from the next two closest features is calculated. This continues until the contribution of all h features is assessed . It is noted here that the use of contributory similarity, in which case excess features in A are ignored, is a more feasible approach in dealing with such situations often complicated by the presence of noise, occlusion, light reflections, and so forth . Thus, rather than penalize the similarity measure for the excess feature information, the interest should rather be focused in finding a similar feature pattern regardless of feature variations surrounding the pattern of interest. The Matching Strategy The foundation of the matching strategy proposed here is a generalized similarity measure which accurately reflects the positioning of features (sensitivity to feature locality), and is stable enough to allow for feature variations and distortions due to the common problems associated to noise, photometric and geometric distortions, discontinuities, and occlusion . The generality in the similarity measure is depicted through a formulation which reveals the ease of integrating any matching primitive or attribute to be used in assessing a potential match . A consistency check supports this matching strategy such as to enforce the uniqueness constraint. This matching strategy is further reinforced through a unique approach which performs a global assessment of results found through a localized search to exploit the view that matching should begin with those features which have the closest resemblance. A left image window 14 x,,y,, positioned at xr,yr, is compared to all of those windows in the right image that are contained within a specified search space . All window displacements within the search
space are in one pixel increments . When the window in the right image yielding the highest similarity measure is found, its location is marked as xr *,y r * . This window is then compared with those windows in the left within the same predetermined search space . The location of the left window yielding the highest similarity measure is now marked as . A consistency check is said to be satisfied if the windows under comparison from a left to right search and from a right to left search are found to correspond. The following formulation reflects this consistency check satisfying a left to right search and a right to left search: maxkr(W Wr ,yr) It) ; xr=x,±ki, Yr =Yr± k2
x r * ,y r *
[~]
r(WR *yr*~ W~'y1)] xr*,yr*~ max{ * * xr = Xr ±k1, Yr = Yr ± k2
;
The variables kl and k2 represent the extent of space to be searched in number of rows and columns, respectively, from the position of the window under consideration . With the relations established in relations Equation 9 above, correspondence is said to be satisfied if the conditions that xr* =xr and Yr* =Yr hold. The features within the windows that have been found to consistently correspond locally under the confined search space are now to be matched under the global view . The matching procedure begins with the windows that have the highest similarity measure . This is done because there is more probability that the windows with the highest similarity measure are indeed truly corresponding windows than those with smaller similarity measures . In this global matching strategy, it is possible that a feature that has already been matched is matched again with another feature at a later stage of the matching process, but such outcomes are ignored . This is done in compliance with the uniqueness constraint and in support of the match achieved with a higher degree of certainty (a match through a higher similarity measure). Results of the Stereo Matching Approach Stereo scenes were tested and illustrative examples are shown and assessed below . In the assessment of these results, it is revealed that the proposed stereo matching technique performed extremely well,
272 Journal of Rehabilitation Research and Development Vol . 32 No. 3 1995
yielding 80 percent or better of the features matched . It should be noted that these percentages do not reflect the fact that among the totality of features considered in the left or the right image, a number (a small percentage) of these features is actually missing in the left and in the right due to the stereo displacement . The execution time of this matching technique implemented on the Silicon Graphics R4400-based computer varied between a few seconds to 3 to 4 hours for the examples considered . This execution time is a function of the complexity of the scene which is reflected by the total number of features extracted . The authors foresee potential for the application of the similarity measure to various pattern matching and pattern recognition algorithms . In an earlier study (4), we have shown the results where the approach attempts to limit the execution time to within a few seconds even for complex scenes but at the expense of fewer features matched, while still maintaining the objective of finding practical results. It is important to point out that another avenue to the recovery of the depth information is the exploitation of the motion vision principle . Simply stated, the basis of motion vision is the functional relationship that exists between the motion of the observer (the user) and the induced spatial and temporal information changes in a sequence of images . These information changes are functions of both the observer's motion and the depth map of the scene . Under certain fairly broad conditions, both the observer's motion and the depth map of the scene can be determined (22) . Researchers in the field of computer vision tend to agree that a more effective approach to a solution of depth perception may come with an integration of stereo vision and motion vision.
the reference point, the relation between disparity d(x,y) in the 2-D images and depth Z in the real world is established as follows:
RESULTS
where Rn = L + nr and n= 0, 1, . . . , k is a positional index of the range points considered . Parameters f, h, and a denote the camera's focal length, height from ground plane, and tilt angle, respectively . Note that in the case where the tilt angle a = 0, that is, when the camera image plane is perpendicular to the ground plane, which is assumed flat, Equation 12 above takes the simple form:
Image Analysis and Interpretation Under The Augmented 2½-D Representation A stereo pair of 2-D images has been used to establish the disparity measure of corresponding feature points in these images . At these corresponding points, once the disparity is extracted, depth can be derived using simple triangulation . If we assume the lens center defined at point (x,y,z) = (0,0, —f) as
Z
[10]
d(x,y) = f
where B is the baseline distance between the two cameras, and f is the cameras' focal length (assumed equal in the two cameras) . Furthermore, a perspective effect is mathematically derived so as to establish a relationship between the 2-D image plane and the 3-D real world . With this knowledge, an initial step for understanding the relationship between the augmented (2½-D) representation (which includes the disparity measure) with the 3-D real world is presented . Methods of analysis and interpretation can then be explored to stress and emphasize the importance of this augmented representation. Perspective Projection
An analysis of the projection of a 3-D point in space onto a 2-D point in the image plane is expressed mathematically as : (x,y,z)—~(x*,y*,z*), or z*
1] =
f+ f+
0 1 [11]
The coordinate z * = 0 implies a 2-D image point representing the projection of a 3-D point . To establish the desired geometrical relationships, simple triangulation can be used in reference to Figure 4. Projection (P) of a segment of length (r) between a point at range Rn and another point at range Rn+1, as shown in Figure 4a, is given by the following relationship: P(n,Rn, Rn+ 1) =
fh (Rn+ 1 — Rn) cos a (Rn cos a + h sin a) (Rn + 1 cos a + h sin a)
P(n,R n, R n+ 1) =
fhr Rn • Rn + 1
[12]
[13]
273 ADJOUADI, et al. Augmented Computer Vision Approach
camera
helgh
Range RO
R1
R2
(a) Mapping of the Range Measure width
w
\
/
w
/ /
\\
\
\
w
\
/
/ / j
/
r X
.. X r r
Picture Plane
\\\
focal ngn,
le
~j /
amera
P(l .w) E
P(0,w)
—
)
(b) Mapping of the Width Measure Figure 4. Mapping principles of the perspective effect.
Similarly, referring to Figure 4b, we find that the projection (P) of any segment of width (w) is given by the following relationship: P(n,w) =
fw L + nr
ships, the perspective effect is easily established. This actual perspective effect is then implemented as an added tool for the enhanced interpretation of images under the augmented representation. A camera need not be in any particular orientation for this information to be obtained . The transformation matrices corresponding to rotation, translation, and scaling about any of the principal axes can be accounted for, as illustrated in Figure 5. This perspective effect, as will be shown later, provides support to the analysis of images under the augmented (2½-D) representation . For known camera parameters, this task reduces to finding the geometrical relationships between the real-world measurements of range and width with their respective projections onto the picture plane . The advantages in the analysis provided by integration of the perspective effect into account are (a) the image analysis conforms to the real-world representation, (b) processing time and results of the walking straight ahead analysis are enhanced since only the desired vicinity of the blind is considered at any given level of the virtually partitioned image, (c) if an object is detected within the path of travel, its size can be estimated.
[14]
Given the camera viewing position and the camera parameters, using the above projection relation-
Scene Analysis Based on the 2½ -D Representation Illustrative examples can now be explored for possible cases of enhanced scene analysis and interpretation. Consider Figure 6, which illustrates a stereo pair of a hallway scene containing select objects, cast shadows, and a reflected light spot from a light fixture on the ceiling of the hallway. Now, each depth region in the superimposed perspective map is set to correspond to approximately 1 meter . The object projection closest to the camera is that of the chair, both in the perspectively mapped image and in the disparity map . Looking solely at the perspective map, the contours describing the chair seem to fall on four depth regions in the perspective map . Information from the disparity map though, yields roughly uniform disparity measures for all features encompassing this object. These uniform disparities must correspond to a single depth region in space . The conclusion is that the object must be upright . Similar conclusions can be drawn for the case of the trash can . The paper recycling receptacle yields some interesting results.
274 Journal of Rehabilitation Research and Development Vol . 32 No . 3 1995
Figure 5. Illustration of perspective projection examples.
Note that connected contours that encompass this object extend from the second perspective map depth region all the way past the last one shown. From the perspective view point, this particular object must be several meters in length . From the disparity information, the object should be contained in the fifth depth region of the perspective map . A conclusion that can be drawn is that a cast shadow (or a reflection) of an object may exist from the second to the fifth depth region in the perspective map. The reflected light spot at the bottom of the image reveals another interesting case of interpretation . Now note that in the mapped region of furthest disparity, the vertical edges corresponding to the reflected light appear in the first perspective map depth region. From the extracted disparity measure, the reflected light must appear beyond the fourth depth region of the perspective map . There is a conflict between the extracted disparity and the information from the perspective projection . This virtual object can only be a reflection of a true object situated as the extracted disparity measure indicates . In fact, the floor of the hallway is actually mirroring a light fixture on the ceiling . The second example shown in Figure 7, (which illustrates a stereo pair of images) which included a mirror in the scene, was used to confirm that objects seen through a mirror will in fact have disparities that are equivalent to their real-world disparities .
The third example, shown in Figure 8, is the stereo pair of a photograph of a house . Using the perspective and disparity information, the conclusion can be drawn that this house scene is a flat surface or a photograph . Analysis of the stereo pair yields approximately equivalent disparity information throughout the entire image . This in itself results in all contours detected in this stereo pair to be at the same depth in 3-D space. These contours must therefore correspond to that of a flat surface. A 2½-D world can become a new possibility with a fast implementation of the proposed stereo matching algorithm . The ramifications of this 2½-D world are of great potential for : (a) Scene segmentation, (b) object identification, and (c) enhanced automated guidance (23,24). An Interpretation Example of a Staircase in Contrast to a Crosswalk The staircase is an interesting problem because, in general, shading is what distinguishes the rise, the upright step, from the tread, the flat step (25,26). The staircase is a succession of rises and treads, while a crosswalk a succession of painted and unpainted stripes . It is shown here that beyond standard measurements such as (r(s, k) •t(s, k) /r(s,k) + t(s,k)) where r(s,k) denotes the rise/painted stripe and t(s,k) denotes the tread/non-painted stripe which can may be used to discriminate such
275 ADJOUADI, et al . Augmented Computer Vision Approach
(a) Left Image + Perspective
(b) Right Image + Perspective (c) Disparity Map + Perspective
(d) Closest Region
(e) Middle Region
(f) Furthest Region
Figure 6. Disparity map of a hallway scene superimposed with a perspective projection.
Left Image
Right Image
Complete Disparity Map 13-14 Pixel Disparity
Figure 7. Example of mirrored objects in a real-world scene .
Left Image Features
10-12 Pixel Disparity
Right Image Features
0-9 Pixel Disparity
276 Journal of Rehabilitation Research and Development Vol . 32 No . 3 1995
Figure 8. Surface level perspective maps superimposed on stereo-image projections.
cases (27), the disparity measure in the augmented representation constitutes the most important feature to reach any conclusive assessment of the two cases. The results for this comparison are illustrated in Figure 9. An Analysis of the Problem of Shadows under the Augmented Representation The characterization of the effect of shadow is based on the fact that shadows cast on any surface would not change the surface physical characteristics and would only introduce a uniform gray level shift on those pixels under the shadow . But unlike mirrored objects, which display a disparity conforming to their real-world disparity with respect to the observer, cast shadows reveal a disparity which relates directly to the spatial position of the shadow itself rather than the object that casts it . The augmented representation in its essence would not help enhance the identification process of shadows unless overall context in the scene is used to exploit information such as "shadows are not freestanding," and that they always extend toward the object which cast them, ignoring flying objects. Scene Analysis for the Detection of Depressions Many visual cues, such as stereopsis, occlusion cues, context in the scene, and change in textural properties, can all be part of the recognition process of depressions . A computer implementation exploit-
ing any one of the above cues is a complex information processing problem . The concern in the detection of depressions or drop-offs is to extract the presence of any occluded information . In the 2-D case, one might consider context in the scene, or to look into a set of dynamic (time-varying) images and seek to extract any new information revealed through new peaks in the image intensity profiles (28) . In the augmented (2½-D) representation, we can look for discontinuities in the disparities of the newly revealed information. Scene Analysis of Upright Objects Versus Flat Objects Upright objects, unlike flat objects, are not affected by the perspective effect . On the other hand, flat objects project on the 2-D image plane proportionally to their actual length (in the direction of travel) in terms of size of the object . Upright objects project on the 2-D image plane proportionally to the extent (in length) of the area they occlude or the extent of information in the scene that is occluded . This observation confirms the results obtained in the staircase versus crosswalk comparison. A Possible Man-Machine Interface These 2½-D representation results can be conveyed to the blind individual as tactile maps of disparities as illustrated in Figure 6, where edge
277 ADJOUAD1, et al . Augmented Computer Vision Approach
(a) Left Image
(al) Right Image
(a4) Complete Disparity Map
(a7) 14-15 Pixel Disparity
(a2) Average Perspective Projection
(a5) 18-20 Pixel Disparity
(a6) 16-17 Pixel Disparity
(a8) 12-13 Pixel Disparity
(a9) 10-11 Pixel Disparity
(a) Disparities Conforming to the Perspective Projection of a Simulated Crosswalk
(b1) Right Image
(b2) Left Image
(b3) Right Image Features (b4) Left Image Features
(b4) Complete Disparity Map (b5) 28-29 Pixel Disparity (b6) 24 Pixel Disparity (b7) 21 Pixel Disparity (b) Disparities Conforming to the Staircase Example
Figure 9. Example contrasting a staircase and a crosswalk in the augmented representation.
278 Journal of Rehabilitation Research and Development Vol . 32 No . 3 1995
information will help in determining the contours of objects and possibly their eventual identification if need arises, especially for cases such as a crosswalk, a staircase, a curb, and so forth, and where the horizontal thickness of these edges shown in white is directly proportional to their stereo disparity and, therefore, their real-world depth . The overall disparity map can also be a segmented function of the disparity measure such as to display (a) the disparity map of closer objects, (b) the disparity map of mid-range objects, (c) the disparity map of far away objects, and (d) any other map of objects within any disparity range desired . An example showing this kind of display is also shown in Figure 6 . Furthermore, safety paths provided for automated guidance, and which are generated as simple markers showing the direction of safe travel, can also be displayed in tactile form . Simple audio cues can be also given in the form of "path clear straight ahead for X steps or Y meters," "you may turn left/right after XI steps or Y t meters," or "straight ahead leads to a dead end ." These types of results are given and discussed in Adjouadi, 1992 (1) . There are, however, concerns for these types of audio displays, since images are dynamic in nature, and the time processing required to make sense of the changing information is computationally taxing . Also, it is extremely difficult to synchronize the audio output with the changes experienced in the image . This constitutes another interesting research avenue.
theoretical and practical, such a vision-based guidance system entails. The impetus in this endeavor draws from the properties of the wavelet transform as well as from the functional principles of the hypercolumn theory of the human visual cortex. Preliminary results in the application of the hypercolumn theory applied to image features understanding reveal tremendous potential for the development of algorithms which can provide credence to the principles of size constancy and orientation independence . Implementation of constituents of the hypercolumn theory will undoubtedly constitute a milestone in the field of computer vision . The development of algorithms based on the multiresolution and multiscale principles of the wavelet reveal a zoom-in characteristic which is significant for feature extraction and object recognition . Efforts remain to be extended toward real-time implementation of the proposed image techniques in an integrated fashion . At this juncture, the computational extensive tasks involve the application of stereo vision and the application of the multiresolution of the wavelet transform . Parallel processing should be a criterion to be considered at all levels, from the development of the image techniques to the building of the structure which integrates them.
REFERENCES 1.
CONCLUSION This study addressed the design of a dimensionally and spectrally augmented vision system based on enhanced spatial representations and an effective stereo paradigm . The central objective is based on the fact that by using this augmented vision system, enhanced image understanding will result . Such a system will find practical use in many automated robotics applications, including the automated guidance of robots, telerobotics, industrial tasks with hand-eye coordinated systems, and other manmachine interfaces with emphasis placed in the use of such a vision-based system as a possible guidance aid for the blind individual . For this last mentioned application, we remain conscious of the many extremely important ramifications and implications,
2.
3.
4.
5.
6. 7. 8.
Adjouadi M . A man-machine vision interface for sensing the environment . J Rehabil Res Dev 1992 :29(2) :57-76. Freedman S . Vision prosthesis and aids readiness or appropriateness . Report : Board of Education and Services for the Blind, Wethersfield, CT, 1989. Marr D, Hildreth E . Theory of edge detection . In: Proceedings of the Royal Society of London B 1980 :207 :187-217. Adjouadi M, Candocia F . A stereo matching paradigm based on the Walsh transformation . IEEE Trans Pattern Anal Mach Intel 1994 :16(12) :1212-8. Daubechies I . Orthonormal bases of compactly supported wavelets . In : Communications on pure and applied mathematics . Vol . XLI . New York : John Wiley & Sons, Inc ., 1988 :909-96. Meyer Y . Les ondelettes : algorithmes et applications. Paris : Armand Collin, 1992. Rioul 0, Vetterli M . Wavelets and signal processing. IEEE Signal Process Mag 1991 :8(4) :14-38. Chui CK, ed . Wavelets : a tutorial in theory and applications . Vols . 1 and 2 . San Diego, CA : Academic Press, Inc ., Harcourt Brace Jovanovitch, 1992 .
279 ADJOUACDI, et al
9.
10.
11 . 12 . 13 . 14 . 15 .
16 . 17 .
18 . 19 .
Campbell FW, Robson J . Application of Fourier analysis to the visibility of gratings . J Physiol (Lond) 1968 :197 :551-66 . Hubel DH, Wiesel TN . Receptive fields and functional architecture of monkey striate cortex . J Physiol (Lond) 1968 :195 :215-43 . Hubel DH . Eye, brain, and vision . New York : Scientific American Library, 1988 . Frisby JP . Seeing : illusion, brain, and mind . Oxford: Oxford University Press, 1978 . Marr D . Vision . San Francisco : Freeman Publishing Co ., 1982 . Rose D, Dobson VG, eds . Models of the visual cortex. New York : John Wiley & Sons, 1985 . Marr D, Poggio T . A computational theory of human stereo vision . In : Proceedings of the Royal Society of London B 1979 :204 :301-28 . Yuille AL, Poggio T . Scaling theorems for zero crossings. IEEE Trans Pattern Anal Mach Intel 1986 :8(1) :15-25 . Candocia F, Adjouadi M . Stereo feature matching using a new similarity measure . IEEE Trans Pattern Anal Mach Intel . In press . Drumheller M, Poggio T . On parallel stereo . Proceedings of the IEEE, Robotics and Automation, 1986 . Dhond UR, Aggarwal JK . Structure from stereo : a review . IEEE Trans Syst Man Cybern 1989 :19(6): 1489-510 .
20 .
21 .
22 . 23 .
24 .
25 . 26 .
27 .
28 .
Augmented Computer Vision Approach
Ohta Y, Kanade T . Stereo by intra- and inter-scanline search using dynamic programming . IEEE Trans Pattern Anal Mach Intel 1985 :7 :2 :139-54. Cochran SD, Medioni G . 3-D surface description from binocular stereo . IEEE Trans Pattern Anal Mach Intel 1992 :14(10) :981-94. Horn BKP, Weldon EJ, Jr . Robust direct methods for recovering motion . Int J Comput Vis 1988 :2 :51-76. Iyengar SS, Elfes A, eds . Autonomous mobile robots: perception, mapping and navigation . Vol . 1 . Los Alamitos, CA : IEEE Computer Society Press, 1991. Thorpe C, Herbert M, Kanade T, Shafer SA . Vision and navigation for the Carnegie-Mellon Navlab . IEEE Trans Pattern Anal Mach Intel 1988 :10(3) :362-73. Horn BKP, Brooks MJ . Shape from shading . Cambridge, MA : MIT Press, 1989. Tou JT, Adjouadi M . Shadow analysis in scene interpretation . In : Proceedings of the 4th Scandinavian Conference on Image Analysis, Trondheim, Norway, June 1985. Sakamoto L, Mehr EB . A new method of stair markings for visually impaired people . J Visual Impairm Blindn 1988 :82(1) :24-7. Adjouadi M . Image techniques for the detection of depressions in autonomous guidance . Vision Interface '86, Vancouver, BC, Canada, May 1986 .