Pacific Symposium on Biocomputing 7:30-40 (2002)
AN AUTOMATED COMPUTER SYSTEM TO SUPPO RT ULTRA H IG H TH R O U G H P U T SNP G EN O TYP IN G HEIL J, GLANOWSKI S, SCOTT J, WINN-DEEN E, MCMULLEN I, WU L, GIRE C, SPRAGUE A Celera Genomics, 45 W. Gude Drive, Rockville, MD 20850, USA
[email protected],
[email protected] Celera Genomics has constructed an automated computer system to support ultra highthroughput SNP genotyping that satisfies the increasing demand that disease association studies are placing on current genotyping facilities. This system consists of the seamless integration of target SNP selection, automated oligo design, in silico assay quality validation, laboratory management of samples, reagents and plates, automated allele calling, optional manual review of autocalls, regular status reports, and linkage disequilibrium analysis. Celera has proven the system by generating over 2.5 million genotypes from more than 10,000 SNPs, and is approaching the target capacity of over 10,000 genotypes per machine per hour using limited human intervention with state of the art laboratory hardware.
1. INTRODUCTION 1
Since the completion of the human genome sequence by Celera Genomics and The 2 Human Genome Project , efforts have turned to analyzing and comparing the results. One outcome of such analysis, a set of over 3 million putative Single Nucleotide Polymorphisms (SNPs), will be used for disease association, eventually replacing 3 the current RFLP and STRP linkage analysis screening sets. Unfortunately, SNP facilities must generate many times the number of genotypes that STR facilities are currently producing as a consequence of the lower informativeness of SNPs compared to STRs. Moreover, until recent efforts to validate large numbers of evenly spaced markers become fruitful, SNP laboratories 3,4,5 must validate markers ad hoc before genotyping with clinical samples. Celera has created a complete software solution that minimizes manual intervention at each step of the genotyping process. This system may serve as a template for future designs and aid others in realizing the benefits of automation.
2. LABORATORY HARDWARE The process of designing universally usable software is too often derailed by the need to customize programs for particular laboratories and specific instruments. While Celera has developed many system components independent of the hardware to simplify its duplication at other facilities, some components are highly specialized. It is therefore worthwhile to mention the laboratory equipment that our system was intended to support.
Pacific Symposium on Biocomputing 7:30-40 (2002)
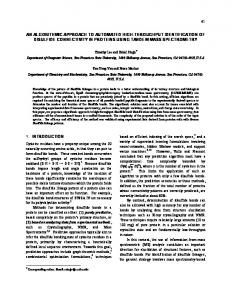
The 5’ nuclease allelic discrimination method employed by Applied Biosystem’s TaqMan platform was chosen to allow for the least human labor while 6 7 in the laboratory . Unlike other methods that may require hybridization to chips or 8 separate allele reactions , TaqMan PCR preparation merely entails adding a premade Master Mix containing buffer, deoxyribonucleotides, and DNA polymerase to the sample template and SNP specific oligonucleotides. TaqMan has already 9,10 established a successful presence in large scale SNP genotyping facilities . TaqMan chemistry employs two allele specific probes for each SNP in addition to the common PCR primers. Each probe contains a 5’ fluorescent dye, commonly VIC or FAM, to detect the presence of the specific allele, and a 3’ quencher to absorb fluorescence when the allele is not present. The result is much like any microarray or molecular beacon technology, one of the dyes will fluoresce for homozygous alleles and both dyes will fluoresce for heterozygotes (Figure 1).
4.500 4.000 3.500
VIC Rn
3.000 2.500 2.000 1.500 1.000 0.500 0.000 0.000
1.000
2.000
3.000
4.000
5.000
6.000
7.000
8.000
9.000
10.000
FAM Rn Homozygous Allele 1
Homozygous Allele 2
Heterozygous
No Template Control
Figure 1. The typical analyzed TaqMan plate showing four genotype clusters for a particular SNP. Each data point represents one sample and is plotted by the intensity measured from each of two flurescent dyes. Clusters of points are classified as being homozygous for either allele, heterozygous, or no amplification.
Pacific Symposium on Biocomputing 7:30-40 (2002)
The ABI Prism 7700 and ABI Prism 7900HT Sequence Detection Systems are used for endpoint analysis of 96 and 384 well plates, respectively, to record the fluorescence of each well’s PCR product. The latter is bundled with an 84 plate robot for long term hands-free automation. Roughly 42 dual plate GeneAmp PCR System 9700 thermal cyclers are needed to keep one 7900HT supplied with an adequate number of PCR plates for continuous operation. Each piece of hardware, plate, oligo, person, and sample is barcoded in order to record the time, technician, and component of every transaction. Any genotype’s history can be accessed to evaluate the performance of particular components in the system.
3. DATA MANAGEMENT
All information gathered throughout the genotyping process is stored in a central ORACLE database. The repository is purposely divided into project management and laboratory schemas. The project schema offers the ability to manage the abstract entities such as SNP, sample donor, or genotype. This includes ‘creating’ the project by indicating the intended customer and loading the desired SNP information. Users control what SNP is ordered, scanned, considered validated, possibly discarded or re-designed, and delivered to the customer. In addition, numerous reports can be generated regarding the current progress of a SNP, failure rate of samples, or allele frequencies per population. The project schema is specifically designed for fast data analysis. It allows for efficient phenotype relations to both donors and SNPs, and has the ability to store haplotypes constructed from specific SNP alleles after analysis. The schema may also track literature references for individual SNPs and donors. In contrast, the laboratory partition consists of tracking every detail of the process taken by the actual physical components mirrored in the project partition. Samples are received, barcoded, and placed into plates and freezers. Oligos are received, diluted, assigned into sets, and also placed into freezers. Plates are arrayed with particular samples and oligos for specific projects. Each well is scanned and possibly re-scanned many times in order to assure a high level of accuracy. However, only the ‘final’ genotype is copied to the project partition where it may eventually be delivered to the customer. The advantage of having common but separated partitions is that the laboratory space provides a tracking environment in which experiments can be re-arrayed, rerun, and reviewed multiple times. The project partition remains uncluttered with details as analysis requires a compact schema designed for speed and clarity. This integration of LIMS and data analysis provides for segregated storage to satisfy each schema’s different requirements, while keeping the data in one repository for the ability to track an individual genotype’s entire history
Pacific Symposium on Biocomputing 7:30-40 (2002)
The versatility of the database schema has further proven itself by also supporting a large scale resequencing laboratory by adding relatively few tables. This combines SNP discovery, validation, and genotyping into one central repository.
4. PRE-PROJECT SETUP
4.1 SNP Selection
7.0000
Genotyping services are generally contracted with either a predetermined set of SNPs or particular locus of interest. If a set of markers is provided, their flanking context is mapped to the Celera Human Genome and any discrepancies or adjacent SNPs masked out. Resequencing has shown that unexpected clustering of dye intensities (Figure 3) are caused by unknown SNPs residing within Figure 3. Undesired genotype clustering attributed the probe or primer sequences, to other unknown SNPs in the probes sequence. making accurate genotype calling difficult. It is advantageous to gather all possible information about the sequence surrounding the SNP before attempting to design a SNP assay. In the case where a locus is targeted, PERL scripts have been written to select SNPs based on desired distance and coverage constraints using Celera’s 1,11 comprehensive RefSNP database . RefSNP not only includes SNPs extracted from Celera’s genomic assemblies, but also externally generated SNPs from TSC, NCBI, HGMD, and literature articles that are then mapped to Celera’s Human Genome. 6.0000
VIC Rn
5.0000
4.0000
3.0000
2.0000
1.0000
0.0000 0.0000
1.0000
2.0000
3.0000
4.0000
5.0000
6.0000
7.0000
FAM Rn
?
Allele 1
Allele 2
Both
NTC
4.2 Assay Design The result of either selection method is a ‘clean’ flanking sequence for each target TM SNP that is fed into a modified version of Applied Biosystem’s Primer Express 12 program . This program has been ported to JAVA and adapted to find customized multi-allelic MGB TaqMan probes with no user interaction, allowing for thousands of assays to be designed within a matter of minutes. In addition to a faster run time, each assay is designed consistently using predetermined parameters eliminating the human bias that can occur in manual designs.
Pacific Symposium on Biocomputing 7:30-40 (2002)
4.3 Assay Quality Control
VIC Rn
Pseudo-SNPs are a common problem 1.200 that arises from misassemblies, 1.000 paralogs, or repeat elements and can needlessly squander genotyping 0.800 resources9. Similar sequences from different regions in the genome may 0.600 erroneously align due to matching at all but a few bases. These differing 0.400 bases are then incorrectly assumed to 0.200 be SNPs. If a pseudo-SNP is genotyped, every sample will appear 0.000 to be heterozygous since each 0.000 0.500 1.000 1.500 2.000 2.500 3.000 FAM Rn sample contains both of the pseudoalleles (Figure 4). Celera has already identified several internal, Figure 4. Pseudo-SNP resulting in all samples external and literature cited SNPs that appearing heterozygous. are actually pseudo-SNPs. Each oligo of an assay is BLASTed against the Celera Human Genome and 13 results parsed with a PERL script using the GNU BioPerl module . Classifying the BLAST hits according to an allowable number of base mismatches and the number of alternative locations matched in the genome provides an estimation of primer specificity. Primers with a low specificity are automatically discarded or sent for assay redesign. Pairs of forward and reverse primers are also tested to see if they may form alternative PCR products other than the one desired. These are alternative annealing locations of the forward and reverse primers close enough together and in proper orientation to form a viable PCR product. Although primer sets with one low-specificity primer forming single products have succeeded in laboratory tests, there is often some loss of signal strength. However, assays forming multiple products of similar length will consistently produce less than desirable results and are systematically discarded or redesigned. Allele 1
Allele 2
1 and 2
NTC
Undetermined
4.4 Assay Order and SNP Tracking
The finalized project, SNP, and sample information is loaded into the database. Using a JAVA GUI to access the database (Figure 6) users may generate a formatted oligo purchase order. Details, current status, and past history for any project, SNP, or plate are available to review or update from this screen.
Pacific Symposium on Biocomputing 7:30-40 (2002)
Figure 6 Managing each SNP and plate status.
5. LABORATORY INFORMATION MANAGEMENT SYSTEM (LIMS)
5.1 Check In
Individual oligos arriving from vendors are immediately barcoded and scanned into the database using a Microsoft VBA GUI (Figure 7). The two primers and two probes of each SNP are grouped and stored together in what is referred to as an oligo set. Oligo sets may also be ordered in one tube, or in 96 well microtiter plates. Scanning received oligos into the database tracks inventory and allows for a nightly report to be generated that notifies lab managers of sets ready to be run the following day. Samples are arrayed in 96 or 384 well plates and a map of the plate entered into the database (Figure 8). Putative SNPs must first be validated using a combination of diversity panels from the Coriell Cell Figure 7 Checking oligos into the database.
Pacific Symposium on Biocomputing 7:30-40 (2002)
Repository14 and several internal Celera samples. Only SNPs that pass validation and meet the required population frequencies are then used on the clinical samples in order to conserve clinical DNA. SNPs that are determined to be nonpolymorphic are used to reduce the number of false-positives in Celera’s SNP calling algorithms.
Figure 8 Editing the array of samples on a plate
5.2 Preparation and Scanning When a SNP is ready to be run, TaqMan Universal PCR Master Mix is prepared using the oligo set and added to a daughter sample plate prepared by the Protedyne robot. The plate is thermal cycled using a GeneAmp 9700. Each step is logged in the LIMS, allowing software to automatically trigger and create the SDS binary file required by the 7900HT. Therefore, the laboratory staff need only to place the plate into one of the 7900HT’s stackers and select the pre-created file in the ABI robot program, rather than manually create the SDS file using the SDS software. Our software recognizes the scanned data file from the 7900HT and automatically passes it to the SDS Multicomponent Analysis software. A multicomponent file is created containing the dye intensities of each well and is subsequently passed to a customized autocaller program. As discussed in more detail below, the program identifies the genotype clusters and assigns appropriate calls to the wells. The putative genotypes are loaded into the database for either manual review or immediate release, depending on the confidence of the autocaller. User interaction with the 7900HT and SDS package is limited via a combination of automated software and triggers to detect and predict what the laboratory personnel are doing. This allows for continuous scanning by the 7900HT without having to manually create, identify, locate, analyze, call genotypes, or export data files. 5.3 Autocalling Automating the process of annotation is the challenge of any genotyping facility, as 9,15,16 using laboratory staff to manually review each genotype is inefficient and costly . Celera overcame this problem by developing a novel and highly accurate allele caller with the ability to flag plates that do not meet predetermined signal thresholds or adhere to common genetic principles.
Pacific Symposium on Biocomputing 7:30-40 (2002)
0.500 0.450 0.400 0.350
VIC Rn
0.300 0.250 0.200 0.150 0.100 0.050 0.000 0.000
0.500
1.000
1.500
2.000
2.500
3.000
3.500
4.000
4.500
FAM Rn Undetermined
Allele 2
NTC
Figure 9. All homozygous genotypes producing two clusters. 3.000
2.500
VIC Rn
2.000
1.500
1.000
0.500
0.000 0.000
1.000
2.000
3.000
4.000
5.000
6.000
FAM R n A llele 1
?
1&2
NTC
Figure 10. A SNP with no rare allele homozygotes produces three clusters. 3.500
3.000
2.500
2.000 VIC Rn
K-means clustering has recently been applied to the classification of 8 Although Celera SNP genotypes . initially experimented with similar methods, examining the results of several plates showed K-nary clustering methods were not adaptable enough to accommodate the variety of possible outcomes. Output from a TaqMan assay is typically four clusters falling into separate quadrants of a rectangle (Figure 1). However, autocalling must also be able to correctly identify situations such as two clusters (Figure 9), three clusters (Figure 10), four scattered clusters (Figure 11), and five clusters (Figure 3). In any non-ideal circumstance, K-nary clustering would consistently force the data into four clusters. Other machine learning methods, such as neural networks and decision trees, were also tested on a set of 80 plates, but failed due to the classification of points based on previous observations. The vastly variable difference in dye intensities between any two plates confused the training process. For example, the heterozygote cluster in Figure10 is centered at (5.0, 2.5) while in Figure 11 it is at (3.0, 1.7). Normalizing the coordinates does not alleviate this problem. A novel alternative algorithm was developed that uses the relative position of samples in polar coordinates to make calls. By considering the inherent genetics qualities of the data, filters allow questionable SNPs to be flagged for manual review. Celera is currently seeking a patent covering this method. This program was tested on a collection of 1,007 plates, consisting of a
1.500
1.000
0.500
0.000 0.000
1.000
2.000
3.000
4.000
5.000
6.000
7.000
FAM Rn
?
Allele 1
Allele 2
1&2
NTC
Figure 11. Clusters not well defined. most difficult to autocall accurately.
The
Pacific Symposium on Biocomputing 7:30-40 (2002)
mix of 96 and 384 wells, from differing SNP assays. The accuracy of the algorithm, assuming human annotation as truth, was 88.9%. However, the method was able to flag 237 low quality files to be reviewed manually. Once these are removed from the assessment, the algorithm scored 99.3% on the remaining 770 files. This translates into 68,467 correctly autocalled genotypes out of 68,920. The program was further tested with 472 384-well plates generated during the breaking in of a newly installed 7900HT. Although laboratory protocols were also being tested at the same time, the algorithm averaged 68.4% accuracy on all plates, and flagged 294 plates for human review. The accuracy for the non-flagged plates was 98.6%. The ability to recognize a low confidence plate greatly improves accuracy to 99%, despite the slightly less than perfect accuracy of the automatic calls when considering all genotypes. Even on the plates that were flagged for human review, only a handful of samples per plate require changes as human reviewers are supplied with automated calls to start from, and make corrections instead of tediously manual calling every well of a plate from scratch. Although Celera’s current policy is to review all autocalled plates manually, the near future will see confident calls finalized automatically. This will reduce the time and effort required to manually analyze, call, and export results from the SDS system even more 5.4 Manual Review
All calls, even on plates flagged with low confidence, are automatically loaded into the LIMS database schema. Celera has developed software to function similarly to the ABI Prism SDS software package (Figure 12) allowing users to save changes directly in the database. Using customized software allows for several internal quality control checks to be performed on the data while the user is making calls. These include tests for allele frequency, known blind controls, and possible plate mislabeling. Warnings are also generated for samples whose stored genotype differs from the current call. Once a call has been finalized for a particular sample and passed quality checks, the corresponding genotype is created in the project partition where it can efficiently be accessed for analysis
6. ANALYSIS Genotypes are periodically delivered to the customer formatted in tab delimited files, table dumps, or XML. After a contracted waiting period, the genotypes are also released to Celera’s RefSNP database to increase its intrinsic value for other customers.
Pacific Symposium on Biocomputing 7:30-40 (2002)
Figure 12. Interface used to manually edit autocalls. Each SNP on a plate is called separately, and any controls are compared to their stored genotypes. Calls are quality tested and then saved as genotypes.
To enable analysis of the high volumes of genotyping data being generated, PERL scripts using the GNU DBI module are utilized to extract genotype calls for a given set of SNP sites.17 Where phenotype data is available for samples, it is integrated with the genotype calls. A comma-delimited format is generated for a PERL script to use χ2 analysis and Maximum Likelihood in identifying regions of Linkage Disequilibrium (Figure 13). Vector files are also generated for import into Rulequest Research’s C5.0 data mining tool,18 WEKA’s machine learning software,19 and customized haplotype inference programs20.
Figure 13. LD map generated from database SNPs.
Pacific Symposium on Biocomputing 7:30-40 (2002)
7. CONCLUSION
Estimates show that automation during the Human Genome Project increased output by more than 40-fold.21 While the world of genotyping may not have attained quite that magnitude of efficiency as of yet, Celera has developed a facility using high-throughput software that significantly reduces human intervention and greatly increases efficiency.
8. REFERENCES 1. Venter et al., “The Sequence of the Human Genome”, Science, Volume 291, Number 5507, pp 13041351, (2001) 2. International Human Genome Sequencing Consortium , “Initial Sequencing and Analysis of the Human Genome”, Nature, Volume 409, pp 860-921, (2001) 3. E Lai, “Application of SNP Technoloies in Medicine”, Genome Research, Volume 11, pp 927-929, (2001) 4. E Massod, “As Consortium Plans Free SNP Map of Human Genome”, Nature, Volume 398, pp545546, (1999) 5. J Weber, J Che, D David, J Heil, J Opolka, C Volkmann, M Doktycz , K Beattie, “Identification and Analysis of Human Short Insertion/Deletion Polymorphisms”, Am. Society of Hum. Gen.. Oct (1998) 6. K Livak, J Marmaro, J Todd,, “Towards Fully Automated Genome-Wide Polymorphism Screening” , Nature Genetics, Volume 9, pp 341-342, (1995) 7. D Wang et al., “Large Scale Identification, Mapping, and Genotyping of Single Nucleotide Polymorphisms in the Human Genome”, Science, Volume 280, pp 1077-1082, (1998) 8. C Mein et al,, “Evaluation of Single Nucleotide Polymorphism Typing with Invader on PCR Amplicons and its Automation”, Genome Research, Volume 10, pp330-343, (2000) 9. R Koustubh et al., “High Throughput Genotyping with Single Nucleotide Polymorphisms”, Genome Research, Volume 11, pp 1262-1268, (2001) 10. J Hampe et al, “An Integrated System for High Throughput Taqman Based SNP Genotyping”, Bioinformatics, Volume 17, pp 654-655, (2001) 11. http://www.celera.com 12. http://www.appliedbiosystems.com 13. http://www.bioperl.org 14. http://locus.umdnj.edu/ 15. M Perlin, G Lancia, S Ng, “Toward Fully Automated Genotyping: Genotyping Microsatellite Markers By Deconvolution”, Am. J. Hum. Gen., Volume 57, pp 1199-1210, (1995) 16. C Zhoa, J Heil, W Dickenson, L Ott, J Weber et al., “A Computer System for Large Scale STRP Genotyping”, Am. J. of Hum. Gentics., Volume 61, p A302, (1997) 17. http://www.perl.org 18. J Quinlan, “The Morgan Kaufmann Series in Machine Learning”, Morgan Kaufmann Publishers, ISBN 1-55860-238-0, October (1992) 19. I Witten, E Frank, “Data Mining: Practical Machine Learning Tools and Techniques with Java Implementations”, Morgan Kaufmann Publishers, ISBN 1-55860-552-5, (2000) 20. A Clark, “Inference of haplotypes from PCR-amplified samples of diploid populations.”, Mol Biol Evol., Mar 7, pp111-122, (1990) 21. D Meldrum , “Automation For Genomics, Part One”, Genome Research, Volume 10, pp 1081-1092, (2000)