ORIGINAL ARTICLE
An Automated Model to Identify Heart Failure Patients at Risk for 30-Day Readmission or Death Using Electronic Medical Record Data Ruben Amarasingham, MD, MBA,*† Billy J. Moore, PhD,* Ying P. Tabak, PhD,‡ Mark H. Drazner, MD, MSc,§ Christopher A. Clark, MPA,* Song Zhang, PhD,¶ W. Gary Reed, MD,*† Timothy S. Swanson, BA,* Ying Ma, PhD,* and Ethan A. Halm, MD, MPH†¶
Background: A real-time electronic predictive model that identifies hospitalized heart failure (HF) patients at high risk for readmission or death may be valuable to clinicians and hospitals who care for these patients. Methods: An automated predictive model for 30-day readmission and death was derived and validated from clinical and nonclinical risk factors present on admission in 1372 HF hospitalizations to a major urban hospital between January 2007 and August 2008. Data were extracted from an electronic medical record. The performance of the electronic model was compared with mortality and readmission models developed by the Center for Medicaid and Medicare Services (CMS models) and a HF mortality model derived from the Acute Decompensated Heart Failure Registry (ADHERE model). Results: The 30-day mortality and readmission rates were 3.1% and 24.1% respectively. The electronic model demonstrated good discrimination for 30 day mortality (C statistic 0.86) and readmission (C statistic 0.72) and performed as well, or better than, the ADHERE model and CMS models for both outcomes (C statistic ranges: 0.72– 0.73 and 0.56 – 0.66 for mortality and readmissions respectively; P ⬍ 0.05 in all comparisons). Markers of social instability and lower socioeconomic status improved readmission prediction in the electronic model (C statistic 0.72 vs. 0.61, P ⬍ 0.05). Conclusions: Clinical and social factors available within hours of hospital presentation and extractable from an EMR predicted mortality and readmission at 30 days. Incorporating complex social
From the *Center for Clinical Innovation, Parkland Health and Hospital System, Dallas, TX; †Division of General Internal Medicine, Department of Medicine, University of Texas Southwestern Medical Center, Dallas, TX; ‡Clinical Research, CareFusion, Marlborough, MA; §Division of Cardiology, Department of Medicine, University of Texas Southwestern Medical Center, Dallas, TX; and ¶Department of Clinical Sciences, University of Texas Southwestern Medical Center, Dallas, TX. The study was supported in part by the University of Texas System Patient Safety Grant #38171 (R.A., B.M., C.C.) and National Institutes of Health CTSA Grant UL1 RR024982 (S.Z.). Reprints: Ruben Amarasingham, MD, MBA, Center for Clinical Innovation, Parkland Health and Hospital System, 5123 Harry Hines Blvd, Dallas, TX 75235. E-mail:
[email protected]. Supplemental digital content is available for this article. Direct URL citations appear in the printed text and are provided in the HTML and PDF versions of this article on the journal’s Web site (www.lww-medicalcare.com). Copyright © 2010 by Lippincott Williams & Wilkins ISSN: 0025-7079/10/4811-0981
Medical Care • Volume 48, Number 11, November 2010
factors increased the model’s accuracy, suggesting that such factors could enhance risk adjustment models designed to compare hospital readmission rates. Key Words: informatics, quality improvement, health policy (Med Care 2010;48: 981–988)
R
eadmission within 30 days of a prior hospitalization for heart failure (HF) has emerged as a major focus of quality improvement and payment reform. Heart failure is the leading cause of hospitalization among patients over the age of 65 years and numerous studies have found that some combination of careful discharge planning, provider coordination and intensive counseling can prevent subsequent rehospitalizations.1– 6 Nevertheless success has been elusive. Despite 2 decades of research on the subject, a majority of US hospitals struggle to contain readmission rates related to heart failure.2,6,7 For many institutions, applying high intensity interventions broadly to all heart failure patients may be financially prohibitive. Indeed, among US hospitals which developed successful readmission programs in the context of a research study, most subsequently ceased efforts due to financial constraints.4 Programs to reduce readmissions may be more sustainable if they were focused on patients at highest risk, targeted prospectively and in real-time, beginning on the day of admission.1,8 The emergence of the electronic medical record (EMR) may provide a powerful new mechanism to identify high-risk HF patients at the point of care. We hypothesized that an automated model derived from both clinical and nonclinical factors could accurately stratify risk for readmission among HF patients, in part by drawing upon the explanatory power of social, behavioral, and utilization factors. We also hypothesized that the clinical factors which ordinarily predict mortality may be insufficient to predict readmission by themselves. In this study, we construct and validate an electronic model of 30-day readmission risk, using real-time presenton-admission data commonly available to hospitals that employ a basic EMR. We then compare the electronic model’s performance against other benchmark models, including the www.lww-medicalcare.com |
981
Medical Care • Volume 48, Number 11, November 2010
Amarasingham et al
leading claims-based approaches developed by the Center for Medicaid and Medicare Services (CMS) for the purposes of hospital profiling.6,9,10 In addition, we test the electronic model’s capability to predict 30-day mortality, separate and apart from readmission.
METHODS Study Population, Data Collection, and Variables Prediction models were constructed using data from patients admitted to Parkland Memorial Hospital, a large urban academic hospital in Dallas, Texas, between January 1, 2007 and August 31, 2008 with a principal discharge diagnosis of heart failure as indicated by the following International Classification of Diseases, Ninth Revision—Clinical Modification (ICD-9 —CM) Codes 402.01, 402.11, 402.91, 425.1, 425.4, 425.5, 425.7, 425.8, 425.9, 428.0, 428.1, 428.2, 428.21, 428.22, 428.23, 428.3, 428.31, 428.32, 428.33, 428.4, 428.41, 428.42, 428.43, 428.9. Readmissions within 30 days of a prior hospitalization were not designated as index admissions. This approach yielded 1372 index admissions during the period of study.
Main Outcome Variables Death or readmission for any cause within 30 days of discharge separately represented the main outcome variables. Death was defined as those cases in which a patient died within 30 days of discharge; patients who died during the inpatient stay were excluded from the analysis. We identified deceased patients by searching for the last documented encounter in the hospital system’s EMR after the index discharge; patients without an encounter 30 days after discharge were subsequently classified as dead or alive within 30 days of discharge, using the Social Security Death Index. Readmission was defined as rehospitalization for any cause to any hospital within 30 days of discharge of a hospital admission for heart failure. We determined readmissions to any 1 of 136 hospitals in the region using a probabilistic linkage service available through the Dallas-Fort Worth Hospital Council, a regional information sharing initiative. Readmission data were returned deidentified; however, we tested the validity of the linkage by comparing readmissions to the index institution with an indicator variable precoded in the dataset and blinded to the data sharing service. Agreement was 100%. Elective readmissions (administratively coded for both index and readmission hospitals) were not counted as readmissions in this analysis. Candidate risk factor variables for the electronic models had to meet 3 criteria: (1) capable of extraction from the hospital EMR; (2) routinely collected, or available, within the first 24 hours of hospital presentation; and (3) judged by consensus of an interdisciplinary team as reasonably available to most hospitals with a basic EMR on the basis of prior literature.
Independent Variables To model the risk of death on presentation, we used a heart failure severity of illness score developed by Tabak et al in 2007. The Tabak mortality score, previously validated on
982
| www.lww-medicalcare.com
629,420 patients from 195 hospitals, uses automated clinical data to predict risk of in-hospital death.11 This model characterizes risk on the basis of age and the worst value obtained within the first 24 hours of hospital presentation for 17 laboratory and vital sign variables: albumin, total bilirubin, creatine kinase, creatinine, sodium, blood urea nitrogen, partial pressure of carbon dioxide, white blood cell count, troponin-I, glucose, internationalized normalized ratio, brain natriuretic peptide, pH, temperature, pulse, diastolic blood pressure, and systolic blood pressure (Appendix A, Supplemental Digital Content, online only, available at: http://links.lww.com/MLR/A110). We developed a conceptual framework of readmissions based on a review of the literature and clinical expertise.8,12 The Tabak mortality score served as the measure of clinical illness on admission. We additionally collected markers of social, behavioral, and utilization activity that could be obtained using electronic data sources upon presentation to the hospital (Table 1). These additional variables were hypothesized to represent measures of social instability or low socioeconomic status (eg, number of home address changes in the prior year), risky health behavior (eg, history of confirmed cocaine use), or health care utilization patterns (eg, number of emergency room visits in the year prior) that could influence risk for readmission. In addition, because depression or anxiety has been linked to negative health behaviors, we separately identified the presence of these conditions using specific ICD-9 CM codes. All of the variables, including those derived from billing and administrative data, were extracted from the hospital’s electronic medical record and related electronic databases. The hospital employs the EPIC EMR platform (EPIC Systems Corporation, Verona, WI).
CMS and ADHERE Mortality and Readmission Variables Variables necessary to calculate C statistics from the CMS risk-standardized HF readmission and mortality models and the Acute Decompensated Heart Failure Registry (ADHERE) prediction model for HF mortality were collected from the health system’s records.6,9,10,13 Variable definitions for each of the models examined are provided in Appendices A to E (Supplemental Digital Content, online only, available at: http://links.lww.com/MLR/A110). The CMS models were designed to estimate hospital-specific readmission and mortality rates, using administrative claims data to accurately profile hospital performance among Medicare patients admitted with heart failure. The measures are currently in use across the United States. Although the CMS models were not designed to predict 30-day outcomes in real time for actual bedside application, risk adjustment models can be used to predict a future outcome. Therefore, we considered the CMS models excellent benchmarks with which to judge the performance of the electronic model derived in this study. The CMS models rely on administrative data collected in the year prior to, and including, the index admission up to the day of discharge. We collected CMS model data for all patients in this study using billing and administrative data obtained by the health system. Conditions specified in the CMS model © 2010 Lippincott Williams & Wilkins
Medical Care • Volume 48, Number 11, November 2010
TABLE 1. Characteristics of the Study Cohort*, N ⫽ 1372 Characteristics Mortality risk factors Tabak mortality score, mean (SD)† Systolic BP ⬎100 (ref.) 81–100 ⱕ80 Diastolic BP ⬎62 (ref.) 54–62 ⱕ53 Pulse ⬍99 (ref.) ⱖ99 Temperature 95–100 (ref.) ⱕ95 or ⬎100 Arterial PH 7.33–7.49 (ref.) ⬎7.49 7.25–7.33 ⬍7.25 BNP ⱕ100 100–2400 (ref.) ⬎2400 PT-INR ⬍1.25 (ref.) ⱖ1.25 Glucose ⬎70 (ref.) ⱕ70 CK-MB ⱕ9 (ref.) ⬎9 Troponin ⱕ1 (ref.) ⬎1 WBC ⱕ10.9 (ref.) ⬎10.9 Arterial pCO2 35–60 (ref.) ⱕ35 or ⬎60 BUN ⬍35 (ref.) 35–50 50–70 ⬎70 Sodium 135–145 (ref.) 130–135 or ⬎145 ⱕ130 Creatinine ⱕ2 (ref.) ⬎2
© 2010 Lippincott Williams & Wilkins
Study Cohort (N ⴝ 1372) 14.3 (9.7) 1285 (93.7) 84 (6.1) 3 (0.2) 1295 (94.4) 61 (4.4) 16 (1.2) 993 (72.4) 379 (27.6) 1241 (90.5) 131 (9.5) 1323 (96.4) 11 (0.8) 17 (1.2) 21 (1.5) 82 (6.0) 1093 (79.7) 197 (14.4) 969 (70.6) 403 (29.4) 1292 (94.2) 80 (5.8) 1324 (96.5) 48 (3.5) 1350 (98.4) 22 (1.6) 1150 (83.8) 222 (16.2) 1227 (89.4) 145 (10.6) 971 (70.8) 198 (14.4) 113 (8.2) 90 (6.6) 1162 (84.7) 139 (10.1) 71 (5.2) 1079 (78.6) 293 (21.4)
Electronic Heart Failure Stratification
Study Cohort (N ⴝ 1372)
Characteristics CK 35–300 (ref.) ⱕ35 or ⬎300 Bilirubin ⱕ1.4 (ref.) ⬎1.4 Albumin ⬎2.74 (ref.) 2.442.74 ⱕ2.44 Age over 45 yr 18–45 (ref.) Readmission risk factors Clinical History of depression or anxiety‡ Demographic Single Male Race Black Hispanic White plus others Residence census tract in lowest socioeconomic quintile§ No. home address changes, mean (SD) Payment method Medicare Medicaid Commercial insurance Self-pay Other Health behavior History of cocaine use‡¶ History of leaving against medical advice‡ History of missed clinic visit储 Used a health system pharmacy¶ Utilization patterns No. prior inpatient admissions, mean (SD)‡ No. prior emergency room visits, mean (SD)‡ No. prior outpatient visits, mean (SD)‡ Presented to emergency department 6 AM–6 PM for index admission Readmissions at 30 days Deaths
1168 (85.1) 204 (14.9) 1124 (81.9) 248 (18.1) 1294 (94.3) 44 (3.2) 34 (2.5) 1129 (82.3) 243 (17.7)
230 (16.8) 923 (67.3) 834 (60.8) 852 (62.1) 262 (19.1) 256 (18.7) 812 (59.2) 1.4 (2.6) 360 (26.2) 265 (19.3) 81 (6.0) 203 (14.8) 451 (32.9) 166 (12.1) 47 (3.4) 598 (43.6) 903 (65.8) 1.14 (1.7) 1.30 (5.1) 7.75 (10.7) 699 (50.9) 331 (24.7) 43 (3.1)
*Values are expressed as number (percentage) unless otherwise indicated. † The Tabak mortality score includes age, albumin, total bilirubin, CPK, creatine, Na, BUN, arterial pCO2, WBC, troponin, glucose, PT, INR, BNP, arterial pH, temperature, pulse, diastolic BP, systolic BP (Appendix A, online only). ‡ Calculated from 12-month period prior to index admission. § Census tracts ranked by principal component score based on median household income, % poverty level, % some college or higher, % white (Appendix E, online only). ¶ Positive laboratory test result for cocaine use. 㛳 Calculated from 6-month period prior to index admission. SD indicates standard deviation; BUN, blood urea nitrogen; BP, blood pressure; WBC, white blood cell; BNP, B-type Natriuretic Peptide; PT-INR, Prothrombin Time and International Normalized Ratio; CK-MB, Creatinine Kinase-MB; pCO2, partial pressure of Carbon Dioxide.
www.lww-medicalcare.com |
983
Amarasingham et al
were classified as present if noted in the year prior to the discharge day of the index hospitalization. The ADHERE mortality model was designed to predict in-hospital mortality from acute decompensated heart failure on admission.13 The ADHERE model can be calculated electronically through an EMR, and has been used by hospitals to help stratify HF patients on admission. Developed through classification and regression tree (CART) analysis, the model is based on 3 binary variables found to be predictive of inpatient mortality as classified on admission: blood urea nitrogen (BUN) ⬎43 mg/dL, systolic blood pressure ⬍115 mm Hg, and creatinine ⬎2.75 mg/dL. These variables were obtained for all patients in this study and categorized as specified in the ADHERE model.
Statistical Analyses Derivation of the Electronic Readmission Model To derive the electronic readmission model, patients who died within the inpatient or 30-day postdischarge periods without readmission were excluded from the analysis. The model was constructed in 4 stages. First, univariate relationships were examined through logistic regression at threshold significance of P ⱕ 0.20. Continuous variables were examined for nonlinear effects by testing the contributions of spline functions and variable transformations. Second, to protect against over-fitting, the maximum number of variables that could be used in the prediction model was estimated using a shrinkage analysis.14 Third, candidate variables were ranked by P value using bootstrapping with replacement in 1000 multivariate logistic regression iterations.15 Final model variables were selected on the basis of conceptual and statistical significance, including minimizing the Bayes Information Criterion (BIC), and did not exceed the maximum number of variables permitted by shrinkage analysis. In the fourth and last stage, model coefficients were determined using bootstrapping with replacement in logistic regressions containing only the final variables.16 To account for the effects of patients with more than 1 index admission, we applied robust variance-covariance matrix estimates to all models.17 The model was validated using several approaches. Model discrimination was assessed by the C statistic and compared with the performance of the ADHERE and CMS models. Model calibration was evaluated using the HosmerLemeshow 2 goodness-of-fit test. We internally validated the model using the cross-validation methodology.14,18 In this approach, the full sample was split into random derivation (75%) and validation (25%) subsamples 1000 times. The model was separately reconstructed for each of the derivation samples and then tested on the corresponding validation subsample. C statistics for the derivation and validation subsamples were then computed for each iteration and averaged among all iterations. Using cut-points determined by the derivation subsamples, 5 risk categories were created based on quintiles of predicted risk and graphically assessed in the validation samples. To assess the association between readmission time and the predicted risk, Kaplan-Meier curves were constructed for the stratified risk groups.
984
| www.lww-medicalcare.com
Medical Care • Volume 48, Number 11, November 2010
Prior to model development, we examined all available variables for missing values. Less than 2% of patient vital signs were not recorded electronically; these were manually abstracted from paper records. The remaining variables had less than 1% missing data. For categorical variables with missing data, a missing category was created and the readmission rate for the missing group was compared with and pooled into the most appropriate reference group. For continuous variables, a multiple regression imputation algorithm was employed (Appendix F, Supplemental Digital Content online only, available at http://links.lww.com/MLR/A110).19
Assessing and Comparing Model Performance Five different HF models were compared (the CMS mortality model, the CMS readmission model, the ADHERE mortality model, the Tabak mortality score, and the electronic readmission model) using data from the total study sample for both 30-day mortality and readmission. The incremental discriminative performance of the models was sequentially assessed using the C statistic and the integrated discrimination improvement (IDI) index for each of the outcome measures.20,21 The IDI is useful because it is capable of detecting smaller incremental improvements in risk assessment models than the C statistic (Appendix G, Supplemental Digital Content, online only, available at: http://links.lww.com/MLR/ A110). Published regression coefficients were used to derive the C statistics for the Tabak mortality score, and the CMS mortality and readmission models. Published laboratory cut-points were used to derive C statistics for the ADHERE mortality model. In this study, all confidence intervals were computed at the 95% level. Analyses were conducted using STATA statistical software (version 10.0; STATA Corp, College Station, TX) and RTREE (Available at: http://peace.med.yale.edu/pub). The University of Texas Southwestern Medical Center Institutional Review Board approved the research protocol.
RESULTS Description of the Derivation and Validation Cohorts Of 1372 index admissions for heart failure, 43 (3.1%) resulted in death and 331 (24.1%) resulted in rehospitalization within 30 days of discharge. Of those rehospitalized, 216 (65.3%) were readmitted to the index hospital. The cohort is characterized by being predominantly male (60.8%), black (62.6%), and single (67.3%), with an average age of 56.5 years. Table 1 shows the characteristics of the study cohort used to construct the electronic readmission model.
Predictors of Readmission Results of univariate and multivariate readmission analyses are shown in Tables 2 and 3. Linear shrinkage analysis did not reveal over-fitting. The inclusion of the Tabak mortality score provided a strong and statistically significant predictor of readmission in the multivariate analysis. Increasing age was also associated with subsequent readmission in the univariate analysis; however, because age was a component of the Tabak mortality score, it was not included sepa© 2010 Lippincott Williams & Wilkins
Medical Care • Volume 48, Number 11, November 2010
Electronic Heart Failure Stratification
TABLE 2. Univariate Predictors of 30-Day Readmission for Heart Failure, N ⫽ 1372
TABLE 3. Multivariate Predictors of 30-Day Readmission for Heart Failure for Electronic Readmissions Model, N ⫽ 1372
Variables
Variables
Odds Ratio (95% CI)
P
1.54 (1.34–1.76)
⬍0.001
1.66 (1.20–2.31)
0.002
1.55 (1.17–2.07) 1.28 (0.99–1.67)
0.002 0.06
1.47 (1.03–2.08) 1.11 (0.73–1.70) 1.00 1.10 (0.99–1.21) 1.49 (1.15–1.94)
0.03 0.62 0.07 0.003
1.16 (1.11–1.21)
⬍0.001
1.90 (1.38–2.63) 1.63 (1.14–2.35) 1.16 (0.65–2.07) 0.96 (0.62–1.48) 1.00
⬍0.001 0.01 0.61 0.85
2.12 (1.46–3.06) 2.67 (1.49–4.78)
⬍0.001 0.001
1.93 (1.50–2.49) 1.48 (1.11–1.97)
⬍0.001 0.01
1.34 (1.25–1.43) 1.07 (1.01–1.13) 1.02 (1.01–1.03) 1.29 (1.00–1.66)
⬍0.001 0.03 0.001 0.05
Mortality risk factors Tabak mortality score (per 10 point increase) Readmission risk factors Clinical History of depression or anxiety Demographic Single Male sex Race Black Hispanic White plus others Age (per 10 yr) Residence census tract in lowest socioeconomic quintile Number of home address changes Payment method Medicare Medicaid Commercial Self-pay Other Health behavior History of cocaine use History of leaving against medical advice History of missed clinic visit Used a health system pharmacy Utilization patterns No. prior inpatient admissions No. prior emergency room visits No. prior outpatient visits Presented to emergency department 6 AM–6 PM for index admission
rately in the multivariate analysis. A number of demographic, health behavior, and utilization predictors of readmission remained significant (P ⱕ 0.05) in the multivariate analysis including single status, male status, Medicare, number of home address changes, history of depression or anxiety, history of confirmed cocaine use, number of prior inpatient admissions, and presentation time. Three variables (residence in a census tract of the lowest socioeconomic quintile, a history of missed clinic visits, and use of a health system pharmacy) were weakly significant but were retained in the model because of their conceptual significance, contribution to model calibration, and/or minimization of the BIC.
Electronic Readmission Model Validation The electronic readmission model produced an overall C statistic of 0.72 (95% CI: 0.70 – 0.75). There was no evidence of lack of fit (P ⬎ 0.85). The average C statistics from the cross-validation analysis was 0.73 (95% CI: 0.71– © 2010 Lippincott Williams & Wilkins
Mortality risk factor Tabak mortality score (per 10 point increase) Readmission risk factors Clinical History of depression or anxiety Demographic Single Male Number of home address changes Medicare Residence census tract in lowest socioeconomic quintile Health behavior History of cocaine use History of missed clinic visit Used a health system pharmacy Utilization patterns No. prior inpatient admissions Presented to emergency department 6 AM–6 PM for index admission
Odds Ratio (95% CI)
P
1.52 (1.31–1.76
⬍0.001
1.44 (1.00–2.07)
0.05
1.47 (1.08–2.01) 1.37 (1.02–1.84) 1.13 (1.07–1.19) 1.59 (1.17–2.17) 1.30 (0.98–1.74)
0.02 0.03 ⬍0.001 0.004 0.08
1.78 (1.17–2.72) 1.35 (0.99–1.83) 0.72 (0.51–1.02)
0.01 0.06 0.08
1.17 (1.07–1.27) 1.38 (1.05–1.81)
⬍0.001 0.02
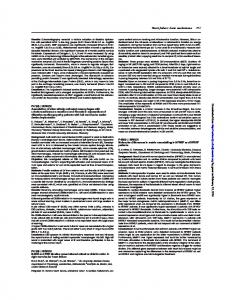
0.75) and 0.69 (95% CI: 0.63– 0.74) for the derivation and validation samples, respectively. The electronic model was capable of stratifying patients across a wide range of risk and derivation and validation subsamples were highly concordant across this spectrum of risk (Fig. 1A). Patients in higher risk categories of the electronic model were readmitted earlier over the 30-day postdischarge period in a Kaplan-Meier analysis (P ⬍ 0.001, Fig. 1B).
Model Comparisons for 30-Day Mortality Prediction The ADHERE mortality model and the CMS risk adjustment mortality model displayed moderately strong levels of discrimination for 30-day mortality as measured by the C statistic (0.73 and 0.72, respectively; Table 4). The Tabak mortality score and the electronic readmissions model significantly exceeded the predictive capability of the ADHERE and CMS mortality models (C statistic 0.84, CI: 0.82– 0.86 and 0.86, CI: 0.84 – 0.88, respectively; P ⬍ 0.05 in both comparisons).
Model Comparisons for 30 Day Readmission Prediction The ADHERE model had the lowest predictive capability among the 4 models for 30 day readmission with a C statistic of 0.56 (CI: 0.54, 0.59; Table 4). The electronic readmission model significantly exceeded the performance of the ADHERE mortality model, the CMS readmission model, and the Tabak mortality score (C statistic of 0.72, CI: 0.70, 0.75; IDI index of 0.115, CI: 0.094, 0.136). www.lww-medicalcare.com |
985
Medical Care • Volume 48, Number 11, November 2010
Amarasingham et al
FIGURE 1. Model Performance. A, thirty day readmission rates by predicted risk quintile. Risk categories were derived from quintiles of predicted risk (very low to very high) in the derivation samples. Error bars indicate 95% confidence intervals for the readmission rates in each category. B, Percent patients readmission free over the 30-day postdischarge interval stratified by very high, intermediate, and very low risk.
DISCUSSION Existing multivariable models that might be used to identify heart failure patients at high risk for readmission would have serious limitations in actual practice. A recent systematic review indicated that the strongest models achieve only modest predictive capability for readmission (C statistics did not exceed 0.6).7 Prior models are primarily dependent on retrospective administrative claims data and are not designed for use early in the course of the hospitalization. Much of the previous work was restricted to the Medicare population, limiting its potential generalizability. And few models, to our
986
| www.lww-medicalcare.com
knowledge, are calculable in real-time using automated data present on admission. In this study, we found that a model constructed from data extracted from a hospital EMR can predict both readmission and mortality among HF patients with accuracy equal to leading claims-based and clinical severity models. This study extends an advancing field of work that successfully characterizes patient risk on the basis of automated and potentially real-time data.11,22–24 Methods that identify high-risk patients instantaneously, accurately, and automatically could accelerate multidisciplinary care path© 2010 Lippincott Williams & Wilkins
Medical Care • Volume 48, Number 11, November 2010
Electronic Heart Failure Stratification
TABLE 4. C Statistic and Integrated Discrimination Improvement Index for Multivariate Logistic Regression Models Predicting 30-Day Mortality and 30-Day Readmission in the Total Study Sample 30-Day Mortality (N ⴝ 1372)* Model
30-Day Readmission (N ⴝ 1341)†
C Statistic (95% CI)
IDI‡ (95% CI)
C Statistic (95% CI)
IDI‡ (95% CI)
0.73 (0.70–0.75) 0.72 (0.70–0.75) 0.84 (0.82–0.86) 0.86 (0.84–0.88)
— 0.025 (⫺0.020–0.069) 0.040 (0.010–0.071) 0.098 (0.050–0.145)
0.56 (0.54–0.59) 0.66 (0.63–0.68) 0.61 (0.59–0.64) 0.72 (0.70–0.75)
— 0.014 (0.005–0.023) 0.017 (0.008–0.025) 0.115 (0.094–0.136)
ADHERE mortality model CMS risk adjustment models§ Tabak mortality model Electronic readmissions model¶
*Death is defined as all patients who died in the index inpatient stay and in the 30-day post-discharge period for any cause. † The readmission analysis excludes all patients who died in-hospital or in the 30 day post-discharge period. ‡ The ADHERE model was used as the referent for all IDI analyses. § CMS 30-day risk adjusted mortality model was used for the mortality analysis; CMS 30-day risk adjusted readmission model was used for readmission analysis. ¶ Includes Tabak mortality score, history of depression or anxiety, single status, male status, number of home address changes, Medicare status, residence census tract in lowest socioeconomic quintile, history of confirmed cocaine use, history of missed clinic visit, use of a health system pharmacy, number of prior admissions, presented to emergency department between 6 am and 6 pm for index admission. ADHERE indicates Acute Decompensated Heart Failure Registry; CMS, Center for Medicaid and Medicare Services (Appendix D, online only); IDI, integrated discrimination improvement; CI, confidence interval.
ways well before the day of discharge. Our findings provide evidence that such approaches are now possible using electronic medical records. The electronic readmission model is also unique in that it predicts both mortality and readmission within 24 hours of admission. Thus a single approach could advise clinical and nonclinical decision making simultaneously early in a patient’s course; for example, patients at low risk could be considered for early hospital discharge, whereas those at high risk might be triaged to specialized hospital services, intensive case management, and direct home visits postdischarge. Decision support systems that incorporate such models may help institutions effectively allocate limited resources. Electronic predictive models are particularly attractive since they may be implemented quickly, and at low cost, once an EMR has been implemented. Although numerous studies have demonstrated the prognostic capability of clinical factors with respect to heart failure mortality, our results suggest that readmissions may be the product of a much broader set of forces involving the clinical, social, behavioral, and economic circumstance of the patient.8,25–27 The ADHERE model, a widely accepted clinical risk stratification tool for heart failure, achieved good prediction for mortality but performed only slightly better than chance for readmission (C statistic 0.73 and 0.56, respectively). Likewise, the Tabak mortality score, which is limited to clinical data alone, produced outstanding discrimination for mortality, but only modest performance for readmission (0.84 and 0.61, respectively). The addition of nonclinical factors, particularly markers of social instability and lower socioeconomic status, substantially improved prediction in the electronic readmission model compared with all other models, including the CMS risk adjustment model for readmissions (C statistic 0.72 vs. 0.66, respectively). The difficulties of caring for patients from lower socioeconomic groups have been exquisitely described.28 –30 The challenges extend to a number of important and often unreimbursed tasks central to the prevention of readmissions such as pre- and postvisit planning, language translation, medication education, and postdischarge communication. Current © 2010 Lippincott Williams & Wilkins
risk adjustment models may not define a patient’s social or environmental risk with sufficient granularity to allow safety net institutions to compete effectively in pay-for-performance environments.27,31,32 Risk adjustment models that account for complex social and behavioral factors could help reveal (and potentially reward) institutions that truly excel in the care of these patients. Necessary markers of the patient’s social environment are largely absent from claims data however. This study raises the possibility that such factors may be extracted from electronic medical records. This is an exploratory study with important limitations. Our model is based on data extracted retrospectively from a single urban health system with a higher proportion of younger, minority, and lower socioeconomic patients than the average US hospital. This setting provided an opportunity to test the specific contribution of social factors on subsequent readmission in patients with both clinical and social risks. Although the rate of readmissions in this sample (24.1%) is in line with other state and national analyses, the generalizability of this model to other hospital populations is unknown and requires further investigation.2,6 We have partially established context and validity for the model by building on the previously established Tabak model and by providing direct comparisons with other well-known models. However, the model was derived and validated in the same population using the cross-validation methodology. Ultimately, the model will require validation among broader hospital and patient populations before it could be routinely applied outside of the hospital in which it was developed. This is an area for future investigation. Although the model we present achieves higher cstatistics relative to prior models, its predictive capability is limited to that which can be forecasted using only variables present on admission; the model is not sufficient, therefore, to replace careful bedside clinical judgment throughout the hospital course. It may be useful, however, in ranking admitted heart failure patients according to their risk when it is neither practical nor possible for a physician to personally review each case. Automated ranking would allow important resources to be prioritized in the background at the system www.lww-medicalcare.com |
987
Amarasingham et al
Medical Care • Volume 48, Number 11, November 2010
level. Finally, there may be questions raised as to whether hospitals with minimal automation can take advantage of a model built on exclusively electronic data. In considering potential variables, we took great care to select elements that would be reasonably available to hospitals with a basic electronic medical record. Recent policy initiatives suggest that the adoption of electronic medical records may accelerate at a national level33; if so, automated models may have applied value now or in the near future at large scale. It is possible that the prediction model we present could be improved by including data from the entire hospital stay. However, a model that cannot be exercised until the last inpatient day is likely to be less useful in the average hospital environment, where the day of discharge is a hectic, and sometimes, chaotic period for patients and providers. A model that stratifies a patient’s risk on admission would allow earlier activation and targeting of potentially scarce resources, such as intensive case management. Preventing readmission and death after hospitalization for heart failure is complex. Automated predictive models may be a powerful tool for this effort. Future studies should evaluate the use of these models prospectively in real-world practice to determine their clinical and cost-effectiveness.
netorg/dcs/ContentServer?c⫽Page&pagename⫽QnetPublic%2FPage%2 FQnetTier4&cid⫽1219069855841 2008. Accessed June 30, 2009. Krumholz H, Normand S, Galusha D, et al. Risk adjustment models for AMI and HF 30-day mortality. Report prepared for the Centers for Medicare and Medicaid Services. Available at: http://wwwqualitynetorg/dcs/ ContentServer?c⫽Page&pagename⫽QnetPublic%2FPage%2FQnetTier3& cid⫽1163010421830. Accessed June 30, 2009. Tabak YP, Johannes RS, Silber JH. Using automated clinical data for risk adjustment: development and validation of six disease-specific mortality predictive models for pay-for-performance. Med Care. 2007; 45:789 – 805. Ashton CM, Wray NP. A conceptual framework for the study of early readmission as an indicator of quality of care. Soc Sci Med. 1996;43: 1533–1541. Fonarow GC, Adams KF Jr, Abraham WT, et al. Risk stratification for in-hospital mortality in acutely decompensated heart failure: classification and regression tree analysis. JAMA. 2005;293:572–580. Harrell FE, Lee KL, Mark DB. Tutorial in biostatistics multivariable prognostic models: issues in developing models, evaluating assumptions and adequacy, and measuring and reducing errors. Stat Med. 1996;15: 361–387. Efron B, Tibshirani R. An Introduction to the Bootstrap. New York, NY: Chapman & Hall/CRC Press; 1998. Harrell F. Regression Modeling Strategies. New York, NY: SpringerVerlag; 2001. Wei L, Lin D, Weissfeld L. Regression analysis of multivariate incomplete failure time data by modeling marginal distributions. J Am Stat Assoc. 1989;84:1065–1073. Van Houwelingen J, Le Cessie S. Predictive value of statistical models. Stat Med. 1990;9:1303–1325. Little R, Rubin D. Statistical Analysis With Missing Data. Hoboken, NJ: John Wiley & Sons; 2002. Pepe MS, Feng Z, Gu JW. Comments on ’evaluating the added predictive ability of a new marker: from area under the ROC curve to reclassification and beyond’ by M. J. Pencina et al. Statistics in medicine (doi: 10.1002/sim. 2929). Stat Med. 2008;27:173–181. Pencina MJ, D’Agostino RB Sr, D’Agostino RB Jr, et al. Evaluating the added predictive ability of a new marker: from area under the ROC curve to reclassification and beyond. Stat Med. 2008;27:157–172; discussion 207–112. Escobar GJ, Greene JD, Scheirer P, et al. Risk-adjusting hospital inpatient mortality using automated inpatient, outpatient, and laboratory databases. Med Care. 2008;46:232–239. Render ML, Kim HM, Welsh DE, et al. Automated intensive care unit risk adjustment: results from a national veterans affairs study. Crit Care Med. 2003;31:1638 –1646. Pine M, Jordan HS, Elixhauser A, et al. Enhancement of claims data to improve risk adjustment of hospital mortality. JAMA. 2007;297:71–76. Anderson GF, Steinberg EP. Hospital readmissions in the medicare population. N Engl J Med. 1984;311:1349 –1353. Mulvey GK, Wang Y, Lin Z, et al. Mortality and readmission for patients with heart failure among US news and world report’s top heart hospitals. Circ Cardiovasc Qual Outcomes. 2009;2:558 –565. Fonarow GC, Peterson ED. Heart failure performance measures and outcomes: real or illusory gains. JAMA. 2009;302:792–794. Werner RM, Goldman LE, Dudley RA. Comparison of change in quality of care between safety-net and non-safety-net hospitals. JAMA. 2008; 299:2180 –2187. Fiscella K, Epstein RM. So much to do, so little time: care for the socially disadvantaged and the 15-minute visit. Arch Intern Med. 2008; 168:1843–1852. Chien AT, Chin MH. Incorporating disparity reduction into pay-forperformance. J Gen Intern Med. 2009;24:135–136. Wang CJ, Conroy KN, Zuckerman B. Payment reform for safety-net institutions—improving quality and outcomes. N Engl J Med. 2009;361: 1821–1823. Bhalla R, Kalkut G. Could medicare readmission policy exacerbate health care system inequity? Ann Intern Med. 2010;152:114 –117. Blumenthal D. Stimulating the adoption of health information technology. N Engl J Med. 2009;360:1477–1479.
10.
11.
12.
13.
14.
15. 16. 17.
18.
ACKNOWLEDGMENTS The authors thank Linda Calvillo-King, MD, MPH (University of Texas Southwestern Medical Center) and Jewel Brookins (Parkland Health & Hospital System) for their assistance collecting data. The authors also thank the Dallas-Fort Worth Hospital Council Foundation for assisting in the collection of post-hospitalization data through the information sharing initiative. REFERENCES 1. Ni H, Nauman D, Burgess D, et al. Factors influencing knowledge of and adherence to self-care among patients with heart failure. Arch Intern Med. 1999;159:1613–1619. 2. Jencks SF, Williams MV, Coleman EA. Rehospitalizations among patients in the Medicare fee-for-service program. N Engl J Med. 2009; 360:1418 –1428. 3. Gwadry-Sridhar FH, Flintoft V, Lee DS, et al. A systematic review and meta-analysis of studies comparing readmission rates and mortality rates in patients with heart failure. Arch Intern Med. 2004;164:2315–2320. 4. Seow H, Phillips CO, Rich MW, et al. Isolation of health services research from practice and policy: the example of chronic heart failure management. J Am Geriatr Soc. 2006;54:535–540. 5. Phillips CO, Wright SM, Kern DE, et al. Comprehensive discharge planning with postdischarge support for older patients with congestive heart failure: a meta-analysis. JAMA. 2004;291:1358 –1367. 6. Keenan PS, Normand SL, Lin Z, et al. An administrative claims measure suitable for profiling hospital performance on the basis of 30-Day all-cause readmission rates among patients with heart failure. Circ Cardiovasc Qual Outcomes. 2008;1:29 –37. 7. Ross JS, Mulvey GK, Stauffer B, et al. Statistical models and patient predictors of readmission for heart failure: a systematic review. Arch Intern Med. 2008;168:1371–1386. 8. Arbaje AI, Wolff JL, Yu Q, et al. Postdischarge environmental and socioeconomic factors and the likelihood of early hospital readmission among community-dwelling medicare beneficiaries. Gerontologist. 2008;48:495–504. 9. Krumholz HM, Normand SL, Keenan PS, et al. Hospital 30-day heart failure readmission measure methodology. Report prepared for the Centers for Medicare and Medicaid Services. Available at: http://wwwquality
988
| www.lww-medicalcare.com
19. 20.
21.
22.
23.
24. 25. 26.
27. 28.
29.
30. 31.
32. 33.
© 2010 Lippincott Williams & Wilkins