application, the developer has a way to measure the quality of both the test and the ..... hire a person to fill that position and would include education, skills with a ...
To appear in Proceedings of the 33rd Annual IEEE International Computer Software and Applications Conference (COMPSAC 2009), July 2009.
An Economical Approach to Usability Testing Carl J. Mueller, Dan Tamir, Oleg V. Komogortsev, Liam Feldman Texas State University-San Marcos {carl.mueller, dt19, ok11, lf1081}@txstate.edu Abstract Many software engineers consider usability testing as one of the more expensive, tedious and least rewarding tests to implement. Making usability testing less expensive and more rewarding requires having results that pinpoint issues in the software and do not require expensive consultants and facilities. To accomplish these goals this paper presents a novel way of measuring software usability and an approach to designing usability tests that does not require external consultants or expensive laboratory facilities. The usability testing approach discussed in this paper also permits testing earlier in the development process. One of the key elements to this technique is the use of traditional testing concepts and techniques such as scenario based testing to measure productivity and learnability of the subject. By constructing test cases or tasks to measure the learnability of the application, the developer has a way to measure the quality of both the test and the software.
1. Introduction A 2007 survey conducted of Swiss software engineers found that only 37.9% conducted usability tests [17]. Of the 62.1% not conducting usability tests, the Swiss study found that 7.9% of respondents find usability tests useless and 40.9% cited them as useful; yet they did not conduct usability testing. The authors state that they did not investigate the reason for this and other usability deficiencies but believe them to be a result of “poor awareness of the importance of UIs” (User Interface) [17]. For software engineers, not understanding the importance of user interfaces implies that they are not aware of the growing volume of reports about user dissatisfaction and product disasters [4, 9], and all the material written to improve user interface design. Rather than a lack of understanding, it is possible that software engineers believe that usability testing is of limited value because:
1.
Usability testing is expensive. It requires an expert to construct, conduct, and evaluate the tests, dozens of subjects to participate and expensive dedicated laboratory facilities to obtain good results. 2. Usability testing done at the end of the development process can cause serious delays in deploying the product. 3. Usability testing results frequently only indicate that a problem exists but not what is causing the problem. Many of the methods of evaluating the usability of a software application rely on measuring the time to complete a task [1, 2, 11]. Time to complete a task or time on task is a very good approximation of user productivity. Time on task is a measurement that is easy to make, but it has a number of components that are difficult to separate. For example, a high time on task could be caused by a poor system, network performance, or interface design. Measuring usability in terms of user-effort eliminates some of these system issues, resulting in high time on task values, and permits developers to focus on the interface design. It is possible to obtain significant test results with a relatively low cost approach to usability testing using normal software testing techniques. For example, in researching a novel effort-based measure of usability [8], researchers constructed a usability test identifying two missing functions, a Graphic User Interface (GUI) issue, and a performance issue in two commercial applications, without expensive consultants, facilities and equipment. It was possible to produce these results because of the effort-based view of usability and the use of accepted functional testing techniques.
2. Effort-based Usability Although an effort-based usability metric applicable to this model is in its early stages of development, most of the common factors that relate to a user completing a task are well identified. Easiest sources of effort to identify were the mechanical
To appear in Proceedings of the 33rd Annual IEEE International Computer Software and Applications Conference (COMPSAC 2009), July 2009.
𝐸𝑚𝑒𝑛𝑡𝑎𝑙 𝐸= 𝐸 𝑝ℎ𝑦𝑠𝑖𝑐𝑎𝑙 𝐸𝑚𝑒𝑛𝑡𝑎𝑙 = 𝐸𝑝ℎ𝑦𝑠𝑖𝑐𝑎𝑙 Where: 𝐸𝑚𝑒𝑛𝑡𝑎𝑙 𝐸𝑒𝑦𝑒 _𝑚𝑒𝑛𝑡𝑎𝑙 𝐸𝑜𝑡 ℎ𝑒𝑟 _𝑚𝑒𝑛𝑡𝑎𝑙 𝐸𝑝ℎ𝑦𝑠𝑖𝑐𝑎𝑙 𝐸𝑚𝑎𝑛𝑢𝑎𝑙
_𝑝ℎ𝑦𝑠𝑖𝑐𝑎𝑙
𝐸𝑒𝑦𝑒 _𝑝ℎ𝑦𝑠𝑖𝑐𝑎𝑙 𝐸𝑜𝑡 ℎ𝑒𝑟 _𝑝ℎ𝑦𝑠𝑖𝑐𝑎𝑙
𝐸𝑒𝑦 𝑒𝑚𝑒𝑛𝑡𝑎𝑙 𝐸𝑜𝑡 ℎ𝑒𝑟 _𝑚𝑒𝑛𝑡𝑎𝑙
𝐸𝑚𝑎𝑛𝑢𝑎𝑙 _𝑝ℎ𝑦𝑠𝑖𝑐𝑎𝑙 𝐸 = 𝑒𝑦𝑒 _𝑝ℎ𝑦𝑠𝑖𝑐𝑎𝑙 𝐸𝑜𝑡 ℎ𝑒𝑟 _𝑝ℎ𝑦𝑠𝑖𝑐𝑎𝑙
amount of mental effort to complete the task. amount of mental effort necessary to move and focus the eyes to complete the task. amount of unspecified mental effort necessary to complete the task. amount of physical effort to complete the task. amount of manual effort to complete the task. Manual effort includes, but is not limited to, the movement of fingers, hands, arms, etc. amount of eye physical effort to complete the task. amount of unspecified physical effort to complete the task.
It is relatively easy to acquire mouse and keyboard activity and mouse-keyboard transfers to estimate the physical effort (𝐸𝑚𝑎𝑛𝑢𝑎𝑙 _𝑝ℎ𝑦𝑠𝑖𝑐𝑎𝑙 ). There are a number of methods to convert eye activity measured by an eye-tracking device into an effort approximation (𝐸𝑒𝑦𝑒 _𝑝ℎ𝑦𝑠𝑖𝑐𝑎𝑙 ). Measuring cognitive load or mental activity is still an active research topic and will probably remain that way for quite some time. One approach to measuring mental effort currently under investigation is to measure eye movement and pupil diameter Providing an accurate measure of mental effort (𝐸𝑚𝑒𝑛𝑡𝑎𝑙 ) is still several years in the future. Consider the following example. Assume a set of 𝑛 subjects selected at random complete a set of 𝑘 tasks. Further, assume that the subjects are computer literate but unfamiliar with the application under evaluation. The objective of each task is to make travel reservations, and each task requires about the
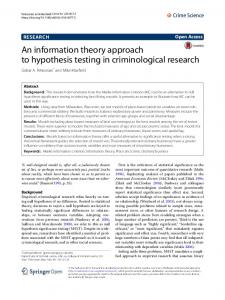
same effort. The set of k tasks have the same scenario with different data and different constraints. Typically, as subjects become more familiar with an application, the time to complete tasks with the same scenario becomes shorter and shorter [6]. When plotting the Time-On-Task (TOT) averages (𝑇𝑎𝑣𝑔 ) for these subjects, a curve with a strong fit to a power law curve is said to reflect learning or represents a learning curve [6, 13, 16]. TOT is composed of a number of elements including a number of software related characteristics such as software performance and the effort expended by the subjects to complete a task. Like time, the effort to complete a task should decrease at a similar rate. Therefore it should be possible to construct a learning curve by plotting average effort (𝐸𝑎𝑣𝑔 ) expended for a task with similar properties to those observed in a curve based on Time. Figure 1 illustrates a hypothetical learning based on average effort to complete a set of tasks with a common scenario. It is assumed that learning, to an acceptable level, occurs when the average effort (𝐸𝑎𝑣𝑔 ) is within some percentage of an expected level of effort (𝐸𝑒𝑥𝑝 ). Expected effort (𝐸𝑒𝑥𝑝 ) is the effort that the interface designer expects an expert to expend to complete tasks. The tasks where the subject’s effort reaches this acceptable level of performance is the learning point 𝐿𝑃 . Summing the average task duration to the left of the learning point 𝐿𝑃 indicates how much time 𝐿 𝑇 the average subject requires to reach an acceptable level of performance. Data to the right of learning point 𝐿𝑃 describes the amount of effort required to accomplish a task using a specific software application.
Time or Effort
sources of effort when working on a computer, such as mouse and keyboard activity and mouse-keyboard transfer operations. It is a little more difficult to identify and quantify some of the other factors such as eye effort and mental effort. All of the effort, 𝐸, to complete a computer task is defined by the following vectors:
Eavg Eexp LT Lp Tasks
Figure 1. Hypothetical Effort Model
To appear in Proceedings of the 33rd Annual IEEE International Computer Software and Applications Conference (COMPSAC 2009), July 2009. Even though this research uses extensive data logging facilities and a sophisticated eye-tracking device, this paper presents results from only those tools and techniques that are available to all software engineers.
3. Experiment 3.1
Planning
To determine if the notion of effort-based usability evaluation has merit, the usability of two web-based travel reservation systems, called System A and System B, were used as the target applications in this paper. Twenty (20) subjects volunteered to participate in the experiment, ten (10) subjects for each system. There is much controversy on the number of subjects necessary for a usability test [3]. Nielsen’s recommendations for the number of subjects for logging actual use protocol calls for 20 subjects [11]. A web source, also by Nielsen, suggests six subjects [12]. In the travel reservation experiment, all of the subjects were undergraduate students at Texas State University, with limited or no background in software development, ranging from 18 to 35 years of age.
3.2
flight to one goal’s destination. The solution was to change the destination of the goal and eliminate the data from the subject that discovered the defect. This defect was a result of insufficient testing of the goals. Dr./Ms./Mr. ____________ is presenting a paper at the ______________ conference being held in _______________ at the _________________. He/she is presenting his/her paper at 10A.M., but he/she must be there for the opening session at 8:30 A.M. The conference will end at 6P.M. on ____________ and Dr./Ms./Mr. _____________ must be there for the closing session. Dr./Ms./Mr. ________________ is traveling from ______________, and would like a non-stop flight to ___________________. The conference is at the __________________ hotel on ___________ to ____________, but Dr./Ms./Mr. __________ feels that this hotel is outside of the range of his/her budget of ________ for the travel. Because of the high cost of the hotel he/she wants to stay at a hotel within ____________ miles of the conference center with the following amenities: 1. 2. 3. 4.
Execution
Authorization to conduct human subject testing was granted from the Institutional Review Board of Texas State University-San Marcos. The protocol for this research further specified strict procedural guidelines in order to control for an unusually large number of intrinsic variables. To ensure that facilitators adhered to the test protocol, they were provided with detailed written instructions. Facilitators kept an observation log in order to validate the test protocol. Subjects also completed a post goal questionnaire. These two items were very useful in later analysis. A test session consisted of first screening the subjects to ensure that they qualified for the experiment, and then, if qualified, giving them the first task based on the Goal/Task Template shown in Figure 2. After the completion of each task, the subject completed a questionnaire capturing their feeling about the task. Because the experiment was using eye-tracking equipment that required subjects to sit in a fixed position, they were given a short break. This process continued until the subject completed all 10 tasks in the protocol. At the beginning of the evaluation of System B, a subject discovered that System B did not provide a
___________________________ ___________________________ ___________________________ ___________________________
He/she will need a car to get around at the conference city. Again, because of budget constraints, he/she does not want to spend more than ________/day for the car.
Figure 2. Goal/Task Template
3.3
Results
To paraphrase Glenford Myers [10], a good evaluation is one that finds issues. The experimental results met all of the researcher’s expectations and provided a few surprises. First, it was possible to identify specific functionality and interface design issues. Second, the results clearly indicate that the techniques and procedures used are suitable for generating data to make a comparison between two implementations of the same application. In a review of the post-goal questionnaire and the facilitator logs, it became apparent that a number of subjects felt that they failed to meet all of the requirements of the task. The two most frequently cited difficulties on both systems were the distance to the conference site and the budgetary requirements. Subjects were not allowed to launch applications, so subjects did not have access to a calculator or to a mapping application like Map-quest®.
To appear in Proceedings of the 33rd Annual IEEE International Computer Software and Applications Conference (COMPSAC 2009), July 2009. One interesting note about the facilitator logs and post-task questionnaires was that they did not always agree. Some subjects would inform the facilitator about any difficulties they were having but would not record them on the questionnaire. Subjects were not aware that the facilitators were required to record any interaction with a subject. The converse was also true. Without the ability to compare records, it would have been difficult to establish a pattern to the challenges faced by the subjects. From the average length of each task shown in Figure 3, it is apparent that it took subjects longer to accomplish the same task with System A than it did with System B, indicating that System B is more efficient or productive than System A. The first question that comes to mind was how two applications with almost identical interfaces could have such differences in the average task duration. On investigation, it was discovered that System A’s web pages were designed with frames; and in the frame on the far right, they used animated images for advertising. Although the advertising may bring additional revenue, it does make the system more difficult to use and resulted in not only a looser fit to the learning curve, but also System A, based on the data shown in Figure 3, is less efficient.
Figure 3. Average Task Length Another observation from the facilitator’s logs was that the response time of System A was erratic. According to the logs, some responses were immediate and others long enough to cause the subject to question if the system was running. From these results, it is not possible to determine which problem is the major contributor to the problem. Ideally, the development team would address both problems and then re-test. One of the more exciting parts of the experiment was when the trends for both systems were such tight fits to an exponential decay curve as predicted in the
mathematical model of the learning curve [13]. With both systems having a coefficient of determination (R2) above .7, it is possible to say that the test demonstrates how the subjects learned to use the software during the experiment. An R2 of 0.8792 indicates an almost ideal fit to the learning curve model. It is possible to say that based on the data in Figure 3, System B is both more efficient and is easier to learn than System A. It was expected that subjects would master the software in about four (4) or five (5) tasks. From the data shown in Figure 3, it was clear that the subjects did not begin to master the system until about task seven (7) or eight (8).
4. Designing a Usability Test There are a number of widely accepted references for designing a usability test [5, 11, 14, 16]. These references provide guidelines on every aspect of usability testing from the laboratory design to how to report results. These references, however, do not robustly address how to focus the test on specific parts of the system, how to create a goal or task, and how many goals or tasks to evaluate a specific part of the system. Like any other type of test, the process for a usability test consists of preparation, execution, and analysis phases. One of the first steps in constructing a usability test is to establish the usability requirements for the software under evaluation. At a minimum, clients should provide a profile for each user of the application and requirements for the In Use Quality characteristics and learnability [2]. These user profiles should include the same characteristics that are used to hire a person to fill that position and would include education, skills with a rating of expertise, etc. It is possible to provide user profiles at a system level, but the effectiveness, productivity/efficiency and satisfaction may vary by task. Describing the systems functionality using Unified Modeling Language (UML) use cases provides a focus for both specifying requirements and evaluating the software [15]. It is only logical to assume that different tasks will take more or less effort than other tasks; therefore, each use case should have its own set of requirements. After establishing requirements for each use case, the next step is to design a set of goals or tasks to evaluate a specific use case. A popular method for constructing a usability test is to “discover” some real world situations and use them as the basis for designing the goals [5, 11, 14, 16]. There are two problems with the random collection of tasks approach:
To appear in Proceedings of the 33rd Annual IEEE International Computer Software and Applications Conference (COMPSAC 2009), July 2009. 1.
It does not permit the subject to “learn” how to use the system before making a measurement of usability. 2. It does not provide a focus for the software engineer to diagnose the problems. A better approach is to use a set of test cases or tasks using a scenario test design technique [7]. Although many say that this is just a common sense approach, it is not widely recommended or discussed by the authorities of usability testing [5, 11, 14]. To illustrate the difference between the random selections of real life situations, consider the use case described in Figure 4 [15]. A random selection would probably focus on the “place orders” use case. This is a good choice because it is very highly used, but the “establish credit” use is critical to the health of the company. If the “establish credit” interface does not meet the usability requirements of the organization, it may result in customers receiving the wrong credit rating. Account Receivables place orders Extends
Order Clerk Extends
Post Cash
establish credit
Posting Clerk
Supervisor
Figure 4. Use Case Diagram Good testing practice requires test designers to have one or more tests evaluating each of the elements. 100% coverage is the only level of acceptable coverage. To provide a thorough evaluation of an application requires conducting a usability test for each use case described in the application, and using use cases as the focus for test design provides a basis for measuring the adequacy of the test. Selecting tasks at random will not guarantee 100% coverage of the use cases in an application. Many human beings learn by repeating a task or action a number of times. However, if tasks are the same, subjects memorize the solution and do not learn how to solve that class of problems. To address this issue, the developer wants to create a series of tasks that are different but based on the same scenario. Developing these goals consists of a few steps: 1. 2.
Select a use case for evaluation. Convert the input for the use case into a
narrative. Identify important events, conditions, or constraints and add their description to the narrative. 4. Test the scenario on all the systems that are under evaluation. 5. Replace the specifics of the scenario with blanks or with an option list creating a template. Figure 2 provides an example of a goal template. 6. For each desired goal, convert the template into a goal by filling in the blanks with valid data and selecting a single occurrence from each option list. 7. Test all of the goals on all of the systems under evaluation. Another question not well covered in the literature is the number of tasks verses the number of subjects. For this type of usability test, the literature suggests a number of subjects from six (6) to twenty (20). With this approach, it appears that more tasks with fewer subjects produce good results. Each usability test requires designing two forms: qualification and task completion. Questions on the qualification form should insure that a prospective subject matches the profile specified in the requirements. A task completion form provides the subject an opportunity to record how they feel about their work on the task. It should have some questions to establish the subject’s well-being. If the subject is tired or fatigued, it may be necessary to terminate the session. Address this contingency in the test protocol. Most authorities suggest expensive and elaborate facilities to conduct the tests [5, 14]. According to this research, the only thing that is necessary for a test facility is a minimal number of distractions. A small office or conference room is adequate. A cubical is too noisy. Facilitators should have a watch or stopwatch to record the time it takes to complete a task, or this should be integrated into the test harness. The largest external expense to implement the tools and techniques discussed in this paper is the cost of acquiring subjects. Compensation for subjects in a university setting has a number of none monetary alternatives. Unfortunately, in an industrial setting, pizza is not a popular form of compensation, even though it is sometimes used to compensate developers for overtime. However, temporary agencies can probably supply an adequate number of subjects conforming to the user profile. A small pool of about six (6) subjects permits using this approach as part of the construction phase, after the developers have completed their normal testing or as part of an iterative development process. 3.
To appear in Proceedings of the 33rd Annual IEEE International Computer Software and Applications Conference (COMPSAC 2009), July 2009. When using this technique as part of the construction phase with scenarios without any unusual conditions, the test provides the designer with feedback about the quality of the use case earlier in the development process. Conducting a complete usability test is better when the software is at its most stable.
7. References [1]
[2]
5. Future Research A large amount of data was gathered from logging actual activity and eye tracking data, and the researchers are still working with the data to develop a metric to establish productivity in terms of learnability and operability. A physiologist has been added to the research team to determine how much effort a subject expends when moving a mouse, pressing a key or transferring from mouse to keyboard. Another experiment in progress is an investigation into the positioning of instructions and location of push buttons. In this experiment, subjects enter data or push buttons based on instructions that are located at various distances. From this experiment, it may be possible to establish estimates for eye effort based on the distance between interface elements.
[3] [4] [5] [6] [7] [8]
6. Conclusions [9]
Using the use case based test case design approach presented in this paper, it is possible to reduce the cost of conducting a usability test by eliminating the need for outside consultants and expensive laboratory facilities. Outside consultants add considerable insight to many usability issues but also add a considerable cost. With this technique, the largest external cost is compensation for six (6) subjects. Results of the research also show that measuring effectiveness, productivity and satisfaction of an application are insufficient to permit developers to diagnose and prioritize correcting any issues found in the test. Fixing all of the issues found in the validation phase is not always a viable option because this approach frequently introduces more defects into the application than they repair. Another advantage of this technique is that it delivers a measure of learnability in addition to productivity at no additional cost. Frequently learnability is the one usability quality that end users can provide a quantitative requirement. Learnability affects how long it takes the end user to train existing personnel on the new system. In addition, learning time indicates how much training is necessary for new staff.
[10] [11] [12] [13] [14]
[15] [16]
[17]
"ISO 9241-11 Ergonomic requirements for office work with visual display terminals (VDTs) - Part 11: Guidance on usability," International Organization for Standardization, Geneve Switzerland1998. "ISO/IEC 9126-1:2001 Software EngineeringProduct Quality-Part 1: Quality Model," International Standards Organization, Geneva Switzerland2001. Caulton, D. A., "Relaxing the homogeneity assumption in usability testing," Behavior & Information Technology, vol. 20, p. 7, 2001. Chartette, R. N., "Why Software Fails," in Spectrum: IEEE, 2005. Dumas, J. S. and Redish, J. C., A Practical Guide to Usability Testing. Portland, OR, USA: Intellect Books, 1999. Hax, A. C. and Majluf, N. S., "Competitive cost dynamics: the experience curve," Interfaces, vol. 12, pp. 50-61, October 1982 1982. Kaner, C., "An Introduction to Scenario Testing," http://www.testingeducation.org/a/scenario2.pdf, date retrived: December, 2008. Komogortsev, O., Mueller, C., Tamir, D., and L., F., "An Effort Based Model of Software Usability," in 2009 International Conference on Software Engineering Theory and Practice (SETP-09) Orlando, FL, 2009. Leveson, N. and Turner, C. S., "An Investigation of the Therac-25 Accident," IEEE Computer, vol. 26 no. 7, 1993. Myers, G., The Art of Software Testing. New York, NY: John Wiley & Sons, 1979. Nielsen, J., Usability Engineering. San Francisco, CA, USA: Academic Press, 1993. Nielsen, J., "Logging Actual Use," http://www.usabilityhome.com/FramedLi.htm?Loggi ng.htm, date retrived: December, 2008. Ritter, F. E. and Schooler, L. J., "The Learing Curve," in Internaiton Encyclopedia of Social & Behavioral Sciences: Elsevier Science Ltd., 2001. Rubin, J. and Chisnell, D., Handbook of Usability Testing: How to Plan , Design, and Conduct Effective Tests. Indianapolis, IN, USA: Wiley Publishing, Inc., 2008. Rumbaugh, J., Jacobson, I., and Booch, G., The Unified Modeling Language Reference Manual. Reading, MA: Addison Wesley Longman, Inc., 1999. Tullis, T. and Albert, B., Measuring The User Experience: collecting, analyzing, and presenting usability metrics. Burlington, MA: Morgan Kaufmann, 2008. Vukelja, L., Müller, L., and Opwis, K., "Are Engineers Condemned to Design? A Survey on Software Engineering and UI Design in Switzerland," in NTERACT 2007 Rio de Janeiro, Brazil: Springer 2007.