5th Annual IEEE Conference on Automation Science and Engineering Bangalore, India, August 22-25, 2009
An Efficient Algorithm for RFID Reader Positioning for Coverage of Irregularly-Shaped Areas Nandakumar Mysore, Prakash Nenavat Rasmi S. Unnithan, Ravi Mulukutla and Shrisha Rao
Abstract— Radio frequency identification (RFID) is a proven automation technology finding application in various commercial sectors. These applications involve locating all tagged items automatically using available RFID readers. RFID readers are of two types, fixed and mobile. The number of readers required to cover an area depends on factors such as the properties of the reader, tag and the shape of the area to be covered. This paper presents an algorithm to find the minimum number of fixed RFID readers required for complete coverage of an area of irregular shape. This approach, which applies the Graham’s scan algorithm of computational geometry, can be used for buildings, warehouses, etc., of any shape. The algorithm determines the required number of readers by considering the interrogation range of the reader. A methodology of forming the convex hull/polygon covering the irregular area, and subsequently placing the readers at specified locations within the polygon based on the properties of the reader is discussed here. A sample tiling of an irregularly shaped floor space is shown as an example, and applications of the tiling algorithm are indicated by giving verbal sketches of automation systems for a food court, a parking lot, and an airport baggage tracking system that can make use of it.
I. INTRODUCTION A key challenge in Radio Frequency Identification is to provide complete coverage using minimum number of readers. Existing theoretical studies attempt to find the number and position of fixed or mobile readers required to cover a defined area [1], [2]. This paper presents an algorithm to get optimal coverage in an irregular shaped area, determining the location of the readers. RFID technology is a rapidly developing means to track physical objects in real-time. As RFID technology requires no line of sight, multiple items (tags) can be read at the same time. Different types of RFID readers and tags (to store information) are available now. However, due to a few tracking issues, end-users are finding it hard to track objects with pin-point accuracy [3]. Some of the hindrances are limitations in read range, tag orientation, interference (like water, metal), etc. [4]. A major problem in using RFID occurs when objects change positions, as in case of transportation through vehicles, objects on a conveyer belt, etc. In such scenarios, Nandakumar Mysore, Prakash and Ravi Mulukutla are with
Nenavat, Rasmi S. Unnithan Unisys Global Services India
[email protected] Shrisha Rao is with IIIT-Bangalore, India
[email protected]
978-1-4244-4579-0/09/$25.00 ©2009 IEEE
RFID readers are not able to track the objects with accuracy. Irregular structure of an area also adds to signal coverage and object scanning problems. Hence multiple readers or readers with multiple antennae, or mobile readers are used to overcome this situation. Covering an area of irregular shape adds more challenge in positioning the readers to get maximum coverage. This paper proposes a mathematical approach for placing readers in an irregular area to obtain maximum coverage. We achieve this by using a method of enclosing the area with a convex hull and then dividing the convex hull area into squares of sides representing the interrogation range. Computing a convex hull is an interesting problem in computational geometry. Different algorithms like Graham’s scan, divide and conquer, Jarvis march, gift wrapping, etc.., are already available for forming the convex hull of a given set of points. “Graham’s paper on the algorithm to find the convex hull of points in two dimensions is perhaps the first paper published in the field of computational geometry” [5](p. 72). Graham’s algorithm is efficient in computing two dimension hull in O(n log n) time. The algorithm works much faster O(n) if the points are given in the angularly sorted order where n > 2 is the number of points. Our proposed approach uses Graham’s algorithm for computing the convex hull since the boundary points of the area (in two dimensions) can be easily sorted and given as the input. Dividing the convex hull/polygon area with squares (tiling) is attained by intersecting the polygon with lines parallel to the X-axis and finally completing the coverage with squares. A direct approach of checking whether any of the polygon edges intersect with the line can be used to find the intersection points of a line and the polygon. Divideand-conquer algorithms are also available for completing the same. In this paper we present an approach to find the number of readers required to cover an irregular shaped area and the paper is organized as follows. Section II of the paper reviews the research conducted in the area of RFID coverage. Section III explains the scheme proposed by us, discussing the different algorithms. The paper continues with illustrations of a few applications in Section IV, and Section V concludes. II. R ELATED W ORK A critical factor in the adoption of RFID technology is the level of read-accuracy that is achieved. Wang, et al.
233
use Friis’ equation to explicitly consider orientations and polarizations while addressing the problem of determining the best locations for a set of reader antennas at a scanning portal [1]. Their objective is to maximize the size of the powering region in order to maximize read-accuracy. Providing complete coverage using mobile readers is considered by Anusha and Iyer [2]. Anusha and Iyer also explain that using fixed readers to guarantee complete coverage of all tags in a given area at all times increases the deployment cost. Reza and Geok [6] discuss a system based on a geometric gridcovering algorithm. Their sensing system can use passive or active RFID standard for positioning or tracking objects inside buildings. Huang and Chang [7] propose a solution for RFID reader deployment considering an ellipse/ellipsoid-like shape representing the signal range of an RFID antenna. Greene [8] proposes a model based on Friis’ Equation. Greene and Mickle [9] discuss a method for determining a power scaling factor for an RFID tag system. However, their work is valid only for the case of a single reader with a single antenna and extending this work to the situation involving multiple reader antennas is a complicated task. Wang, et al. [1] provide an insight for accomplishing this task and help in determining the number and the locations of multiple reader antennas in order to maximize the overall powering region. Agarwal et al. [10] present Monte Carlo algorithms that compute a stabbing set of size h = O(h∗ log m), with high probability, where h∗ is the size of the optimal stabbing set of O, where O = O1 , O2 , . . . , Om be a set of m convex polygons. O(log n) is achieved by using simple standard greedy algorithm to compute a hitting set [10]. Bronnimann et al. describe three planar convex hull algorithms [11]. The first algorithm uses Graham’s scan in combination with an in-place sorting algorithm, and runs in O(n log n) time. The second algorithm runs in O(n log h) time, is in-place and is based on an algorithm of Chan et al. The third algorithm is based on an algorithm of Chan [12], runs in O(n log h) time and is in-place. Gries and Stojmenovic [13] provide details on the construction of a convex hull. Graham’s algorithm examines the points in counterclockwise order and deletes those that are reflex upon termination, only nonreflex points remain in the convex hull. Determining when the counterclockwise examination of points can stop seems to be the major difficulty, because deleting a reflex point can change its neighbors from nonreflex to reflex. So Gries and Stojmenovic developed an algorithm that operates on a high level structure called ring, instead of the traditional circular doubly-linked list. An [14] describes in his work a modification of Graham’s algorithm for determining the convex hull of a finite planar set. The advantage of examining a restricted area of points is studied here.
The algorithms for our approach and for other methods used in the approach are discussed in detail.
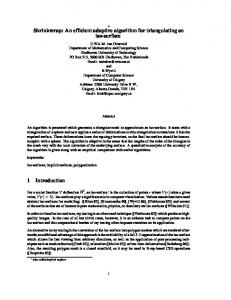
A. Illustration of the Covering Approach Consider the problem of covering an irregular area V = v0 , v1 , v2 . . . vm , using readers of interrogation range s. The first step is to form the convex hull or polygon enclosing v0 , v1 , v2 . . . vm . Graham’s method can be used to complete this step. P = P0 , P1 , P2 , P3 . . . Pn is the computed convex polygon covering the area (Figure 1).
Fig. 1.
(a) Area to be covered
(b) Compute Convex Hull
(c) Intersect with lines
(d) Complete tiling with squares
Covering Approach- Illustration
The next step is to tile the polygon with squares of sides representing the interrogation range of the reader. To achieve this, the polygon is intersected with line segments parallel to the X-axis at regular intervals equal to the interrogation range of the reader, starting with a line containing the farthest point from X-axis. The points where the lines intersect the polygon are then determined. Each intersected section formed by these lines and the polygon is completed as a rectangle and the rectangle is divided into squares of side s. Each square except the squares at the polygon boundary requires two readers of 90 degree angular coverage to cover the area. The readers can be placed at top left and bottom right corners. The squares at the polygon boundary may require 1 or 2 readers based on the area of polygon that is inscribed within the squares.
B. Algorithm
III. C OVERING S CHEME The proposed procedure for finding the number of readers required to cover an irregular shaped area is discussed here.
The pseudocode for the approach is given below (Algorithm 1).
234
TABLE I F UNCTIONS AND N OTATIONS USED IN P SEUDOCODE Notation V = Vk , where k = 0, 1, 2, . . . , m − 1 P = Pk , where k = 0, 1, 2, . . . , n − 1 s m[] xmax , xmin ymax , ymin M inimumx (P ), M aximumx (P ) M inimumy (P ), M aximumy (P ) Inbetween(Pi , m[i], m[j]) t[] N squares nReaders
Algorithm 2: UpdateNsquares - Algorithm to update the number of squares Input : P = P0 , P1 , . . . , Pn , t[], m[], i begin /* Add Intersection points to array */ for j ← 1 to t[].length do A[j + +] ← t[j + +] end /* Add polygon vertices b/n the lines to array */ for k ← 1 to n do if Inbetween(Pk , m[i], m[i − 1]) then A[j + +] ← Pk end end M in ← M inimumX (A) M ax ← M aximumX (A) N squares ← N squares + (M ax − M in)/s end
Description Boundary points of the area to be covered Vertices of the polygon Interrogation Range Array of lines parallel to xaxis Maximum/minimum x ordinate values in P Maximum/minimum y ordinate values in P Functions to calculate xmax , xmin in P Functions to calculate ymax , ymin in P Function to check whether Pi lies in between m[i] and m[j] array used to store points Number of squares Number of Readers
Algorithm 1: To find the number of readers necessary Input : V = v0 , v1 , v2 , v3 . . . vm (Boundary points of the area) and s( interrogation range) Output: nReaders (Number of readers required to cover the area) 1 begin 2 N squares ← 0 /* Number of squares */ 3 P ← ConvexHull(V ) /* P0 , . . . , Pn -ConvexHull Points */ 4 xmin ← M inimumX (P ) xmax ← M aximumX (P ) 5 ymin ← M inimumY (P ) ymax ← M aximumY (P ) 6 d ← ymax 7 i←0 8 repeat 9 Let m[i] be the line passing through (xmin , d), (xmax , d) 10 t[] ← Intersection(P, m[i]) 11 if i 6= 0 then 12 UpdateNsquares(P,t[]); 13 end 14 d ← d − s; 15 i←i+1 16 t[0] ← t[2] 17 t[1] ← t[3] 18 until d < ymin 19 if d 6= ymin − s then 20 UpdateFinalNsquares(P,t[]); 21 end 22 nReaders ← 2 × N squares 23 end
Algorithm 3: UpdateFinalNsquares - Algorithm to finally update the number of squares Input: P = P0 , P1 , . . . , Pn , d, i 1 begin /* Add Intersection points to array */ 2 for j ← 1 to t[].length do 3 A[j + +] ← t[j + +] 4 end /* Add polygon vertices below last line */ 5 for i ← 1 to n do 6 if Pi .y < d + s then 7 A[j + +] ← Pi 8 end 9 end 10 M in ← M inimumX (A) 11 M ax ← M aximumX (A) 12 N squares ← N squares + (M ax − M in)/s 13 end
1) Description of the Pseudocode: The convex hull enclosing the given boundary points of the area is computed
first (line 3, Algorithm 1). P = P0 , P1 , . . . , Pn represents the polygon. Values of maximum and minimum x and y ordinates among the hull point ordinates are stored in xmax , xmin , ymax and ymin . In the next step the polygon is intersected with an array of lines ( m[]) parallel to x-axis at an interval equal to the interrogation range(s). m[0] is drawn at a distance equal to ymax from the X-axis (line 9). Intersection points of the line m[0] and polygon are found. When more than one line is drawn, the intersected area between two consecutive lines is completed as a rectangle of height s. To do this the intersection points of the two lines with the polygon and the polygon vertices lying in between the lines are added to an array (A[])(Algorithm 2).
235
The maximum and minimum x-ordinate values among these points are calculated and the difference between these xordinates is divided by ’s’ to get the number of squares required to tile that rectangle. The same step is repeated for every pair of consecutive lines and the total number of squares is calculated. Finally it is checked whether the last parallel line is falling above the lowest vertex of the polygon (line 19, Algorithm 1). If so, the area below that line is completed as a rectangle of height s, by considering the intersection points of last line with the polygon and the polygon vertices falling below the last line. The rectangle is then divided into squares and the total number of squares is updated. Since each square requires two readers to cover the area, twice the value of N squares is reported as the number of readers required (nReaders). 2) Convex Hull—Graham Scan Algorithm: Graham’s method for forming the convex hull is illustrated below based on the algorithm given in the textbook of O’Rourke [5], which is a slightly updated version of the original algorithm. Algorithm 4: Graham Scan input : V = v0 , v1 , v2 , v3 . . . , vm (Boundary points of the area in angularly sorted order) output: P = P0 , P1 . . . , Pn (Array of points in the convex hull) 1 2
3 4 5 6 7
8 9 10 11 12 13 14 15 16 17
begin v0 ← rightmost lowest point Let S be the stack Push(v0 , S) Push(v1 , S) I ← 2; repeat if vi is to the left of the line formed by topmost two points in the stack then Push(vi , S) i ← i + 1; else Pop(S) end until i > n for j ← 1 to S[].length do P [j + +] ← S[j + +] end end
The lowest point towards the right corner is taken as the starting point. Let it be v0 . All other points are sorted angularly with respect to v0 . The hull is formed incrementally around the set of sorted points, selecting points if it is towards the left of the recently added convex edge, and reconsidering the scenario otherwise. Edge v0 v1 is added to the convex hull initially. Since v2 is making a left turn, it will be added and v3 is also added since it conforms to the rule. Further, v4 cannot be added since it makes a right turn at v3 . So v3 is removed from the convex hull point set. The next step is to move back to v2 and check
Fig. 2.
Illustration of Graham Scan Algorithm
whether v4 makes a left turn at v2 . Since it makes a left turn, v4 will be added and the algorithm further considers v5 and continues. The convex hull will be completed once we reach the starting point v0 traversing the entire set of points in the same way. 3) Finding the intersection points of a line segment and polygon: The problem of finding the intersection points of a geometric object with a line is often termed as the stabbing problem [5]. This can be achieved by searching whether any of the polygon edges intersects with the line. The intersection points can be found by solving the equations of the line and the polygon edge simultaneously. Alternatively the algorithm for finding extreme points in a polygon can be used to “stab” a polygon as explained by O’ Rourke [5]. This algorithm works by finding the extreme points of a polygon in the orthogonal directions to the line and checking whether the line intersects the polygon by observing the location of the extreme points. If they are on the same side of the line, it can be stated that the line is not intersecting the polygon. Otherwise, the points divide the polygon into two chains and the intersection points can be found by conducting a binary search on both chains.
Fig. 3.
Finding the intersection points
In Figure 3, p5 and p3 represent the extreme points and since they are not to the same side of line l, it can be stated that the line intersects the polygon. Points p5 and p3 divides the polygon into two chains p5 x1 p4 p3 and p5 p1 x2 p2 p3 . Binary search can be conducted on both chains to find the intersection points x1 and x2 . 4) Tiling the polygon with squares and Positioning the readers: After computing the convex polygon, we tile the polygon with squares of sides representing the interrogation
236
range of the reader. This is accomplished by drawing lines over the polygon parallel to the X-axis at regular intervals equal to the range of the reader, and then dividing the polygon area between each consecutive pair of lines into squares. Intersection points of a line and polygon can be found using any of the algorithms mentioned in the previous section. Each pair of consecutive lines is completed as a rectangle by considering the extreme points in the Xdirection, among the intersection points of two consecutive line segments with the polygon, and the polygon vertices in between the line segments. Vertical lines are drawn at these extreme points to complete the rectangle which can be further divided into squares of side s. Each square is divided into two right angled triangles by placing a reader on the right angled vertex of each triangle.
area within the hall needs to be covered using RFID readers of interrogation range s = 4m. The convex hull of the shaded area is computed and the result is the polygon V = v0 , v1 , v2 . . . v5 (vertices are (0,0), (14,3), (16,9), (13,20), (6,24) and (0,24)). The convex hull/polygon is intersected with parallel lines and the intersected area is divided into squares( of side 4) as explained earlier. Running the program to partition the polygon identifies the number of readers as 48. It is observed that providing a single reader is enough to cover certain rectangles towards the boundary of the polygonal area. So the total number of readers can be adjusted by considering the rectangles at the boundary region of the polygon.
IV. A PPLICATIONS The proposed scheme can be useful in finding the number of readers required for covering a building with an irregularly-shaped floor area, or for covering a specified area within a hall. For example, let us consider situations like providing RFID coverage for a defined region inside a shopping mall or a warehouse. In such cases, our scheme can be used to get an estimate on the number of readers required to cover that region and do the planning properly, well before starting the construction. This would avoid the need for conducting surveys to find the positioning of readers after completing the construction.
(a) Area to be covered — B
A. Sample Tilings
(b) Complete tiling with squares Fig. 5.
Covering Approach B
Figure 5 (Covering Approach B) represents another case where V = v0 , v1 , v2 , v3 is the area to covered. As shown in Figure 5, completing our approach on this area (vertices are v3 (0, 3.8), v0 (1.0, 0.2), v1 (5.0, 0.0), v2 (5.0, 3.3) assuming v3 lies on y-axis) identifies the number of readers (of interrogation range 1m) as 40. Again, the total number of readers can be adjusted by considering the rectangles at the boundary region of the polygon. Understanding the placement of readers is a crucial part of RFID system design. Through the use of the visualization tools in modern simulation software, it is possible for a system integrator to determine the most effective locations for the readers.
(a) Shaded area to be covered — A
(b) Complete tiling with squares Fig. 4.
B. A Food Court
Covering Approach A
An example is discussed here for an area given in Figure 4. Consider a hall of dimensions 20m × 24m. The shaded
A food court is a plaza that contains several counters or stalls of multiple food vendors and provides a common area for self-serve (or even a` la carte) dining. People can choose
237
different cuisines of their choice in one place. Such a food court is often seen to be beset with the problem that as the demand and usage increases (such as during peak hours), it becomes very difficult to ensure efficient functioning. Providing RFID coverage in the manner we indicate here would help food courts provide fast and efficient service to its customers. 1) A Model Application: Here is a sample application using our approach. Some important features of this example are: •
•
•
•
•
Cashless transactions: Customers need not pay for the food each time they visit the food court, as they have an auto debit option. Payment details are programmed while issuing access card to the customers during their first visit to the food cout. Customers need to carry the same card during subsequent visits. Personalizable choices of menu: A customer need not stand in long queues at different stalls to place the order and pay. At the entrance the customer can select food items from the menus of different food stalls, place the order and wait inside the food court. Tracking for food services: As the entire area is covered using RFID readers, information regarding customer’s position within the food court also can be monitored in the application at all times. Vendors can use this information to serve their customers. Tracking of availability of vacant seats (both number and locations): The application can be extended to collect the data regarding the usage of different areas within the food court and suggest details of vacant seats or less occupied spots to the customers when they place the order using systems located at the entrance. Improved service efficiency: The management can improve on the customer service. As a complete ordering of the different customer requests is maintained automatically and the payments also taken care of automatically, management can save on the time to be spent for these steps, and avoid any confusion regarding the food orders, payments, etc. This would lead to a more efficient functioning of the system.
2) The Structure of the System: Reader-enabled systems placed at the entrance fetch the customer information and provide the opportunity to place the order. A customer can proceed to the food court and wait. The concerned vendor receives the order and the order is delivered in a specific time limit. Different components required to implement this scenario are discussed below. •
•
RFID Reader Layout: RFID readers are used to provide coverage for the entire food court area at all times. This ensures continuous detection of all tags within the food court. Unique access card containing RFID tag: Each customer is provided a unique access card when he/she visits the food court for the first time. Customer details including the payment options are programmed while issuing the cards. Customer need only carry the same card during
subsequent visits. Display Systems: Reader-enabled systems displaying different choices of food menu are kept at the entrance of the food court. On entering the food cour,t the customer can approach any of these systems. The reader fetches and displays the customer information from the access card. The customer can browse through the menu and select the type of cuisine and place the order. The customer can choose between “Take away” or “To be served” in the food court. The concerned vendor receives the order and the customer information as needed. • Application: A software application is used to automate the entire process here. This should fetch the details of the customer when they are within the food court area, propagate the food requests made by the customers to different food vendors, keep track of the customers at all times and indicate to vendors where orders should be delivered, take care of payments, and propagate information to the display boards. Figure 6 corresponds to the floor plan of the dining area at IIIT-Bangalore (though certain details are made up to illustrate our case). •
Fig. 6.
Layout - Food Court
The area shown in Figure 6 can be divided into three sections A1, A2, and A3. Food stalls are located at A1. Customers entering food court should place the order using the systems located at the entrance and move towards A2 or A3. As per the study of the considered food court area we need 94 readers of 3m range. This food court area has been divided into three sections (as it contains concave angles which may lead to a convex hull of more area) and the algorithm is applied. Areas A1, A2 and A3 require 44, 8 and 42 readers respectively. C. A Parking Lot Enabling a parking lot with an RFID system can improve its functionality to a great extent. Providing RFID coverage for the entire parking area along with the usage of unique
238
parking stickers (enclosing RFID tags) to identify the vehicles can be used for this purpose. Tags enclosed within the stickers contain the information regarding the vehicle (e.g., vehicle number, name of the owner, etc.). Readers placed at the entry or exit points are used to collect the details of the vehicles entering or leaving the parking lot. The system maintains complete information regarding the count and details of the vehicles parked inside at all times. Readers covering the parking area are used to keep track of the parking spaces so that the information regarding vacant/occupied spaces, as well as the details of the vehicle parked in each space can be monitored at all times. Such a parking lot application can be used in large common parking lots/garages, parking lots of hospitals, airports, shopping malls, etc., to provide a completely automated, fast, efficient and secure service. Important features of such a system are: • Access control: A unique parking sticker containing the ID tag is used to identify each vehicle and the sticker is attached to the vehicle. Vehicle details are entered into the system at the time of issuing the card. Readers at entry points can be used to identify and allow only the vehicles with valid tag numbers to enter the parking lot and this supports an efficient hands-free access control for the parking lot. • Parking and locating the vehicle: Readers covering the parking area are used to monitor the entire area at all times. A visitor can park the vehicle at any of the vacant spaces. Display boards are used at various locations to provide information regarding the availability of vacant spaces. On return to collect the vehicle the visitor can just give any of the vehicle details to get a receipt showing the parking charge to be paid (based on the usage) and the exact location where he/she has parked the vehicle. The system can also track illegal parking (e.g., in handicapped parking spots) and enable appropriate responses. • Security: RFID readers at the entry/ exit points monitor and store the tag details of the vehicles entering and leaving the parking lot. This will allow only tagged vehicles to enter the parking lot as well as help in maintaining complete parking lot usage information for each vehicle. D. Baggage Tracking Another area that can utilize RFID technology is the tracking of baggage in airports and elsewhere. RFID tags are attached to the baggage at the point of entry to the airport. The tags are used to uniquely identify each piece of baggage. The entire baggage handling area is covered with RFID readers, and information is retrieved from or updated to the tags using these reader systems located at different locations. The baggage-processing system is more streamlined and instead of airport workers having to manually hand-scan each item before it is directed to an airplane for loading, the bags now simply pass interrogators installed at various points
along the airport’s many long conveyor belts that transport items from check-in to each plane. Such an application has the following aspects: • Automated tracking of baggage: The baggage is tagged and traced within the airport. Tags contain different pieces of information like the details of the owners, details of the flight, etc. These details are verified at important locations using RFID reader systems. Manual scanning of the baggage is eliminated in these places, since the RFID system does the work automatically. • Security: The automated baggage tracking facility can be used to prevent the loss or misplacing of baggage. As each tag contains the flight details of the owner, the system restricts baggage from entering wrong flights. Readers are installed at each entry lane into the lot. When an authorized baggage approaches a gate, an interrogator reads an RFID tag embedded in a sticker attached to the baggage. The reader transmits the tag ID to a program that compares it with a list of IDs for tags issued to owners. If it finds a match, the program sends a command to the security gate controller to raise the bar blocking the entrance. The baggage is tracked throughout till it is loaded onto the plane. As a practical example, the Hong Kong International Airport (HKIA), which serves approximately 48 million passengers per year on flights to 150 locations, is now using RFID baggage tags [15] for many bags that leave the airport every day. HKIA has upgraded its former bar-codebased system with radio frequency identification, though their system does not seem to implement all the functionality we suggest above. V. C ONCLUSIONS RFID is a fast automation technology, requiring no line of sight to function. This technology can deliver benefits in many areas, including tracking work in progress to speeding up throughput in warehouses. The efficiency of an RFID system depends upon properly positioning the required number of readers considering properties of the tags, the readers, and the area to be covered. This study discusses a scheme for finding the number of readers required to cover an irregularly-shaped area. We focus on forming the convex hull of the defined area and then further dividing the convex hull into equal areas of interrogation range. This approach can be used to find the number of readers required for buildings of any shape. We have considered readers of 90 degree angular coverage in our study. Our objective is to present a tool to provide an idea about finding the number of readers required to cover an irregularly-shaped area within a building or outdoors. Our work would bring savings of a significant percentage of the time, effort and money to be spent for doing the same in a usual way of conducting RFID covering studies in a trial and error manner. Further studies are recommended in developing a general tool displaying the positioning of readers for different types
239
of readers, i.e., different with respect to the interrogation range. Studies can also be conducted in deciding an optimal division of the total area into regions of interrogation range. R EFERENCES [1] L. Wang, B. A. Norman, and J. Rajgopal, “Placement of multiple readers RFID reader antennas to maximize portal read accuracy.” International Journal of Radio Frequency Identification Technology and Applications (IJRFITA), vol. 1, pp. 260–277, 2007. [2] S. Anusha and S. Iyer, “RFIDcover - a coverage planning tool for RFID networks with mobile readers,” in EUC Workshops, 2005, pp. 1047–1057. [3] J. Rothfeder, what’s wrong with RFID?, http://www.cioinsight.com, 2004. [4] K. N. M. Ramakrishnan, “Performance benchmarks for passive UHF RFID tags,” Master’s thesis, Univ. of Kansas, Lawrence, 2005. [5] J. O. Rourke, Computational Geometry. Cambridge University Press, 1998. [6] A. W. Reza and T. K. Geok, “Investigation of indoor location sensing via RFID reader network utilizing grid covering algorithm,” Wireless Personal Communications, vol. 49, pp. 67–80, 2008. [7] H.-P. Huang and Y.-T. Chang, “Robust design for RFID system testing and applications,” IEEE International Conference on Robotics and Automation, 2007. [8] E. Greene., “Area of operation for a radio-frequency identification (RFID) tag in the far-field.” Master’s thesis, Univ. of Pittsburgh, Pittsburgh, 2006. [9] E. Greene and M. Mickle, “Determining the three-dimensional read accuracy of an RFID tag using a power scaling factor.” 2006, working Paper, Dept. of Electrical and Computer Engineering, Univ. of Pittsburgh. [10] P. K. Agarwal, D. Z. Chen, S. K. Ganjugunte, E. Misiolek, M. Sharir, and K. Tang, “Stabbing convex polygons with a segment or a polygon.” in ESA, ser. Lecture Notes in Computer Science, D. Halperin and K. Mehlhorn, Eds., vol. 5193. Springer, 2008, pp. 52–63. [Online]. Available: http://dblp.unitrier.de/db/conf/esa/esa2008.html#AgarwalCGMST08 [11] H. Br¨onnimann, J. Iacono, J. Katajainen, P. Morin, J. Morrison, and G. T. Toussaint, “In-place planar convex hull algorithms,” in Proc. of the 5th Latin American Symposium on Theoretical Informatics (LATIN’02), Cancun, Mexico, 2002, pp. 494–507. [12] T. M. Chan, “Optimal output-sensitive convex hull algorithms in two and three dimensions,” Discrete & Computational Geometry, vol. 16, pp. 361–368, 1996. [13] D. Gries, “A note on Graham‘s convex hull algorithm,” Inf. Process. Lett., vol. 25, no. 5, pp. 323–328, 1987. [14] P. T. An, “A modification of Graham’s algorithm for determining the convex hull of a finite planar set,” Annales Mathematicae et Informaticae, vol. 34, p. 38, 2007. [15] “HKIA Boosts Baggage Handling Efficiency with RFID Technology,” Jan. 2008, press Release. [Online]. Available: http://www.hongkongairport.com/eng/media/pressreleases/pr 914.html
240