To appear in Knowledge and Information Systems (pre-publication version)
StatApriori: an efficient algorithm for searching statistically significant association rules Wilhelmiina H¨am¨al¨ainen Department of Computer Science, University of Helsinki, Finland
Abstract. Searching statistically significant association rules is an important but neglected problem. Traditional association rules do not capture the idea of statistical dependence and the resulting rules can be spurious, while the most significant rules may be missing. This leads to erroneous models and predictions which often become expensive. The problem is computationally very difficult, because the significance is not a monotonic property. However, in this paper we prove several other properties, which can be used for pruning the search space. The properties are implemented in the StatApriori algorithm, which searches statistically significant, non-redundant association rules. Empirical experiments have shown that StatApriori is very efficient, but in the same time it finds good quality rules. Keywords: Association rule; Statistical significance; Dependence; StatApriori; Search algorithm;
1. Introduction Traditional association rules (Agrawal, Imielinski and Swami, 1993) are rules of form “if event X = x occurs, then also event A = a is likely to occur”. The commonness of the rule is measured by frequency P (X = x, A = a) and the strength of the rule by confidence P (A = a|X = x). Usually it is required that both frequency and confidence should exceed some user-defined thresholds. The actual interestingness of the rule is usually decided afterwards, by some interestingness measure. Often the associations are interpreted as correlations or dependencies between Received Jan 16, 2009 Revised Apr 21, 2009 Accepted May 09, 2009
2
W. H¨ am¨ al¨ ainen
certain attribute value combinations. However, traditional association rules do not necessarily capture statistical dependencies, but they can associate absolutely independent events while ignoring strong dependencies. As a solution, it is often suggested (following the axioms by Piatetsky-Shapiro (1991)) to measure the lift (interest) instead of the confidence (e.g. (Tan, Kumar and Srivastava, 2004)). This produces also statistically more sound results, but still it is possible to find spurious rules while missing statistically significant rules. In the worst case, all discovered rules can be spurious (Webb, 2006; Webb, 2007). In practice, this means that the future data does not exhibit the discovered dependencies and the conclusions based on them are erroneous. The results can be expensive or even fatal, as the following example demonstrates. Example 1. A biological database contains observation reports from different kinds of biotopes, like grove, marsh, waterside, coniferous forest, etc. For association analysis, each report is represented as a binary vector, listing the observed species, along with biotope characteristics. Local forestry societies as well as individual land owners can use the data when they decide e.g. fellings or protected sites. The forestry society FallAll is going to drain swamps for new forests. Before any decisions are made, they search associations from the 1000 observations on marsh sides. They use minimum frequency 0.05 and minimum confidence 0.80. One discovered rule is leather leaf → cloudberry with frequency 0.06 and confidence 0.80. Since cloudberries are commercially important product, the forestry society decides to protect a marsh growing leather leaves, when other swamps are drained. The decision is excellent for the leather leaf, but all cloudberries in the area disappear. The reason is that cloudberries require a wet swamp, while leather leaves can grow in both moist and wet sides. The only protected swamp in the area was too dry for cloudberries. This catastrophe was due to a spurious rule leather leaf → cloudberry. The rule has p-value 0.13 which means that there is 13% probability that the observed association is just due to chance. In the same time, the forest society misses an important rule, namely wet swamp,leather leaf → cloudberry. This rule was not found, because it had too low frequency, 0.04. However, it is a strong rule with confidence 1.0. The p-value is 0.011 which indicates that the rule is quite reliable. Roughly speaking, it means that there is only 1.1% probability that the rule is spurious. The problems of association rules and especially the frequency-confidenceframework are well-known (Webb, 2006; Webb, 2007; Berzal, Blanco, S´anchez and Miranda, 2001; Morishita and Sese, 2000), but still there have been only few attempts to solve the problem. Quite likely, the reason is purely practical: the problem has been considered computationally intractable. Statistical significance is not a monotonic property and therefore it cannot be used for pruning the search space in the same manner as the frequency. However, when we search directly statistically significant rules (instead of sets), we can utilize other properties for efficient pruning. More efficiency is achieved by searching only non-redundant rules. Such rules are at least as good as the pruned rules, but simpler, and no information is lost. In practice, the simpler rules avoid overfitting and hold better in the future data. In this paper, we introduce a set of properties which can be used for searching non-redundant, statistically most significant association rules. The properties are implemented in the StatApriori algorithm. Some of the pruning principles as
StatApriori: an efficient algorithm for searching statistically significant association rules
3
Table 1. Basic notations. Notation
Meaning
A, B, C,. . . a, b, c, . . . ∈ {0, 1} R = {A1 , . . . , Ak } |R| = k Dom(R) = {0, 1}k X, Y, Z ⊆ R Dom(X) = {0, 1}l (X = x) = {(A1 = a1 ), . . . , (Al = al )} t = {A1 = t(A1 ), . . . , Ak = t(Ak )} r = {t1 , . . . , tn | ti ∈ Dom(R)} |r| = n σX=x (r) = {t ∈ r | t[X] = x} m(X = x) = |σX=x (r)|
binary attributes attribute values set of all attributes number of attributes attribute space attribute sets domain of X, |X| = l event, |X| = l
m(X=x)
P (X = x) = n P (X=x,A=a) γ(X = x, A = a) = P (X=x)P (A=a) i(f r, γ) I(X = x → A = a) = i(P (X = x, A = a), γ(X = x, A = a)) upperbound(f ) bestrule(X) = arg maxA∈X {I(X \ A → A)} P S(X) minattr(X) = arg min{P (Ai )|Ai ∈ X}
row (tuple, transaction) relation (data set) size of relation r set of rows where X = x absolute frequency, number of rows where X=x relative frequency of X = x lift of rule X = x → A = a measure function on frequency f r and lift γ value of the measure function for a rule an upperbound for function f the best rule which can be constructed from X property “potentially significant”; whether significant rules can be derived from X or its supersets “minimum attribute” of X; one with the lowest frequency
well as the first version of StatApriori algorithm were introduced in the ICDM conference version of this paper (H¨am¨al¨ainen and Nyk¨anen, 2008). StatApriori does not need any minimum frequency thresholds even with large data sets, which guarantees that we can find all globally optimal, non-redundant rules with the selected significance measure. The measure function can be freely selected, as long as it is a monotonically increasing or decreasing function of frequency and lift. Due to efficient pruning and redundancy reduction, StatApriori can tackle problems which are impossible to compute with the classical Apriori. The rest of the paper is organized as follows: the basic definitions are introduced in Section 2; assessing the statistical significance of association rules is discussed in Section 3; important pruning properties and theoretical principles are defined in Section 4; the StatApriori algorithm is described in Section 5; experiments are reported in Section 6; related research is discussed in Section 7; and the final conclusions are drawn in Section 8.
2. Basic definitions In the following we give basic definitions of the association rule, statistical dependence, statistical significance, and redundancy. The notations are introduced in Table 1.
4
W. H¨ am¨ al¨ ainen
2.1. Association rules Traditionally, association rules are defined in the frequency-confidence framework: Definition 1 (Association rule). Let R be a set of binary attributes and r a relation according to R. Let X ( R, A ∈ R \ X, x ∈ Dom(X), and a ∈ Dom(A). The confidence of rule (X = x) → (A = a) is cf (X = x → A = a) =
P (X = x, A = a) = P (A = a|X = x) P (X = x)
and the frequency (support) of the rule is f r(X = x → A = a) = P (X = x, A = a). Given user-defined thresholds mincf , minf r ∈ [0, 1], rule (X = x) → (A = a) is an association rule in r, if (i) cf (X = x → A = a) ≥ mincf , and (ii) f r(X = x → A = a) ≥ minf r . The first condition requires that an association rule should be strong enough and the second condition requires that it should be common enough. In this paper, we call rules association rules, even if no thresholds minf r and mincf are specified. Usually, it is assumed that the rule contains only positive attribute values (Ai = 1). Now, the rule can be expressed simply by listing the attributes, e.g. A1 , A3 , A5 → A2 . Another common restriction is to assume that the consequent contains just one attribute. Often the rules with a set of attributes in the consequence can be derived afterwards. Derivation rules are simple, when the confidence is 1, but the exact calculi for different measure functions should be researched.
2.2. Statistical dependence Statistical dependence is usually defined through statistical independence (e.g. (Silverstein, Brin and Motwani, 1998; Meo, 2000)): Definition 2 (Independence and dependence). Let X ( R and A ∈ R \ X be sets of binary attributes. Events X = x and A = a, x ∈ Dom(X), a ∈ Dom(A), are mutually independent, if P (X = x, A = a) = P (X = x)P (A = a). If the events are not independent, they are dependent. The strength of the statistical dependence between (X = x) and (A = a) can be measured by lift or interest: γ(X = x, A = a) =
P (A = a|X = x P (X = x, A = a) = . P (X = x)P (A = a) P (A = a)
In the following, we will concentrate on the dependencies between events containing only positive attributes. The lift of rule X → A is denoted simply γ(X, A).
StatApriori: an efficient algorithm for searching statistically significant association rules
5
Lift γ(X, A) > 1 indicates positive dependency, lift γ(X, A) < 1 negative dependency, and γ(X, A) = 1 independence. We note that the above equation is not defined, when P (A) = 0. In this case, we define γ(X, A) = 1, because now P (XA) = 0 = P (X)P (A), as required for independence.
2.3. Redundancy A common goal in association rule discovery is to find minimal (or most general) interesting rules, and prune out redundant rules (Bastide, Pasquier, Taouil, Stumme and Lakhal, 2000). The reasons are twofold: First, the number of discovered rules is typically too large (even hundreds of thousands of rules) for any human interpreter. According to the Occam’s Razor principle, it is only sensible to prune out complex rules X → A, if their generalizations Z → A, Z ( X are at least equally interesting. The user just has to define the interestingness measure carefully, according to the modelling purposes. Second, pruning redundant rules can save the search time enormously, if it is done on-line. This is not possible with many interestingness functions, and usually the pruning is done afterwards. In our case, the interestingness measure is the statistical significance, but in general, redundancy and minimality can be defined with respect to any other measure function. Definition 3 (Redundant rules). Given an increasing interestingness measure I, rule X → A is redundant, if there exists rule X 0 → A0 such that X 0 ∪ {A0 } ( X ∪ {A} and I(X 0 → A0 ) ≥ I(X → A). If the rule is not redundant, then it is called non-redundant. I.e. a rule is non-redundant, if all its generalizations (”parent rules”) are less significant. It is still possible that some or all of its specializations (”children rules”) are better. In the latter case, the rule is unlikely interesting itself. Non-redundant rules can be further classified as minimal or non-minimal: Definition 4 (Minimal rules). Non-redundant rule X 0 → A0 is minimal, if for all rules X → A, such that X 0 ∪ {A0 } ( X ∪ {A}, I(X → A) ≤ I(X 0 → A0 ). I.e. a minimal rule is more significant than any of its parent or children rules. In the algorithmic level this means that we stop the search without checking any children rules, if we have just ensured that the rule is minimal. We note that in the previous research word ”redundancy” has been used in two different senses. A rule can be redundant, if it contains redundant attributes (e.g. (Aggarwal and Yu, 1998)) or – in the context of frequent sets and rules – if its frequency can be derived from other frequent sets (e.g. (Liu, Li and Wong, 2008)).
3. Statistical significance Next we consider the problem of assessing the statistical significance of an association rule. We discuss the main approaches and their problems and derive statistical measure functions for association rules.
6
W. H¨ am¨ al¨ ainen
3.1. Main approaches The main idea of statistical significance is to estimate the probability that the observed discovery has occurred by chance. If the probability is very low, we can assume that the discovery is genuine. Otherwise, it is considered spurious and discarded. The probability can be estimated either analytically or empirically. The analytical approach is used in the traditional significance testing, while randomization tests estimate the probability empirically. Traditional significance testing can be further divided into two main classes: a frequentist and Bayesian approach. The frequentist approach is the most commonly used and best studied (see e.g. (Freedman, Pisani and Purves, 2007, Ch. 26) or (Lindgren, 1993, Ch. 10.1)). The main idea is to estimate the probability of an observed or a rarer phenomenon under some null hypothesis. When the objective is to test the significance of the dependency between events X and A, the null hypothesis H0 is the independence assumption: P (X, A) = P (X)P (A). The task is to calculate the probability p = P (M ≥ m(X, A) | H0 ) that XA occurs at least m(X, A) times in the data set, if they were actually independent. In the hypothesis testing, the p-value is compared to some pre-defined threshold α. If p ≤ α, the null hypothesis is rejected and the discovery is called significant at level α. Parameter α defines the probability of committing type I error, i.e. accepting a spurious rule. Another parameter, β, is used to define the probability of committing type II error, i.e. rejecting a true rule as non-significant. The problem is how to decide suitable thresholds, and often only the p-values are reported. Deciding threshold α is even harder in the data mining where numerous patterns are tested. For example, if we use threshold α = 0.05, then there is a 5% chance that a spurious rule passes the significance test. If we test 10 000 rules, it is likely that we will find 500 spurious rules. This so called multiple testing problem is inherent in the knowledge discovery, where we often perform an exhaustive search over all possible patterns. As a solution, the more patterns we test, the stricter bounds for the significance we should use. The most famous correction method is Bonferroni adjustment (Shaffer, 1995), where the desired significance level p is divided by the number of tests m. In the association rule discovery, we can give an upper bound for the number of rules to be tested (Webb, 2007). An alternative is to control the expected number of errors among selected rules (Benjamini and Hochberg, 1995). In this paper, we do not try to solve this problem, but instead we will use the p values and corresponding measures only for ranking. The idea of Bayesian significance testing is quite similar to the frequentist approach, but now we assign some prior probabilities P (H0 ) and P (H1 ) to null hypothesis H0 and research hypothesis H1 . The conditional probabilities P (M ≥ m(X, A) | H0 ) and P (M ≥ m(X, A) | H1 ) are estimated from the data, and the posterior probabilities of hypotheses (P (H0 | M ≥ m(X, A)) and P (H1 | M ≥ m(X, A))) are calculated by the Bayes rule. The results are asymptotically similar (under some assumptions even identical) to the traditional hypothesis testing, although the Bayesian testing is sensitive to the selected prior probabilities (Agresti and Min, 2005). Gionis et al. (2007) have described how to use randomization tests to assess the significance of data mining results, like frequent sets. The main idea is to generate random data sets which have the same row and column marginals as the original data. The empirical p-value is defined as a proportion of random sets
StatApriori: an efficient algorithm for searching statistically significant association rules
7
where the observed or more extreme phenomenon occurs. The only requirement is that it is meaningful to maintain the row and column sums. For example, in the market basket data the items are similar and their values can be swapped, but it is not sensible to swap values of different attributes like age, occupation, IQ, and gender.
3.2. Estimating p The significance of the observed frequency m(X, A) can be estimated exactly by the binomial distribution. Each row in relation r, |r| = n, corresponds to an independent Bernoulli trial, whose outcome is either 1 (XA occurs) or 0 (XA does not occur). All rows are mutually independent. Assuming the independence of attributes X and A, combination XA occurs on a row with probability P (X)P (A). Now the number of rows containing XA is a binomial random variable M with parameters P (X)P (A) and n. The mean of 2 M is µM = nP (X)P (A) and its variance is σM = nP (X)P (A)(1 − P (X)P (A)). Probability P (M ≥ m(X, A)) gives the significance p: n X
p=
³n´
i=m(X,A)
i
(P (X)P (A))i (1 − P (X)P (A))n−i .
(1)
In this approach we make no assumptions on P (A) and P (X). An alternative is to assume that actual P (X) and P (A) are the same as observed and estimate the p-value in set σX (r), where X is true. In this set, A occurs on each row with probability P (A) and the probability of observing A at least m(XA) times from m(X) (under independence) is m(X)
p2 =
X
i=m(X,A)
µ
m(X) i
¶ P (A)i (1 − P (A))m(X)−i .
(2)
The problem of this measure is that the rules in the same data set cannot be compared. Each rule is tested in a different part of the data, where the antecedent X holds. According to our experiments, the results are also poorer than with Equation 1. The binomial probability is quite difficult to calculate, but for our purposes it is enough to have an upper bound for the p-value. This guarantees that no rules with a low p-value are lost when the search space is pruned. Additional pruning and ranking can be done afterwards, when the actual binomial probabilities are calculated. The simplest upper bound is based on the (binomial) z-score: m(X, A) − µM m(X, A) − nP (X)P (A) =p σM nP (X)P (A)(1 − P (X)P (A)) √ n(γ(X, A) − 1) =p . γ(X, A) − P (X, A)
z(X, A) =
The z-score measures how many standard deviations (σM ) the observed frequency m(X, A) deviates from the expected value µM = nP (X)P (A). The
8
W. H¨ am¨ al¨ ainen
corresponding probability can be easily approximated, because z follows the standard normal distribution, when n is sufficiently large and P (X)P (A) (or 1 − P (X)P (A)) is neither close to 0 nor to 1. As a rule of thumb, the approximation can be used, when nP (X)P (A) ≥ 5 (e.g. (Lindgren, 1993, 147)). According to Carriere (2001), the approximation works well even for nP (X)P (A) ≥ 2, if continuity correction (subtracting 0.5 from m(X, A)) is used. When P (X)P (A) is low, the binomial distribution is positively skewed. This means that the z-score overestimates the significance. Therefore, we will not use normal approximation to estimate the p-values, but the z-score is used only as a measure (ranking function). We note that the z-score is not crucial to our method, but several other measure functions can be used, as well. The requirement is that the measure I is a monotonically increasing or decreasing function of m(X, A) and γ(X, A). For example, when the expected value P (X)P (A) is very low, we can derive a tight upperbound for p from the Chernoff bound (Hoeffding, 1963): eδµM . (1 + δ)(1+δ)µM By inserting δ = γ − 1, where γ = γ(X, A), and using γµ = m(X, A), we achieve P (M > µM (1 + δ))
m(X, A))
1, 2. X → A is non-redundant, and 3. I(X → A) ≥ minI . We note that the user has to select only one parameter, minI . Alternatively, we could define an optimization problem, where the N best rules (with highest I-values) are searched. However, the tasks are not mutually exclusive. Even if
StatApriori: an efficient algorithm for searching statistically significant association rules
9
threshold minI is used, the user can ask to output only N best rules. On the other hand, a loose threshold (e.g. maxp = 0.05 or minZ = 2.0) can be used in the optimization problem to prune out rules which cannot be significant. Let us now assume that we have a measure function i(f r, γ) such that for any rule X → A, I(X → A) = i(P (XA), γ(X, A)). In addition, let i be either monotonically increasing or decreasing with both frequency f r and lift γ. The search problem can be divided into two subproblems: 1. Search all non-redundant rules X → A for which I(X → A) ≥ minI using i. 2. Calculate the exact p-values and output rules with sufficiently low p. The postprocessing step is trivial and we will concentrate on only the search step. For simplicity, we assume that i is monotonically increasing; a monotonically decreasing measure function is handled similarly.
4.2. Monotonic and anti-monotonic properties The key idea of the classical Apriori algorithm (Agrawal and Srikant, 1994; Mannila, Toivonen and Verkamo, 1994) is the anti-monotonicity of frequency. For attribute sets, the monotonicity and anti-monotonicity are defined as follows: Definition 6 (Monotonic and anti-monotonic properties). Property π : P(R) → {0, 1} is monotonic, if (π(Y ) = 1) ⇒ (π(X) = 1) for all X ⊇ Y , and anti-monotonic, if (π(X) = 1) ⇒ (π(Y ) = 1) for all Y ⊆ X. When π is anti-monotonic (π(Y ) = 0) ⇒ (π(X) = 0) for all X ⊇ Y .
The general Apriori algorithm. Input: set of attributes R, data set r, anti-monotonic property π Output: {X ⊆ P(R)|π(X) = 1} Method: // Initialization S1 = {Ai ∈ R|π(Ai ) = 1} l=1 while (Sl 6= ∅) // Step 1: Candidate generation Generate Cl+1 from Sl // Step 2: Pruning Sl+1 = {c ∈ Cl+1 |π(c) = 1} l =l+1 return ∪l Sl Alg. 4.1
When the measure function defines an anti-monotonic property, the interesting sets or rules can be searched with the general Apriori algorithm (Figure 4.1). The problem is that the measure functions for the statistical significance do not define any anti-monotonic property. However, it turns out that the upperbound for the measure function I defines an anti-monotonic property for most set-inclusion relations.
10
W. H¨ am¨ al¨ ainen
4.3. Property P S Let us define the property P S, “potentially significant”. Potential significance of set X is a necessary condition for constructing any significant rule X \ B → B. Definition 7. Let measure function I be as before, minI a user-defined threshold, and upperbound(f ) an upperbound for function f . Let bestrule(X) = arg maxB∈X {I(X \ B → B)} be the best rule which can be constructed from attributes X. Property P S : P(R) → {0, 1} is defined as P S(X) = 1, iff upperbound(I(bestrule(X))) ≥ minI . Now it is enough to define the conditions under which P S behaves antimonotonically. The following theorem is the core of the whole search algorithm: Theorem 1. Let us denote the least frequent attribute in set Z by minattr(Z) = arg min{P (Ai ) | Ai ∈ Z}. Let P S, X, and Y be as before. If (P S(X) = 1), then (P S(Y ) = 1) for all Y ⊆ X such that minattr(X) = minattr(Y ). 1 Proof. First observe that for all B ∈ X we have γ(X \ B, B)) ≤ P (B) ≤ 1 1 and upperbound(I(X \ B → B)) = i(P (X), ). P (minattr(X)) P (minattr(X)) 1 By them we have upperbound(I(bestrule(X))) = i(P (X), P (minattr(X)) ) ≤ 1 i(P (Y ), P (minattr(Y )) ) = upperbound(I(bestrule(Y ))) for all Y ⊆ X such that minattr(X) = minattr(Y ). We have minI ≤ upperbound(I(bestrule(X))) by the definition of P S(X) = 1. Hence also minI ≤ upperbound(I(bestrule(Y ))), as required for the definition of P S(Y ) = 1.
Corollary 1. If P S(Y ) = 0, then P S(X) = 0 for all X ⊇ Y such that minattr(X) = minattr(Y ). We have shown that property P S defines an anti-monotonic property among sets having the same minimum attribute. Let us now consider the exceptional case, when the anti-monotonicity does not hold. Let us call X an l-set, if |X| = l. Let the (l − 1)-subsets, Yi ( X, |Yi | = l − 1, be called X’s parent sets. Now X has l parent sets, from which only one has a different minimum attribute. The exceptional parent set is Yl = X \ {minattr(X)}. If P (minattr(Yl )) > P (minattr(X)), Yl has a lower upperbound for γ than Y1 , . . . , Yl−1 and X have. Therefore, it is possible that Yl is non-P S, even if X is P S.
4.4. Search strategy The previous properties define a search strategy, where each set X is classified as 1 potentially significant (P S(X) = 1). This means that Y ⊇ X can be significant. 1.1 significant (Signif icant(X) = 1) 1.1.2 redundant (Red(X) = 1). The rule is not output. Y ) X can still
StatApriori: an efficient algorithm for searching statistically significant association rules
11
be non-redundant and the search continues. 1.1.2 non-redundant (Red(X) = 0). The rule is output. Y ) X can still be more significant and the search continues. 1.1.2.1 minimal (M inimal(X) = 1). Now all Y ) X will be redundant and can be pruned. 1.1.2.2 non-minimal (M inimal(X) = 0). The search continues. 1.2 insignificant (Signif icant(X) = 0). The rule is not output. Y ) X can still be significant and the search continues. 2 not potentially significant (P S(X) = 0). 2.1 absolutely non-significant. This means that all Y ⊇ X are insignificant and X cannot occur even as a special parent of P S sets. All Y ⊇ X are pruned. 2.2 special parent. Now X is saved, until the next level is processed.
5. Algorithm Next, we will describe the StatApriori algorithm. We will first introduce the main idea and then go to details and give the complexity analysis.
5.1. The main idea The main idea of StatApriori algorithm is given in Algorithm 5.1. The algorithm proceeds in the same manner as the general Apriori (Figure 4.1) except it searches directly rules, not sets. It alternates between the candidate generation and pruning steps, as long as new non-redundant, potentially significant rules can be found. However, special techniques are needed, because property P S is not anti-monotonic in all respects. First, the attributes are arranged into an ascending order by their frequencies. Let the renamed attributes be {A1 , . . . , Ak }, where P (A1 ) ≤ . . . ≤ P (Ak ). The idea is that the candidates are generated in the canonical order. From l-set X = {A1 , . . . , Al }, we can generate (l + 1)-sets X ∪ {Aj }, where j > l. Now all 1 supersets of X have the same upper-bound for the lift, γ ≤ P (A . If X is non-P S, 1) then none of its descendants can be P S. Otherwise, we should check the other parent sets Z ⊂ X ∪ {Aj }, |Z| = l. If at most one of them, (X \ {A1 }) ∪ {Aj }, is non-P S, then X ∪ {Aj } is added to the candidate collection Cl+1 . After candidate generation, the exact frequencies are counted from the data. Candidates which are non-P S or can produce only redundant descendants, will be pruned, and others are added to collection Sl+1 . The minimality of P S rules is checked, because no new candidates are generated from minimal rules. The principles for redundancy and minimality checking are 1 1. If we have γ(bestrule(X)) = P (minattr(X)) , then the lift is already maximal possible, and none of X’s specializations can gain a better i-value. The rule is marked as minimal.
12
W. H¨ am¨ al¨ ainen
Alg. 5.1 The StatApriori algorithm, when the measure function i is monotonically
increasing (for a monotonically decreasing function maxI is used instead). Input: set of attributes R, data set r, threshold minI Output: {X → A | I(X → A) ≥ minI ∧ ¬Red(X → A)} Method: // Initialization order attributes such that P (A1 ) ≤ ... ≤ P (Ak ) S1 = {Ai ∈ R} l=1 while P S non-minimal l-sets left // Step 1: Candidate generation generate Cl+1 from Sl such that ∀X ∈ Cl+1 1) all X’s parent sets are non-minimal, and 2) first l parents are P S // Step 2: Pruning count frequencies P (X) Sl+1 = {c ∈ Cl+1 |P S(c) = 1} for ∀X ∈ Sl+1 check the best rule for redundancy and minimality l =l+1 output significant, non-redundant rules from ∪l Sl
2. If we have upperbound(I(bestrule(X ∪ {Aj }))) ≤ I(bestrule(Z)) for some attributes Z ( X ∪ {Aj }, then X ∪ {Aj } and all its specializations will be redundant with respect to Z. X ∪ {Aj } is removed.
5.2. Enumeration tree The secret of StatApriori is a special kind of enumeration tree, which enables an efficient implementation of pruning principles. A complete enumeration tree lists all sets in the powerset P(R). In practice, it can be implemented as a trie, where each root–node path corresponds to an item set. StatApriori uses an ordered enumeration tree, where the attributes are arranged into an ascending order by their frequencies. Figure 1 shows an example of a complete enumeration tree, when R = {A, B, C, D, E, F }, and P (F ) ≤ P (E) ≤ . . . ≤ P (A). In practice, we have to generate only those parts of the tree which can produce non-redundant significant rules. When no minimum frequency thresholds are used, the final tree contains the globally optimal non-redundant association rules on all root-leaf paths of a complete enumeration tree. If some minimum frequency is required, then we can no more guarantee that the discovered rules are globally optimal. Fortunately, StatApriori is so efficient that there is seldom need for any minimum frequency thresholds. The following example demonstrates how the enumeration tree is used. Example 2. Let us simulate the algorithm on the example data given in Table 2. The minimum threshold for the z-score is set to minz = 4.00. First, the frequencies of single attributes are counted: P (A) = 0.60, P (B) =
StatApriori: an efficient algorithm for searching statistically significant association rules
F E E
D
B
C
B
A
C
A
B
A
D
A
C
C B A
B
A
A
A
A
B
A
A
D
A
B
A
B
C
A
B
C
A
A
D
A
B
A
C B A
B
A
A
B
C
A
B
13
A
A
A
A
A
A
Fig. 1. A complete enumeration tree.
Table 2. Example data. m(ABCDEF ) = 1 m(ABCDE) = 9 m(BCDE) = 5 m(ABC) = 15 m(AC) = 15 m(A) = 20 m(BDE) = 5 m(B) = 20 m(F ) = 10 Σ = 100
0.55, P (C) = 0.45, P (D) = 0.20, P (E) = 0.20, P (F ) = 0.11. The attributes are inserted to the tree in the ascending order by their frequencies: F , E, D, C, B, A (E and D could be reversed as well). Figure 2 shows the situation when the second level is processed. All 2-sets in the F -branch have so low frequency that they cannot be P S even with the maximal possible lift γ = P (F )−1 = 9.1. In addition, they cannot occur as special parents for any other sets and they are removed. All 2-sets in branches E, D, and C are P S. The only significant rule, E → D, is also minimal, because it has maximal possible lift in that branch, γ = P (D)−1 = P (E)−1 = 5.00. The last 2-set BA in non-P S, because it cannot produce a significant rule even with its maximal possible lift γ = P (B)−1 = 1.8. However, it can be a special parent of another rule, and it is saved. Figure 3 shows the situation at the third level. Since ED was already minimal, it is not expanded. All generated 3-sets are P S, but only one rule, BA → C, is significant. This is also an example, where a special parent was needed. Since the rule is minimal, no 4-sets are generated and the search finishes.
14
W. H¨ am¨ al¨ ainen
F E
E D 1
C 1
D
A
B 1
1
C 15
20
20 A
B
15
20
10
60
55
45
C B A
10
20
A
B
C
20
11
1
D
B 30
A 40
A 25
minimal z=8.2
Fig. 2. Example when level 2 is processed.
F E
E D 1
C 1
B 1
A 1
D 20 min B 15
C
20 A
B
15
20
A
A 10
15 B
10
15
20
A
10
B 30
A 10
10
60
55
45
C B A
10
A
B
C
20
11
1
D
A 40
A 25
A 25
special parent
minimal z=4.4
Fig. 3. Example when level 3 is processed.
5.3. Handling special parents The previous example demonstrated that some non-P S l-sets are needed when l + 1-sets are checked. This situation occurs when bestrule(X) = Y → B, X = Y B, is P S, but Y is non-P S. In practice, there are two way to handle the situation: 1. Only P S sets are stored into the tree. A new (l + 1)-set is generated, if its l first parent sets are in the tree (i.e. P S). If the last parent was missing, it is added temporarily for rule checking and also its frequency is counted. 2. Non-P S sets are divided into two categories. If an l-set cannot be even a special parent, it is deleted, but otherwise it is stored into the tree. After the lth level has been processed, all useless non-P S sets are deleted. The current implementation uses the latter approach, which has proved to be more efficient. Potential special parents can be identified by two principles: Principle 1. Let Amin = minattr(R) be the minimum attribute in the whole data set. The maximal possible lift is P (Amin )−1 . If a non-P S set X is non-P S with this lift then it cannot be even a special parent. I.e. if i(P (X), P (Amin )−1 ) < minI ), then X can be deleted. Principle 2. Let Y be a non-P S l-set in branch Ai (i.e. mina(Y ) = Ai ). Y
StatApriori: an efficient algorithm for searching statistically significant association rules
A
15
B
A
B
B AB
Z
Z
Z \ Cl−1
Z \ C1 Z \ C2
...
sets ABZ \ Ci
level l
AZ
BZ
C1 level l + 1
ABZ
parents
Fig. 4. When BZ is non-P S, set ABZ cannot be P S, if any of ABZ \ {Ci } or AZ is non-P S.
cannot be a special parent for any (l+1)-set, unless some of the previous branches A1 , ..., Ai−1 contain at least l P S, non-minimal l-sets. The reason is that each (l + 1)-set has its first l parents in the same main branch and only the last parent set is in one of the succeeding branches. The second principle is so important that we give a detailed proof: Theorem 2. Let set ZB, where B = minattr(ZB), |Z| = l − 1, be non-P S. Then BZ cannot be a special parent of any set, if for all Ai , P (Ai ) ≤ P (B), the Ai number of P S (l − 1)-sets in branch Ai , Sl−1 = |{Ai Y | P S(Ai Y )}| < l. Proof. Let A = Ai , P (A) ≤ P (B). Let us first consider (l + 1)-sets, whose special parents BZ could be. In branch A, the only possible set is ABZ. Its A other l parents are ABZ \ {Ci }, i = 1, ..., l − 1, and AZ. If Sl−1 < l, then either some ABZ \ {Ci } or AZ must be non-P S, and ABZ cannot be P S based on Corollary 1. The idea is shown in Figure 4. Notice that the Figure represents only the nodes needed to decide if ABZ is P S. Therefore, all nodes on the left (ABZ’s left sisters, ABZ \ {D1 }’s left sisters, and A’s left sisters) are missing. Let us now consider (l + m + 1)-sets, whose special parent some BZ’s descendant could be. Since BZ was non-P S, all its descendants (sets BZQ, where minattr(BZQ) = B) are also non-P S. For any Q, |Q| = m ≥ 1, the only possible set in branch A having BZQ as its special parent is ABZQ. Its other l + m parents are ABZ \ {Ci }Q, i = 1, ..., l − 1, ABZQ \ {Di }, i = 1, ..., m, and AZQ. If any of sets ABZ \ {Ci } was non-P S, then also ABZ \ {Ci }Q is non-P S. On the other hand, if AZ was non-P S, then AZQ is non-P S. In either case ABZQ cannot be P S. The idea is shown in Figure 5. At each level, the first principle is used, until some branch contains too few P S, non-minimal sets and we can change to the second principle. In practice, the second principle is much more effective, since the first branches contain the least frequent minimum attributes and are the reason for over-optimistic upperbounds for the lift.
16
W. H¨ am¨ al¨ ainen
A
B
A
B
B AB
Z
Z
Z \ Cl−1
Z \ C1 Z \ C2
...
sets ABZ \ Ci
level l
AZ
BZ
C1 level l + 1
ABZ
Q Q \ D1 Q \ D2 level l + m
Q
Q
Q
Q \ Dm
...
sets ABZQ \ Di
... sets ABZ \ Ci Q
AZQ
BZQ
D1 ABZQ parents
Fig. 5. When BZ is non-P S, set ABZQ cannot be P S, if any of ABZ \{Ci } or AZ is non-P S.
5.4. Frequency counting Frequency counting is the main bottle-neck of association rule discovery algorithms. In the traditional Apriori (and also the first implementation of StatApriori), the set of all l-candidates are checked at once. It is very space consuming, when the number of candidates can easily be millions. When each candidate is checked immediately, useless ones can also be discarded immediately. In practice, the saving of space can be crucial for the execution without any minimum frequency thresholds. Another aspect is whether to use horizontal or vertical data layout. In the horizontal layout each row contains a list of attributes which occur on the row. In practice, this is usually implemented as n bitvectors of size k. In the vertical layout the roles of rows and attributes are reversed. Each attribute is associated with a list of rows, where the attribute is true. Now the data set can be implemented as k bitvectors of size n. In practice, the vertical layout is more efficient and it is used also in the current implementation of StatApriori. Let us now analyze the time requirement for frequency counting, when data is stored into bitvectors. Each bitvector is implemented by m c integers, where m is the length of the bit vector and constant c is the number of bits in the machine word (e.g. 32 or 64, depending on the architecture). Each integer can be checked fast by bitwise logical operations. In practice, we can consider the bitwise logical operations on integers as atomic operations which take constant time. When the horizontal layout is used, counting the frequency of each l-set requires in the worst case n · min{l, kc } time steps. If l < k/c, the attributes of an l-set can occur in at most l integers, and checking one row takes at most l steps. The checking is repeated on all n rows. In the vertical layout, the frequency of set X = A1 ...Al is the same as the
StatApriori: an efficient algorithm for searching statistically significant association rules
17
number of 1-bits in the bitwise and of vectors v(A1 ), ..., v(Al ). This observation was made already 1996 by Yen and Chen (1996), but in that time the memory sizes were so small that the technique could not be utilized for large data sets. Counting the frequency of one l-set takes nc (l + 1) time steps, which consist of nl n c bitwise and operations and counting the number of 1-bits in the result ( c steps) on each of l rows. When we compare the requirements we see that the vertical layout is in practice more efficient, even if the time complexities are the same: nc (l + 1) < n · min{ kc , l} for all l < k − 1.
5.5. Time complexity It is known that the problem of searching all frequent attribute sets is N P -hard, in the terms of the number of attributes, k (Jermaine, 2005). The worst case happens, when the most significant association rule involves all k attributes, and all 2k attribute sets are generated. The worst case complexity of the algorithm is O(max{k 2 , nk}2k ). Usually, when k < n, this reduces to O(n2 2k ). Theorem 3. The worst-case time complexity of StatApriori is O(max{k 2 , nk}2k ), where n is the number of rows and k is the number of attributes. Proof. The initialization (generation of 1-sets) takes n · k steps. Producing l-sets and their best rules takes l2 |Cl | + |Cl |n · l + 2|Sl |l time steps. The first term is the time complexity of the candidate generation. Each candidate has l parents and each parent can be found (using a trie) in l − 1 steps. The second term is the complexity of the frequency counting. For each of |Cl | candidates, we have to perform l bitwise and operations on bitvectors of length n and count the number of 1-bits in the results. For one candidate set the complexity is O(n · l) (see also subsection 5.4). The third term is the complexity of the rule selection phase: for each of |Sl | sets, all l parents are checked. Checking is done at most twice: once for calculating the maximal I-value (selecting the best rule) and second time for checking the redundancy. Each checking can be implemented in constant time, if the parent pointers are stored into a temporary structure in candidate generation phase. Since |Cl | ≥ |Sl |, the total complexity is k X l=2
max{l2 , nl}|Cl | ≤ max{k 2 , nl}
k µ ¶ X k l=2
l
= O(max{k 2 , nk}2k ).
In practice, we never have to scan the whole search space, because all ksets cannot express non-redundant significant positive dependencies. However, it is difficult to prove tighter upperbounds or estimate the maximal number of non-redundant significant rules.
18
W. H¨ am¨ al¨ ainen
Table 3. Description of data sets and test parameters (n is the size of the learning set) Data n Mushroom Chess T10I4D100K T40I10D100K Plants Accidents Pumsb Retail
5416 2130 66581 66581 15088 226788 32697 58774
k
StatApriori minZ zf r
Apriori minf r
120 75 1000 1000 70 470 8000 18000
40 18 150 70 70 260 170 150
0.22 0.75 0.001 0.013 0.12 0.45 0.80 0.70
0.0015 0.00058 0.000035 0.014 0.015 0.000016 0.00089 0.00011
6. Experiments The main goal of the experiments was to evaluate the speed–accuracy ratio of the StatApriori algorithm. Even a clever algorithm is worthless unless it can produce better results or perform faster than the existing methods. It was expected that StatApriori cannot compete in speed with the traditional methods, but instead it is likely to produce more accurate rules.
6.1. Test setting In the experiments, StatApriori was compared to the traditional Apriori, followed by postprocessing where non-redundant, optimal rules were selected. For the traditional Apriori, we used an efficient prefix-tree implementation by C. Borgelt (Borgelt and Kruse, 2002). The tested measures were χ2 , J-measure (Smyth and Goodman, 1992), z-score, and frequency. The z-score was included here, too, to test the effect of frequency-based pruning on results. In the StatApriori we used mainly the z-score, but the tails of the distribution (when nP (X)P (A) ≤ 1) were also checked using upper and lower bounds for the logarithm of binomial probability. The best rules were selected by an upperbound for log(p), because calculating exact p would have caused an underflow in most data sets. The data sets and test parameters are described in Table 3. All data sets except Plants are classical benchmark data sets from the FIMI repository (Frequent Itemset Mining Dataset Repository). Some of the data sets are originally from the Machine Learning repository (Asuncion and Newman, 2007), but in FIMI they have already been binarized and transformed into transactional form. Plants lists all plant species growing in the U.S.A. and Canada. Each row contains a species or genus and lists the states where it grows. The data has been extracted from the USDA plants database (The PLANTS Database, 2008). All data sets and the source code can be accessed on http: //www.cs.helsinki.fi/u/whamalai/datasets.html. Table 3 lists also the minimum z-scores used by StatApriori and the minimum frequency threshold used by traditional Apriori. In StatApriori we did not use any minimum frequency thresholds, except requirement m(X, A) ≥ 5 (implemented in the program), which is the minimum requirement for performing any statistical tests. In addition, we report value zf r, the minimum frequency threshold corresponding to the z-score. The same results could be achieved by the traditional Apriori, if zf r could be used.
StatApriori: an efficient algorithm for searching statistically significant association rules
19
The minimum frequency thresholds for traditional Apriori were set as low as possible. The large thresholds are partly due to heavy postprocessing phase. For feasibility, the thresholds were set to avoid over 500 000 rules. However, the dense data sets are difficult for Apriori even without this restriction. For example, Apriori cannot handle Chess with minf r < 0.50. Retail was so heavy that we had to restrict the length of the antecedent to 4 attributes. In StatApriori no restrictions were needed. All experiments were executed on Intel Core Duo processor T5500 1.66GHz with 1 GB RAM, 2MG cache, and Linux operating system.
6.2. Evaluation measures Since association rules can be used for both predictive and descriptive modelling, both aspects were assessed. When association rules are used for prediction, the natural measure is the average prediction error in the test set: err =
1 nT
X
P (¬A|X),
m(X)>0
where nT = |{X → A | m(X) > 0 in the test set}| is the number of rules which could be applied in the test set. Now it is important that the test sets are sufficiently large, because otherwise the mean error is based on just a few (most common) rules. Therefore, we saved 1/3 of each data set for testing, and used 2/3 for “learning” (searching the rules). Since variation among different divisions to test and learning sets can be relatively large, all experiments were repeated ten times on random divisions to learning and test sets. The most important factor for the prediction quality is high confidence. However, the estimate of the confidence in the learning set should be accurate, i.e. the confidence in the test set should be at least equally high. In addition, the lift should be γ > 1.0 to improve the accuracy compared to expectation err = P (¬A). Otherwise the rule is useless and in the worst case only decreases the accuracy (γ < 1.0). When association rules are used for descriptive purposes, the prediction accuracy is not so important, but instead we would like to find strong dependencies. This can be measured by the average lift avg(γ) =
1 X γ(X → A). nT m(X)
We note that γ(X → A) = 1, if X occurs in the test set but A does not. Once again the estimate of lift in the learning set should also hold in the test set. Therefore, we calculated the z-score for the difference of the lift distribution (characterized by the mean and variance) between the learning set and the test set: µ(γL ) − µ(γT ) , z(∆γ) = q 2 σ 2 (γT ) σ (γL ) + nL nT where γL is the lift variable in the learning set and γT in the test set, µ and σ 2 notate the mean and variance, nL is the number of rules considered in the
20
W. H¨ am¨ al¨ ainen
35 30
#rules
25 20 15 10 5 0 2
15 lift
28
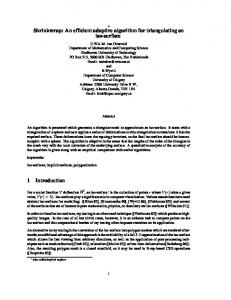
Fig. 6. The lift distribution among the 100 best rules by f r measure in a learning set of T40I10D100K.
35 30
#rules
25 20 15 10 5 0 2
15 lift
28
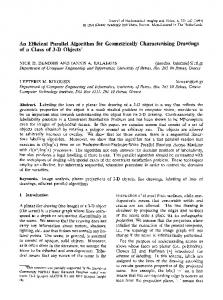
Fig. 7. The lift distribution among the 100 best rules by f r measure in a test set of T40I10D100K.
learning set, and nT is the number of rules, which could be applied in the test set. The closer the z-score is to zero, the more similar the distributions are. If the score is negative, then the correlations are stronger in the test set than in the learning set. For example, Figures 6 and 7 show the lift distribution in a learning and test set of data set T40I10D100K, when the rules were selected by frequency. Now z(∆γ) = −0.0, indicating no significant difference. The score is relatively conservative, and the difference should be quite large, before the score deviates from 0. As a final test, we calculated the proportions of useful and harmful rules. When the goal is to find positive dependencies, all rules expressing negative dependencies in the future data are considered harmful. On the other hand, all rules expressing positive dependencies in the future data are useful. Rules which express independence in the future data are quite harmless, but they do not offer any new information. Both useful and harmful rules were divided into two categories. Rule X → A was classified as slightly useful, if
StatApriori: an efficient algorithm for searching statistically significant association rules
21
p P (X)P (A) < P (XA) < P (X)P (A) + nP (X)P (A)(1 − P (A)P (X)) in the test data. I.e. the rule expresses positive dependency but the frequency deviates at most one standard deviation from the expectation. If the deviation was from expectation was more than one standard deviation, the rule was considered useful. Similarly, X → A was classified as slightly harmful, p if P (X)P (A) > P (XA) > P (X)P (A) − nP (X)P (A)(1 − P (A)P (X)) in the test data. Now the rule expresses negative dependency but the frequency deviates at most one standard deviation from the expectation. If the deviation was larger, the rule was considered harmful.
6.3. Results The results are given in Tables 4, 5, 6, 7, and 8. The average values among all data sets are given on the last row. Proportions of useful and harmful rules are shown in Figures 8 and 8. Let us first analyze the average prediction error, when the minimum confidence is mincf = 0.90. If look at only the average prediction error among all data sets, StatApriori looks to have performed slightly worse than other approaches. The average prediction error was 0.08, while the best measures with the traditional Apriori, J and f r produced average error 0.05. However, this is only part of the truth. Both J and especially f r favoured trivial rules with lift value near 1.0. Frequency measure produced lift γ ≤ 1.1 in five data sets from eight, and J measure in three data sets from eight. It means that equally good predictions could have been done without the rules. If StatApriori was run with larger minZ values, it also produces smaller prediction errors (in fact smaller than other approaches). However, the number of discovered rules was also smaller. Therefore, we used smaller minZ values to find at least 100 significant rules like with other measures. The most difficult data set for StatApriori was Chess, where we also had to use very low minZ to find enough rules. When we analyzed the data set we found that the most significant dependencies were in fact negative, and therefore not detected by StatApriori. On the other hand, the minimum frequency threshold used by traditional Apriori was very high (minf r = 0.75), meaning that both the consequent and antecedent are very common. Then it is only likely that they occur together, even if they were dependent. It is interesting that χ2 , J and z produced smaller prediction error, when the minimum confidence was mincf = 0.60 than with mincf = 0.90. The rules with mincf = 0.90 were also more complex (longer) and only about 80% of them could be applied to the test set. When we look at the average lift values among all data sets, the situation is quite different. Measures which produced smallest prediction errors, produced also smallest lift values. StatApriori discovered the strongest dependencies with both mincf = 0.6 and mincf = 0.9. This is not surprising since it was designed to search statistically significant positive dependencies. The second best method was χ2 with the traditional Apriori (also designed for detecting statistical dependencies), and the last was pure frequency measure. One reason for small lift values in the traditional Apriori is the need for
22
W. H¨ am¨ al¨ ainen
Table 4. Results of StatApriori when mincf = 0.60 and mincf = 0.90. (Average lift, rule accuracy, and the difference of lift.)
γ
0.60 err
z(∆)
γ
0.90 err
z(∆)
Mushroom Chess T10I4D100K T40I10D100K Plants Accidents Pumsb Retail
4.8 45.4 102.8 36.9 5.47 1506.5 61.3 133.0
0.03 0.33 0.11 0.06 0.15 0.23 0.10 0.02
-1.54 1.4 -0.16 -0.35 0.22 0.02 -0.16 -0.30
4.83 96.5 124.4 38.2 5.5 1839.0 90.1 133.0
0.03 0.15 0.07 0.05 0.15 0.10 0.03 0.02
-1.54 -0.81 -0.05 -0.35 0.15 0.57 -0.84 -0.30
avg
237.0
0.13
-0.11
291.4
0.08
-0.40
Table 5. Results of traditional Apriori with χ2 measure when mincf = 0.60 and mincf = 0.90. (Average lift, rule accuracy, and the difference of lift.)
γ
0.60 err
z(∆)
γ
0.90 err
z(∆)
Mushroom Chess T10I4D100K T40I10D100K Plants Accidents Pumsb Retail
2.8 1.0 754.8 48.8 5.2 1.1 1.1 1.1
0.15 0.09 0.09 0.06 0.21 0.22 0.06 0.07
-2.75 0.16 -1.67 -11.81 -0.13 0.03 -0.53 0.10
2.9 53.4 81.6 47.9 5.3 1.1 1.1 1.1
0.05 0.12 0.11 0.03 0.08 0.04 0.06 0.06
-1.75 -1.31 -0.16 -4.76 0.07 -0.02 -0.52 0.09
avg
102.0
0.12
-2.08
86.2
0.07
-1.22
Table 6. Results of traditional Apriori with J measure when mincf = 0.60 and mincf = 0.90. (Average lift, rule accuracy, and the difference of lift.)
γ
0.60 err
z(∆)
γ
0.90 err
z(∆)
Mushroom Chess T10I4D100K T40I10D100K Plants Accidents Pumsb Retail
2.7 1.0 81.6 30.0 4.3 1.2 1.1 1.1
0.02 0.03 0.11 0.04 0.07 0.13 0.03 0.02
-0.74 0.01 -0.16 0.27 0.00 0.01 -0.19 -0.10
2.8 1.0 79.4 30.0 4.4 1.1 1.1 1.2
0.03 0.03 0.20 0.04 0.05 0.03 0.03 0.01
-1.06 -0.00 -1.51 0.36 0.06 -0.02 -0.22 -0.15
avg
15.4
0.06
-0.11
15.1
0.05
-0.32
StatApriori: an efficient algorithm for searching statistically significant association rules
23
Table 7. Results of traditional Apriori with z measure when mincf = 0.60 and mincf = 0.90. (Average lift, rule accuracy, and the difference of lift.)
γ
0.60 err
z(∆)
γ
0.90 err
z(∆)
Mushroom Chess T10I4D100K T40I10D100K Plants Accidents Pumsb Retail
2.8 1.0 455.5 48.7 5.3 1.1 1.1 1.1
0.07 0.08 0.05 0.04 0.14 0.20 0.05 0.06
-2.55 0.37 0.81 15.81 0.11 -0.01 -0.55 0.20
2.9 1.0 364.3 47.7 5.2 1.1 1.1
0.04 0.06 0.22 0.03 0.07 0.04 0.05 0.06
-1.63 0.41 -2.44 -4.81 0.27 -0.01 -0.75 0.14
avg
64.6
0.09
1.77
53.0
0.07
-1.10
Table 8. Results of traditional Apriori with f r measure when mincf = 0.60 and mincf = 0.90. (Average lift, rule accuracy, and the difference of lift.)
γ
0.60 err
z(∆)
γ
0.90 err
z(∆)
Mushroom Chess T10I4D100K T40I10D100K Plants Accidents Pumsb Retail
1.1 1.0 37.4 10.1 4.0 1.0 1.0 1.0
0.09 0.03 0.14 0.07 0.06 0.11 0.02 0.02
0.02 0.16 -0.62 -0.05 -0.10 0.00 0.00 0.00
1.1 1.0 37.4 10.1 4.0 1.0 1.0 1.0
0.03 0.03 0.14 0.07 0.06 0.02 0.02 0.02
0.07 0.16 -0.62 -0.05 -0.10 0.00 0.00 0.00
avg
6.7
0.12
0.02
7.1
0.05
-0.07
large minimum frequency thresholds. For any rule the upperbound of the lift is 1 γ ≤ min . fr When we look at z(∆(γ))-values, we see that StatApriori produced the most stable results, in the sense that the lift distributions were nearly identical in the learning and test sets. J-measure and frequency produced also quite stable results, but in the case of frequency, it only means that rules were spurious (or trivial) both in the learning and the test set. Proportions of useful and harmful rules give a good summary of the quality of rules. Since the requirement for useful rules was relatively loose, most measures performed well. The only exception was pure frequency, which does not measure statistical dependence at all. However, in sparse data sets (typical market basket data) the most frequent rules often happen to express statistical dependencies, too. Set Chess was the most problematic for traditional Apriori with all measures. The likely reason is that Chess contains relatively many negative dependencies. We note that the redundancy reduction did already improve the results and without it the ratio of useful and harmful rules was even worse. The average execution times of StatApriori are listed in Table 9. In most cases
24
W. H¨ am¨ al¨ ainen Proportions of useful and harmful rules when cf=0.6 Slightly useful rules Useful rules Slightly harmful rules Harmful rules
150
100
50
0
Stat χ2 J z fr
Stat χ2 J z fr
Stat χ2 J z fr
Stat χ2 J z fr
Stat χ2 J z fr
Stat χ2 J z fr
Stat χ2 J z fr
Stat χ2 J z fr
-50
Mushroom
Chess
T10I*
T40I*
Plants
Accidents
Pumsb
Retail
Fig. 8. Proportions of useful and harmful rules among 100 best rules, when mincf = 0.6. Proportions of useful and harmful rules when cf=0.9 Slightly useful rules Useful rules Slightly harmful rules Harmful rules
150
100
50
0
Stat χ2 J z fr
Stat χ2 J z fr
Stat χ2 J z fr
Stat χ2 J z fr
Stat χ2 J z fr
Stat χ2 J z fr
Stat χ2 J z fr
Stat χ2 J z fr
-50
Mushroom
Chess
T10I*
T40I*
Plants
Accidents
Pumsb
Retail
Fig. 9. Proportions of useful and harmful rules among 100 best rules, when mincf = 0.9.
StatApriori: an efficient algorithm for searching statistically significant association rules
25
Table 9. Average execution times (sec) by StatApriori. Mushroom Chess T10I4D100K T40I10D100K Plants Accidents Pumsb Retail
1 37 8 12 6 6 31 62
StatApriori performed faster than the traditional Apriori, even if no minimum frequency thresholds were used.
7. Related research In the previous research, statistical measures have been used mostly in the postprocessing phase. Relatively few algorithms have used them to guide the search. Usually, the task has been to search all significant classification rules X → C, with a fixed attribute C. In this case, it is also desirable that the attributes, rather than events, are dependent, and also negations are considered. As a result, the methods are not scalable for exhaustive search of all significant association rules. The most commonly used measure is χ2 , which was used already by Brin et al. (Brin, Motwani and Silverstein, 1997; Silverstein et al., 1998) to find the ”minimally correlated sets”, i.e. the most general attribute sets X such that χ2 (X) is sufficiently high. No rules were derived, and in fact it is possible that none of the association rules generated from a correlated set is necessarily significant (Morishita and Nakaya, 2000). Morishita et al. (Morishita and Nakaya, 2000; Morishita and Sese, 2000) developed a branch-and-bound method, which utilizes the convexity of the χ2 function. The search was restricted to classification rules with a fixed consequent C. Nijssen and Kok (Nijssen and Kok, 2006) searched also classification rules with χ2 and some other functions. They defined a minimum frequency threshold from threshold minχ2 and searched the rules with the traditional Apriori. They found that the approach was quite inefficient, because the resulting minimum frequency thresholds were too low. Other researchers have developed methods for searching association rules with zero or extremely low minimum frequency thresholds. If this could be done efficiently, the significant association rules could be selected afterwards, in the post-processing phase. Cohen et al. (Cohen, Datar, Fujiwara, Gionis, Indyk, Motwani, Ullman and Yang, 2001) and Fujiwara et al. (Fujiwara, Ullman and Motwani, 2000) searched only simple rules of form A → B. Wang et. al (Wang, Zhou and He, 2000; Wang, He and Cheung, 2001) searched classification rules with a minimum confidence threshold. The algorithm was tested only with one small data set and the scalability remained unknown. Poor scalability has been the main problem of apriori-type of algorithms, too.
26
W. H¨ am¨ al¨ ainen
Often the running times are not reported, but the algorithm has been tested only with small data sets which hints that it does not scale up well. Koh and Pears (Koh, 2008; Koh and Pears, 2007) implemented an interesting variation of the standard Apriori, where Fisher’s exact test was used as a significance criterion. Unfortunately, only a few experiments were reported. Fisher’s exact test was used also in (Koh, Rountree and O’Keefe, 2008) to find “sporadic rules”, i.e. strong and statistically significant rules on rare consequent attributes. ORD algorithm by Li (2006) is maybe the closest to our algorithm. ORD is a general Apriori-type algorithm, which searches optimal, non-redundant classification rules with some interestingness measure i (e.g. confidence or lift). No minimum frequency threshold is needed, but instead minI and minimum local support σ (threshold for P (X|A)) are used. A difference to our approach is that Li defined redundancy in a weaker sense (i.e. less pruning) than we do, by comparing rule X → A to all more general rules with the same consequent, i.e. Y → A, Y ( X. It also means that Li’s efficient pruning principle (“closure property”) stating that if P (XY ) = P (X), then all rules XY Q → C are redundant, cannot be applied in StatApriori. The reason is that even if γ(XY Q → C) ≤ γ(XQ → C), there can still be more significant rules (with a higher lift) of form γ(XY Q \ B → B) > γ(XQ \ B → B). The scalability of ORD algorithm remained open, since it was tested only with relatively small data sets and fixed rule length. In addition to search algorithms, there has been a lot of research and discussion on related topics like problems of frequency-confidence framework (Berzal et al., 2001; Aggarwal and Yu, 1998; Webb, 2006; Webb, 2007), how to estimate the confidence in a statistically sound way (Mozina, Demsar, Zabkar and Bratko, 2006), or solve the multiple testing problem (Webb, 2007).
8. Conclusions Searching statistically significant association rules is an important but neglected problem. So far, it has been considered computationally infeasible with any larger data sets. In this paper, we have shown that its is possible to search all statistically significant rules in a reasonable time. We have introduced a set of effective pruning properties and a breadth-first search strategy, StatApriori, which implements them. StatApriori can be used in two ways: either to search K most significant association rules or all rules passing the given significance threshold (minimum z-score). This enables the user to solve the multiple testing problem (i.e. setting the significance threshold) in a desired way or use the algorithm only for ranking the most significant rules. In the same time, StatApriori solves another important problem, and prunes out all redundant association rules. According to experimental results, this improves the rule quality by avoiding overfitting. Together, the z-score and redundancy reduction provide a sound method for rule discovery. I.e. the discovered rules have a high probability to hold in the future data. The current implementation of StatApriori is very efficient and in the experiments all data sets could be searched without any minimum frequency thresholds. However, if we want to find more than 100 best rules in dense data sets, the search can become slow. This could be solved by implementing the pruning principles in a depth-first search.
StatApriori: an efficient algorithm for searching statistically significant association rules
27
In the future research, we are going to implement other measure functions like J-measure and χ2 (for positive dependencies). It would also be interesting to compare the results with randomization test approach. In addition, we are going to apply the basic idea of StatApriori for searching both positive and negative dependencies. The current method cannot be used as such, but we have already invented new pruning principles. The final goal is to develop an efficient algorithm for searching the most significant, general association rules, containing any propositional logic formulas. Acknowledgements. This work was supported by a grant from the Finnish Concordia Fund.
References Aggarwal, C. and Yu, P. (1998), A new framework for itemset generation, in ‘Proceedings of the Seventeenth ACM SIGACT-SIGMOD-SIGART Symposium on Principles of Database Systems (PODS 1998)’, ACM Press, New York, USA, pp. 18–24. Agrawal, R., Imielinski, T. and Swami, A. (1993), Mining association rules between sets of items in large databases, in P. Buneman and S. Jajodia, eds, ‘Proceedings of the 1993 ACM SIGMOD International Conference on Management of Data’, Washington, D.C., pp. 207–216. Agrawal, R. and Srikant, R. (1994), Fast algorithms for mining association rules, in ‘Proceedings of the 20th International Conference on Very Large Data Bases, VLDB’94’, Morgan Kaufmann, pp. 487–499. Agresti, A. and Min, Y. (2005), ‘Frequentist performance of Bayesian confidence intervals for comparing proportions in 2 × 2 contingency tables’, Biometrics 61, 515–523. Asuncion, A. and Newman, D. (2007), ‘UCI machine learning repository’. URL: http://www.ics.uci.edu/∼mlearn/MLRepository.html Bastide, Y., Pasquier, N., Taouil, R., Stumme, G. and Lakhal, L. (2000), Mining minimal non-redundant association rules using frequent closed itemsets, in ‘Proceedings of the First International Conference on Computational Logic (CL’00)’, Vol. 1861 of Lecture Notes in Computer Science, Springer-Verlag, pp. 972–986. Benjamini, Y. and Hochberg, Y. (1995), ‘Controlling the false discovery rate: A practical and powerful approach to multiple testing’, Journal of the Royal Statistical Society, Series B 57(1), 289–300. Berzal, F., Blanco, I., S´ anchez, D. and Miranda, M. A. V. (2001), A new framework to assess association rules, in ‘Proceedings of the 4th International Conference on Advances in Intelligent Data Analysis (IDA’01)’, Vol. 2189 of Lecture Notes In Computer Science, Springer-Verlag, London, UK, pp. 95–104. Borgelt, C. and Kruse, R. (2002), Induction of association rules: Apriori implementation, in ‘Proceedings of the 15th Conference on Computational Statistics (COMPSTAT 2002)’, Physica Verlag, Heidelberg, Germany. Brin, S., Motwani, R. and Silverstein, C. (1997), Beyond market baskets: Generalizing association rules to correlations, in J. Peckham, ed., ‘Proceedings ACM SIGMOD International Conference on Management of Data’, ACM Press, pp. 265–276. Carriere, K. (2001), ‘How good is a normal approximation for rates and proportions of low incidence events?’, Communications in Statistics: Simulation and Computation 30, 327– 337. Cohen, E., Datar, M., Fujiwara, S., Gionis, A., Indyk, P., Motwani, R., Ullman, J. and Yang, C. (2001), ‘Finding interesting associations without support pruning’, IEEE Transactions on Knowledge and Data Engineering 13(1), 64–78. Freedman, D., Pisani, R. and Purves, R. (2007), Statistics, 4th edn, Norton & Company, London. Frequent Itemset Mining Dataset Repository (n.d.). Retrieved 10.2. 2009. URL: http://fimi.cs.helsinki.fi/data/ Fujiwara, S., Ullman, J. and Motwani, R. (2000), Dynamic miss-counting algorithms: Finding implication and similarity rules with confidence pruning, in ‘Proceedings of the 16th Inter-
28
W. H¨ am¨ al¨ ainen
national Conference on Data Engineering, (ICDE’00)’, IEEE Computer Society, pp. 501– 511. Gionis, A., Mannila, H., Mielik¨ ainen, T. and Tsaparas, P. (2007), ‘Assessing data mining results via swap randomization’, ACM Transactions on Knowledge Discovery from Data 1(3), 14:1–14:32. H¨ am¨ al¨ ainen, W. and Nyk¨ anen, M. (2008), Efficient discovery of statistically significant association rules, in ‘Proceedings of the 8th IEEE International Conference on Data Mining (ICDM 2008)’, pp. 203–212. Hoeffding, W. (1963), ‘Probability inequalities for sums of bounded random variables’, Journal of the American Statistical Association 58, 13–30. Jermaine, C. (2005), ‘Finding the most interesting correlations in a database: how hard can it be?’, Information Systems 30(1), 21–46. Koh, Y. and Pears, R. (2007), Efficiently finding negative association rules without support threshold, in ‘AI 2007: Advances in Artificial Intelligence, Proceedings of the 20th Australian Joint Conference on Artificial Intelligence (AI 2007)’, Vol. 4830 of Lecture Notes in Computer Science, Springer, pp. 710–714. Koh, Y., Rountree, N. and O’Keefe, R. (2008), ‘Mining interesting imperfectly sporadic rules’, Knowledge and Information Systems 14(2), 179–196. Koh, Y. S. (2008), Mining non-coincidental rules without a user defined support threshold, in ‘Advances in Knowledge Discovery and Data Mining, Proceedings of the 12th Pacific-Asia Conference (PAKDD 2008)’, Vol. 5012 of Lecture Notes in Computer Science, Springer, pp. 910–915. Li, J. (2006), ‘On optimal rule discovery’, IEEE Transactions on Knowledge and Data Engineering 18(4), 460–471. Lindgren, B. (1993), Statistical Theory, 4th edn, Chapman & Hall, Boca Raton, U.S.A. Liu, G., Li, J. and Wong, L. (2008), ‘A new concise representation of frequent itemsets using generators and a positive border’, Knowledge and Information Systems 17(1), 35–56. Mannila, H., Toivonen, H. and Verkamo, A. (1994), Efficient algorithms for discovering association rules, in ‘Papers from the AAAI Workshop on Knowledge Discovery in Databases (KDD’94)’, AAAI Press, pp. 181–192. Meo, R. (2000), ‘Theory of dependence values’, ACM Transactions on Database Systems 25(3), 380–406. Morishita, S. and Nakaya, A. (2000), Parallel branch-and-bound graph search for correlated association rules, in ‘Revised Papers from Large-Scale Parallel Data Mining, Workshop on Large-Scale Parallel KDD Systems, SIGKDD’, Vol. 1759 of Lecture Notes in Computer Science, Springer-Verlag, pp. 127–144. Morishita, S. and Sese, J. (2000), Transversing itemset lattices with statistical metric pruning, in ‘Proceedings of the nineteenth ACM SIGMOD-SIGACT-SIGART symposium on Principles of database systems (PODS’00)’, ACM Press, pp. 226–236. Mozina, M., Demsar, J., Zabkar, J. and Bratko, I. (2006), Why is rule learning optimistic and how to correct it, in J. Frnkranz, T. Scheffer and M. Spiliopoulou, eds, ‘Proceedings of the 17th European Conference on Machine Learning (ECML’06)’, Vol. 4212 of Lecture Notes in Computer Science, Springer, pp. 330–340. Nijssen, S. and Kok, J. (2006), Multi-class correlated pattern mining, in ‘Proceedings of the 4th International Workshop on Knowledge Discovery in Inductive Databases’, Vol. 3933 of Lecture Notes in Computer Science, Springer-Verlag, pp. 165–187. Piatetsky-Shapiro, G. (1991), Discovery, analysis, and presentation of strong rules, in G. Piatetsky-Shapiro and W. Frawley, eds, ‘Knowledge Discovery in Databases’, AAAI/MIT Press, pp. 229–248. Shaffer, J. (1995), ‘Multiple hypothesis testing’, Annual Review of Psychology 46, 561–584. Silverstein, C., Brin, S. and Motwani, R. (1998), ‘Beyond market baskets: Generalizing association rules to dependence rules’, Data Mining and Knowledge Discovery 2(1), 39–68. Smyth, P. and Goodman, R. (1992), ‘An information theoretic approach to rule induction from databases’, IEEE Transactions on Knowledge and Data Engineering 4(4), 301–316. Tan, P.-N., Kumar, V. and Srivastava, J. (2004), ‘Selecting the right objective measure for association analysis’, Information Systems 29(4), 293–313. The PLANTS Database (2008). Retrieved 31 December 2008. URL: http: // plants. usda. gov Wang, K., He, Y. and Cheung, D. (2001), Mining confident rules without support requirement, in ‘Proceedings of the tenth international conference on Information and knowledge management (CIKM1)’, ACM, New York, NY, USA, pp. 89–96.
StatApriori: an efficient algorithm for searching statistically significant association rules
29
Wang, K., Zhou, S. and He, Y. (2000), Growing decision trees on support-less association rules, in ‘Proceedings of the sixth ACM SIGKDD international conference on Knowledge discovery and data mining (KDD’00)’, ACM, New York, NY, USA, pp. 265–269. Webb, G. (2006), Discovering significant rules, in ‘Proceedings of the 12th ACM SIGKDD international conference on Knowledge discovery and data mining (KDD’06)’, ACM Press, New York, USA, pp. 434–443. Webb, G. I. (2007), ‘Discovering significant patterns’, Machine Learning 68(1), 1–33. Yen, S.-J. and Chen, A. (1996), An efficient approach to discovering knowledge from large databases, in ‘Proceedings of the fourth international conference on on Parallel and distributed information systems (DIS’96)’, IEEE Computer Society, Washington, DC, USA, pp. 8–18.
Author Biographies
insert photo
Wlhelmiina H¨ am¨ al¨ ainen received a M.Th. degree from the University of Helsinki, Finland, in 1998, a M.Sc. degree from the University of Helsinki, Finland, in 2002, and a Ph.Lic. degree from the University of Joensuu, Finland, 2006. She has worked as teacher, lecturer, and researcher both in the University of Helsinki and University of Joensuu since 1996. Currently she is finishing her Ph.D. degree at the Department of Computer Science, University of Helsinki. Her interests include data mining and machine learning algorithms, mathematics, and statistics.
Correspondence and offprint requests to: Wlhelmiina H¨ am¨ al¨ ainen, Department of Computer Science, University of Helsinki, Finland. Email:
[email protected]