be defined as,. AMBE (X, Y) =|Xm-Ym|. Where, Xm-mean of the input image. X={x (i,j)}, Ym-mean of the output image. Y={y(i, j)}. 3.2 Contrast Improvement Index.
An Efficient And Integrated Preprocessing Approach For,...V.Anu,etal,.. International Journal of Technology and Engineering System (IJTES) Vol 8. No.1 – Jan-March 2016 Pp. 57-64 ©gopalax Journals, Singapore available at : www.ijcns.com ISSN: 0976-1345
AN EFFICIENT AND INTEGRATED PREPROCESSING APPROACH FOR THE DIAGNOSIS OF DIABETIC RETINOPATHY IN COLOUR FUNDUS IMAGES V. ANU1, M. Caroline Viola Stella Mary2, J. Monica Esther3 1 PG Scholar, Francis Xavier Engineering College , Tirunelveli 2 Professor/IT, Francis Xavier Engineering College, Tirunelveli 3 AP/IT, Francis Xavier Engineering College, Tirunelveli ABSTRACT Diabetic retinopathy is the main source of legitimate visual deficiency in grown-ups in created nations. PC helped analysis is fancied in light of the fact that it considers mass screening for the ailment. All diabetics could be screened for the malady, regardless of the possibility that their vision is not debasing. Early finding considers early treatment, which is basic since retinal harm is irreversible. Splendid injuries, as exudates and cotton fleece spots, and dull sores, for example, hemorrhages, are markers of the infection. Challenges in this field incorporate division of these components, and additionally veins. visual impairment. The condition can create in any individual who has Type1 and Type2 diabetes. The longer you have diabetes and the less controlled your glucose is, the more probable you are develop this eye difficulty. As a diabetic has a tendency to have a considerable measure of other wellbeing difficulties, going visually impaired can have his issues increased. Diabetic retinopathy happens when the veins of the retina in the posterior part of the eye are harmed. Hurts due to little vessels would be known as scaled down scale vascular disease while hurts in light of the conductors would be full scale vascular ailment. PDR is the impelled stage whereby signs are sent by the retina to the body for the nonattendance of blood supply and this set off the advancement of new volunteers' vessels. Diabetic retinopathy in non-proliferative diabetes retinopathy or
1. INTRODUCTION Diabetic retinopathy is a diabetes inconvenience that influences eyes. Diabeticrelated eye infection is a noteworthy reason for preventable visual deficiency on the planet. It is an entanglement of diabetes which can likewise influence different parts of the body. At the point when the little veins have an abnormal state of glucose in the retina, the vision will be obscured and can bring about visual impairment in the long run. This is known as diabetic retinopathy. It is conveyed on by mischief to the veins of the LightSensitive tissues at the back of the eye (retina).It may cause no side effects or just mellow vision issues. In the long run, it can bring about
57
An Efficient And Integrated Preprocessing Approach For,...V.Anu,etal,.. proliferative diabetes retinopathy stages can prompt visual impedance or even visual impairment. In right on time phases of diabetic retinopathy there are no side effects. It might include: Spots or dim strings skimming in your vision(floaters), Blurred Vision, Fluctuation Vision, Impaired shading vision, Dark or void regions in your ,Vision Loss. It for the most part influences both eyes. Two types of Diabetic retinopathy are there. Early diabetic retinopathy: In normally frame called non-proliferative diabetic retinopathy (NPDR) fresh recruits vessels are not developing (proliferating).Advance diabetic retinopathy: It can advancement to this more serious sort, known as preoperative diabetic retinopathy. In this sort, harmed veins close off, bringing on the development of new, unusual veins in the retina and can spill into the clear, jam like substance that fills the focal point of our eye (vitreous). Fundus of Human Eye: The fundus of the eye is within surface of the eye opposite the lens and joins the retina, optic plate, macula, fovea, and back post. The fundus can be dissected by opthalmoscopy and/or fundus photography. The term fundus might likewise be comprehensive of Bruch's membrance and the choroid.
examination of primates the retina is blue, green, yellow, orange, and red, simply the human fundus (from a delicately pigmented light individual) is red. The significant complexities noted among the "higher" primate species were size and consistency of the edge of masculararea, size and condition of the optic plate, clear "texturing" of retina, and pigmentation of retina.
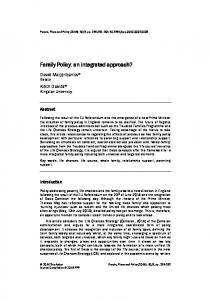
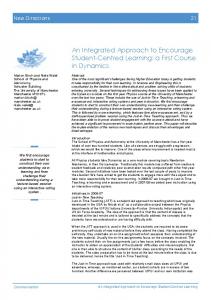
Fig 1.2: Retinal fundus images of (a) Normal (b) Mild (c) Moderate (d) Severe (e) Proliferative Diabetic Retinopathy 2. PREPROCESSING OF IMAGES Preprocessing is an essential stage because the fundus images may not have proper illumination and lighting conditions. Blood vessel can be seen as thin elongated structures in retina, with variation in width and length. In order to segment the blood vessel from the fundus retinal image, we have implemented a pre-processing technique, which consist of histogram equalisation (AHE). The point of pre-preparing is to weaken the commotion, to enhance the differentiation and to remedy the non-uniform enlightenment. In the RGB picture the green channel shows the best differentiation between the vessels and foundation while the red and blue ones have a tendency to be more commotion. Consequently green channel is utilized for further handling. The following step is transformation of green channel picture into a dim scale picture, as the retinal veins seem darker in the dim picture. Every one of the elements such as veins, MAs and so on are covered up out of sight and are not plainly obvious. Along these lines Normalization and
Fig 1.1: Fundus of Human Eye Variety: The shade of the fundus fluctuates both between and inside species. In one 58
An Efficient And Integrated Preprocessing Approach For,...V.Anu,etal,.. complexity upgrade is performed to enhance the picture quality.
frequently produces improbable impacts in photos; be that as it may it is exceptionally helpful for experimental pictures such as warm, satellite or x-beam pictures, frequently the same class of pictures to which one would apply false-shading or both dull.
Standardization is performed by subtracting an estimated foundation from the shading picture. A 30x30 middle channel is connected to the dark picture and they came about picture is subtracted plane to get standardized picture. Versatile Histogram Equalization is connected for complexity improvement. A dim area including vessels, MAs, exudates and clamor are prevailing after difference improvement. The shading edge is chosen to decide the vessels, Micro aneurysms and exudates. In distinguishing irregularities connected with fundus picture, the pictures must be pre-prepared keeping in mind the end goal to amend the uneven light, not adequate difference in the middle of exudates and picture foundation pixels and the vicinity of commotion in the info fundus picture.
2.2 Adaptive Histogram Equalisation Versatile histogram balance (AHE) is a PC picture preparing system used to enhance contrast in pictures. It varies from standard histogram evening out in the admiration that the versatile technique registers a few histograms, each comparing to a particular segment of the picture, and uses them to redistribute the softness estimations of the picture. It is in this manner suitable for enhancing the nearby difference and improving the meanings of edges in every area of a picture. Notwithstanding, AHE tends to over amplify clamor in generally homogeneous districts of a picture. A variation of versatile histogram evening out called contrast restricted versatile histogram adjustment (CLAHE) keeps this by constraining the enhancement. 3. FEATURE EXTRACTION 3.1 Absolute Mean Brightness Error It is used to evaluate Brightness presentation in processed images. AMBE can be defined as,
Fig 2.1: Block Diagram for Preprocessing 2.1 Histogram Equalisation
AMBE (X, Y) =|Xm-Ym|
This strategy normally expands the worldwide differentiation of numerous pictures, particularly when the usable information of the picture is spoken to by close differentiation values. Through this change, the intensities can be better circulated on the histogram. The strategy is helpful in pictures with foundations and frontal areas that are both brilliant Histogram evening out
Where, Xm-mean of the input image X={x (i,j)}, Ym-mean of the output image Y={y(i, j)} 3.2 Contrast Improvement Index So as to assess the aggressiveness of the diverse difference upgrade procedures, the 59
An Efficient And Integrated Preprocessing Approach For,...V.Anu,etal,.. most surely understood benchmark picture improvement measure, the Contrast Improvement Index (CII) is utilized to compare the aftereffects of complexity improvement strategies. It can be measured utilizing CII as a proportion. It is characterized as the proportion of the Original to the improved, C. It can be measured with 3 x 3 windows as: ( (
reproduction quality. A higher PSNR for the most part shows that the remaking is of higher quality, now and again it may not. It is just definitively legitimate when it is utilized to look at results from the same code sand same substance .PSNR is most effectively characterized through the mean squared mistake [MSE].Given a commotion free m x n monochrome picture 1 and its loud estimate k, MSE is characterized as ,
) )
∑ ∑[ (
)
(
)]
3.3 Mean Square Error Mean square blunder is characterized as sign devotion measure. The objective of a sign devotion measure is to analyze two signs by giving a quantitative score that portrays the level of likeness/constancy or, then again, the level of blunder/bending between them . It is accepted that one of the sign is a flawless unique ; the other is twisted or debased by mistakes. Assume x= {xi/i=1,2,… ,N }, y={yi/i=1,2,… ,N} are two limited length, discrete signs ,where N is the quantity of sign examples. Xi and Yi are the qualities of ith tests in x and y. The MSE between the signs is, MSE(x, y) =
∑
(
The PSNR is characterized as , (
)
4. RESULTS AND DISCUSSION For less demanding examination of middle of the road results are accomplished by proposed calculation and to make the investigation process computerized, we planned a Graphical User Interface (GUI).The GUI is composed in a manner that it is less demanding to be comprehended and utilized even by nonophthalmologists. The consequences of the examination are exhibited in clear and easier way. The fundus pictures once nourished to the GUI will be naturally broke down and arranged into three particular classes i.e., Normal, Non-Proliferative, Proliferative class. The execution examination had been made out of 40 pictures 37 pictures were accurately recognized and 3 pictures were mistakenly distinguished.
)
3.4 Peak Signal to Noise Ratio PSNR is an arranging term for the degree between the most ideal force of a sign and the force of wrecking tumult that affects the consistency of its representation. Numerous signs have a wide component territory; it is typically communicated as far as the Logarithmic decibel scale. Used to quantify the nature of reproduction of lossy pressure codes. The sign for this situation is the first information, and then noise is the blunder presented by pressure. At the point when looking at pressure codes, PSNR is estimation to human impression of 60
Channels
Low
Medium
High
Blue
63.94437
64.61084
64.92303
Red
58.31497
58.09659
59.58493
An Efficient And Integrated Preprocessing Approach For,...V.Anu,etal,.. Green
61.7998
62.04949
62.70939
Table 4.1 PSNR values
Fig 4.4 Graph for MSE values
Fig 4.2 Graph for PSNR values
Channels
Low
Medium
High
Blue
0.026427
0.022667
0.021095
Green
0.043301
0.040882
0.035119
Red
0.096601
0.101583
0.072109
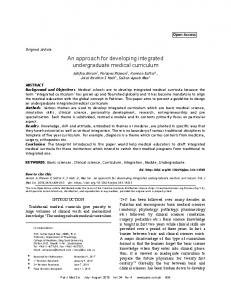
Channels
Low
Medium
High
Blue
0.888804
0.817823
0.537371
Red
1.149926
1.191737
1.152275
Green
1.172675
1.154475
1.027307
Table 4.5 CII values
Table 4.3 MSE values
61
An Efficient And Integrated Preprocessing Approach For,...V.Anu,etal,.. Fig 4.6 Graph for CII values
Channels
Low
Medium
High
Blue
0.058216
0.056783
0.066255
Red
0.07665
0.078036
0.102749
Green
0.062425
0.061378
0.069425
Table 4.7 AMBE values
ophthalmologists is lacking to treat more Diabetic Retinopathy patients, in this manner altogether lessening their workload. Ophthalmologists can make utilization of this framework as a preparatory determination apparatus in their Diabetic Retinopathy screening system, which helps them to analyze the side effect all the more precisely and rapidly. Additionally, including powerful microaneursyms and drain identification strategy alongside this framework can enhance its capacity to accept the level of Diabetic Retinopathy. Here we prepare with retinal pictures acquired from the DRIVE database, this a beginning stride in which we separate the data from the pictures, for example, retinal estimations. These strides are done in light of the fact that it will be utilized by the specialists for the examination of different infections which corresponds with these estimations. One of the major points of interest of this procedure is, by utilizing the one time execution every one of the components are separated and utilized for the patient's initial treatment. REFERENCES 1.
Abramoff M.D., Niemeijer M., SuttorpSchulten M.S.A., Viergever M.A., Russell S.R., Ginneken B. (2008), ‘Evaluation of a system for automatic detection of diabetic retinopathy from color fundus photographs in a large population of patients with diabetes’, Diabetes Care, Vol. 31, No.2, pp. 193– 198.
2.
Akram M.U., Tariq A., Anjum M.A., Javed M.Y. (2012), ‘Automated detection of exudates in colored retinal images for diagnosis of diabetic retinopathy’, Appl. Opt., Vol. 51, pp. 4858–4866.
3.
Bresnick G.H., Mukamel D.B., Dickinson J.C., Cole D.R. (2000), ‘A
Fig 4.8 Graph for AMBE values
5. CONCLUSION AND FUTURE ENHANCEMENT This paper exhibited a productive calculation for the recognition and division of the exudates from the retinal pictures, which assumes a vital part in the finding of Diabetic Retinopathy, has been displayed. This framework will be extraordinarily valuable in creating nations, where the accessibility of 62
An Efficient And Integrated Preprocessing Approach For,...V.Anu,etal,.. neural networks’. Proc. Med. Image Understand. Anal. Conf., pp. 49–52.
screening approach to the surveillance of patients with diabetes for the presence of vision-threatening retinopathy’, Ophthalmology, Vol. 107, No.1, pp. 19– 24. 4.
5.
6.
7.
8.
9.
10. Patton N., Aslam T.M., MacGillivray T., et al. (2006), ‘Rétinal image analysis concepts, applications and potential’, Prog. Retin. Eye Res., Vol. 25, No.1, pp. 99–127.
Cree M.J., Olson J.A., McHardy K.C., Sharp P.F., Forrester J.V. (1999), ‘The preprocessing of retinal images for the detection of fluoresce in leakage’, Phys. Med. Biol., Vol. 44, No.1, pp. 293–308.
11. Peli E., Peli T. (1989), ‘Restoration of retinal images obtained through cataracts’, IEEE Trans. Med. Imaging, Vol.8, No.4, pp. 401–406.
Harangi B., Lazar I., Hajdu A. (2012), ‘Automatic exudate detection using active contour model and region wise classification’. Conf. Proc. IEEE Eng. Med. Biol. Soc., pp. 5951–5954.
12. Philip S., Fleming A.D., Goat man K.A., et al. (2007), ‘The efficacy of automated ‘disease/no disease’ grading for diabetic retinopathy in a systematic screening program me’, Br. J. Ophthalmol., Vol. 91, No.11, pp. 1512–1517.
Hsu W., Pallawa P.M.D.S., Li Lee M., Eong K.-G. A. (2001), ‘The role of domain knowledge in the detection of retinal hard exudates’. Proc. Of the IEEE Conf. Computer Vision and Pattern Recognition (CVPR), Kauai, Hi, USA, Vol. 2, pp. 246–251.
13. Rocha A., Carvalho T., Jelinek H.F., Goldenstein S., Wainer J. (2012), ‘Points of interest and visual dictionaries for automatic retinal lesion detection’, IEEE Trans. Biomed. Eng., Vol. 59, No.8, pp. 2244–2253.
Narasimha-Iyer H., Can A., Roysam B., et al. (2006), ‘Robust detection and classification of longitudinal changes in color retinal fundus images for monitoring diabetic retinopathy’, IEEE Trans. Biomed. Eng., Vol. 53, No.6, pp. 1084–1098.
14. Sanchez C.I., Hornero R., Lopez M.I., Aboy M., Poza J., Abásolo D. (2008), ‘A novel automatic image processing algorithm for detection of hard exudates based on retinal image analysis’, Med. Eng. Phys., Vol. 30, No. 3, pp. 350–357.
Niemeijer M., Ginneken B.V., Cree M.J., et al. (2010), ‘Retinopathy online challenge: automatic detection of microaneursyms in digital color fundus photographs’, IEEE Trans. Med. Imaging, Vol. 29, No.1, pp. 185–195.
15. Sinthanayothin C., Boyce J.F., Cook H.L., Williamson T.H. (1999), ‘Automated localization of the optic disc, fovea and retinal blood vessels from digital color fundus images’, Br. J. Ophthalmol., Vol. 83, No.8, pp. 231–238.
Osareh A., Mirmehdi M., Thomas B., Markham R., (2001), ‘Automatic recognition of exudative maculopathy using fuzzy c-means clustering and
16. Sinthanayothin C., Boyce J.F., Williamson T.H., et al. (2002), ‘Automated detection of diabetic 63
An Efficient And Integrated Preprocessing Approach For,...V.Anu,etal,.. retinopathy on digital fundus images’, Diabetes. Med., Vol. 19, No.2, pp. 105– 112.
d’avancement de thèse’. Ecole des Mines de Paris, Centre de Morphologie Mathématique, Paris, France.
17. Sopharak A., Uyyanonvara B., Barmanb, S., Williamson, T.H. (2008), ‘Automatic detection of diabetic retinopathy exudates from non-dilated retinal images using mathematical morphology methods’, Comput. Med. Imaging Graph, Vol. 32, No.8, pp. 720–727.
19. Walter T., Klein J.-C., Massin P., Erginay A., ‘A contribution of image processing to the diagnosis of diabetic retinopathy – detection’. 20. Yazid, H., Arof, H., Isa, H.M. (2012), ‘Automated identification of exudates and optic disc based on inverse surface thresholding’, J. Med. Syst., Vol. 36, pp. 1997–2004.
18. Walter T. (2000), ‘Detection de Pathologies Rétiniennes à Partir d’Images Couleur du Fond d’œil. Rapport
64