2013 International Conference on Control Communication and Computing (ICCC)
An Efficient and Lossless Fingerprint Encryption Algorithm Using Henon Map & Arnold Transformation 1
1,2
Garima Mehta, 2Malay Kishore Dutta, 3Jan Karasek, 4Pyung Soo Kim Amity School of Engineering & Technology, Amity University, Noida, India, 3Brno University of Technology, Czech Republic, European Union, 4Korea Polytechnic University, Korea
[email protected],
[email protected],
[email protected],
[email protected] accessing a secured data or system .This key should be protected from being stolen which in turn makes our system less vulnerable to attacks. Therefore, biometric data security is one of the most important issues in deploying a biometric system and its protection. .
Abstract— In this paper two stage biometric data
protection scheme is being proposed using permutation and substitution mechanism of the chaotic theory which is lossless in nature. Arnold transformation and Henon map is used to design an efficient encryption system. The encryption method is aimed at generating an encrypted image that will have statistical properties completely dissimilar from the original image analysis which will make it difficult for any intruder to decrypt the image. The performance of the method has been experimentally analyzed using statistical analysis and correlation based methods. Correlation coefficient analysis is done to evaluate the behavior of pixels in horizontal and vertical directions and the results are found to be encouraging. This protection scheme provides the ability to encrypt the data and secure it from unauthorized users. Upon decryption the data is completely recovered making this scheme a lossless and efficient method of biometric data security.
A biometric system is prone to following threats [3]: Evasion: Access of sensitive data to an unauthorized user who has entered the biometric system illegally. 2. Refusal: Illegal or unauthorized use of privileges by a legitimate user to alter the sensitive data, then denying from altering this biometric data and blaming an intruder attack. 3. Spoofing: Creating false biometric traits of a legitimate user by an unauthorized user to hack into the security system to steal sensitive data. 4. Collusion: Use of one’s administrative rights to modify security aspects of a biometric system so that an unauthorized user can access it. 5. Coercion: An unauthorized user gaining access of the biometric system forcefully. 6. Denial of Service (DoS): An unauthorized user overloading the computational resources of the system by sending a huge amount of illegal requests that the valid request is not processed. 1.
Index Terms— Biometric Encryption, Henon Map, Arnold Map, Authentication, Minutiae point matching I.
INTRODUCTION
A
utomatic identification of a human being based on anatomical (e.g. fingerprint, iris, palmprint) or behavioral (signature, voice) traits is termed as Biometrics. Biometric Authentication offers more secure and reliable mechanism to combat the epidemic growth of identity theft and to meet the security requirements of secured databases [1]. Introduction of biometrics in a variety of applications like access control to facilities and computers, criminal identification, border security, access to nuclear power plant, identity authentication in network environment, airport security, issue of passports or driver licenses, forensic and medical databases [2] has demanded a reliable identity management system to combat the epidemic growth of identity thefts and to meet the increased security requirements of secure databases. Biometric Authentication is just one bit of information which acts like a password or a key for
Area of Interest
Provide Old Data Sensor
Feature Extractor
Matcher
Modify Stored Data
Application Device
Provide Fake Data Trojan Horse Program
Fig 1. Points of attack in a Biometric System
A biometric system can be attacked [1] at various points as describe in Fig 1: (a) An unauthorized user can try to hack the system using fake biometric data to the biometric sensor, (b) an unauthorized user can resubmit the illegally hacked
This work is supported in part by the Grants from Department of Science and Technology, No.DST/TSG/NTS/2011/173,Government of India & Projects SIX CZ.1.05/2.1.00/03.0072, EU ECOP EE.2.3.20.0094, and MPO FR-TI4/151, Czech Republic.
978-1-4799-0575-1/13/$31.00 ©2013 IEEE
Synthesized Features
Stored Biometric Data
485
data, (c) the software application program inside the feature extractor, matcher and application device can be replaced with Trojan horse program, (d) illegally synthesized biometric traits can be presented to the system and finally (e) the stored biometric data can be hacked and modified according to needs of an unauthorized user.
or substitution is based on Henon Map [5,6]. The mixture of two maps is required in which Arnold cat map shuffles the position of pixels but they return to their original positions after number of iterations and henon map is used because of its non linear and pseudorandom behavior and is used to provide fast and high secure image encryption which is required to complete the encryption process so that the encrypted data is unintelligible to an unauthorized user.
Biometric Data Protection Schemes
Feature Transformation
Data Encryption
Salting
Non Invertible
2.1 Arnold Cat Map Arnold cat map is a two dimensional chaotic map employing shearing and wrapping operation to generate a disordered matrix after several iterations.
Biometric Cryptosystems
Key Binding
Key Generation
Mathematical expression [7] for Arnold cat map:
Fig. 2 Biometric Data Protection Schemes
mod M where a, b, c and d are positive integers, ad-by = + 1 xn, yn, xn+1 and yn+1 are integers in {0, 1,2,..,M-1} The (xn , yn) is the pixel position in the original image, and the (xn+1,yn+1) is the new pixel position of the pixel (xn, yn). Since ad-bc = + 1the above expression can be modified as:
Fig. 2 presents the biometric data protection schemes [1], which are categorized into three (a) Encryption (b) Feature Transformation (c) Biometric Cryptosystem. In data encryption scheme biometric data will be encrypted using an encryption key during enrollment, during authentication stored data will be decrypted using the correct decryption key and will be matched with specific query, in feature transformation during enrolment, the feature will be transformed using the user’s password and during authentication, the query is also transformed using the same password before being matched with the transformed feature. Biometric Cryptosystems allows binding of a secure key to the biometric data to obtain a secure sketch from which no information regarding the biometric data or the key can be recovered. During authentication, a query will be used to recover the original biometric template from helper data and exact recovery of the original biometric data will be verified to authentic a user. This paper will focus on the use of two stage Chaotic Biometric Image encryption scheme for safeguarding the biometric system which has high perceptual security. The proposed method have used two maps i.e. Arnold map and Henon map for pixel shuffling and then measure correlation coefficient and peak signal to noise ratio between original fingerprint image and encrypted fingerprint image. Minutia point extractions have been done from original image as well as decrypted image which proves that the encryption scheme is lossless in nature. This paper is organized as follows: Section II provides the design of proposed chaos based image encryption scheme [5]. Section III discusses the experimental result which includes the results of perceptual security, statistical attack analysis and Section IV concludes the paper.
1
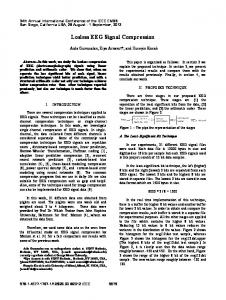
mod M 1 The parameter e, f and iterating times N can be used as the secret keys of the encryption algorithm. Suppose that K represent the iterating times there exist positive integers T (the periodicity) such that the K iterated image is the same as original image . 2.2 Henon Map Henon Map is a discrete time dynamical system that shows chaotic behavior. The Henon map is described as following: 1 1.5
1
0.5
0
-0.5
-1
-1.5 -1.5
-1
-0.5
0
,
II. PROPOSED CHAOS BASED BIOMETRIC IMAGE ENCRYPTION
0.5
1
1.5
0,1,2, ..
Fig 3. Response of the Henon Map
In the proposed algorithm, biometric data encryption is performed by two stage encryption process which is based on permutation and substitution architecture [9] where shuffling or permutation is based on Arnold Cat Map and disordering
Henon map shows chaotic behavior for a=1.4 and b=0.3 and for other values of a and b the map may be chaotic, intermittent or converge to periodic orbit.
486
minutia points are extracted from the original image and the decrypted image and are matched for unique identification.
2.3 Proposed Algorithm Let B (x, y) represent a biometric image of size N X N to be encrypted 1. 2. 3. 4.
5.
3.1 Statistical Attack Analysis:
Step 1: Generate a first disordered image S1 (x, y) by applying n1 iterations of Arnold Cat Map. Step 2: Generate a confusion matrix C1(x, y) by applying Henon Map with initial conditions t1. Step 3: XOR the disordered image S1 and confusion matrix C1 to create a partially encrypted image matrix X1(x, y). Step 4: Taking X1(x, y) as an input image, apply step 1 to 3 again to obtain a modified image matrix M1(x, y) using n2 iterations for Arnold cat map and t2 conditions for henon map. Step 5: Introduce two new matrices forward diffusion FD(x, y) and reverse diffusion RD(x, y) on the modified image matrix M1(x, y) to generate the finally encrypted image matrix E (x, y).
The effectiveness of the proposed encryption algorithm is measured on the basis of its power to resist the statistical attacks by correlating the relationship between the original and encrypted biometric data using the histogram and correlation coefficient analysis. 3.1.1Histogram Analysis: The original fingerprint image with size 256*256 is shown in fig.5 (a) and the histogram of original fingerprint image is shown in fig.5 (b).Fig 6 (a) shows the disordered image after applying n1 iterations of arnold cat map on original image which yields disordered image. Fig 6 (b) shows its corresponding histogram. There is no difference between the histogram of original and disordered image as disordering of pixels just shuffle the position of the pixels. Fig.7 (a) shows partially encrypted image that comes out after performing XOR operation on the results of Henon map and Arnold cat map. As only shuffling of pixels is not an efficient way of making the image unintelligible to the intruder because just shuffling of pixels causes the pixels to come back to its original position after few iterations [5] and fig.7 (b) is the histogram of partially encrypted image. Fig 8 (a) shows the finally encrypted image and fig 8(b) shows the uniform histogram of final encrypted image. Encrypted image yields uniform histogram in comparison to non uniform histogram produced by original image which makes it hard for an invader to correlate between the original image and its corresponding encrypted image.
To decrypt this image reverse procedure is followed with the knowledge of correct decryption key (n1, n2, t1, t2) 2.4 Block Diagram of Proposed Algorithm Original Image
Arnold Iterations
Henon Map Repeat Twice Chaotic Matrix
Partially Encrypted Image
Forward & Reverse Diffusion Matrix
(a)
(b)
Fig 5: Original Fingerprint image and its histogram (a) Original Fingerprint Image (b) histogram of original image
Encrypted Image
Fig 4. Proposed Encryption Algorithm Figure 4 shows the block diagram of the proposed encryption algorithm in which two stage encryption process is followed to secure the biometric data efficiently. III. EXPERIMENTAL RESULTS AND ANALYSIS The experimental results of statistical attack analysis which includes histogram analysis, perceptual security and correlation coefficient analysis is presented in this section of the paper. To check the lossless nature of the method the
(a)
(b)
Fig 6: Disordered fingerprint image using Arnold cat map with n=48 (a) Disordered fingerprint image (b) histogram of disordered fingerprint image
487
further find out the relationship between original image and encrypted image correlation coefficient is measured in horizontal and vertical directions by selecting random pixels in both x and y axis for horizontal and vertical direction and results are presented in Table 1. The experimental results indicate that the correlation coefficient between the original image and the encrypted image is very low and the PSNR is also much lower indicating the encryption has good perceptual security. (a)
(b)
Image
Fig 7: Partially encrypted fingerprint image and its histogram (a) Partially encrypted fingerprint image (b) histogram of partially encrypted fingerprint image
Fingerprint 1 Fingerprint 2 Fingerprint 3 Fingerprint 4 Fingerprint 5
PSNR (dB)
Horizontal Correlation Original Encrypted
Vertical Correlation Original Encrypted
9.9379
0.8047
0.0071
0.9561
0.0177
7.7673
0.7628
0.0039
0.9212
0.0062
5.9436
0.9115
-0.0101
0.8587
-0.0229
6.3787
0.8541
0.0070
0.8101
-0.0088
5.9593
0.9123
0.0001
0.8643
0.0143
Table 1: PSNR & Correlation Coefficients Values 3.2Extraction of Minutia points from fingerprint (a)
(b)
A fingerprint is made of a series of ridges and furrows on the surface of the finger. The uniqueness of a fingerprint can be determined by the pattern of ridges and furrows as well as the minutia points. Minutia points are local ridge characteristics that occur at either a ridge bifurcation or a ridge ending. Fingerprints examiners claim that two fingerprints are identical when they have match of at least 12 minutia points [4]. In our proposed algorithm original and encrypted image have same set of minutia points extracted [8] which means that this proposed method is lossless in nature.
Fig 8: Final encrypted fingerprint image and its histogram (a) final encrypted fingerprint image (b) histogram of final Encrypted fingerprint image.
(a)
Terminations or bifurcations extracted from input fingerprint image are:
(b)
No. of Terminations: 16 No. of bifurcations: 7
Fig 9 Decrypted Fingerprint image and its histogram (a) Decrypted Fingerprint image (b) histogram of Decrypted image.
3.1.2 Perceptual Security Analysis
&
------------------------------------------------------------------Name: Original_Fingerprint.jpg Date: 2013-04-25 Number of Terminations: 16 Number of Bifurcations: 7 ------------------------------------------------------------------------------------------------------------------------------------Terminations : ------------------------------------------------------------------X Y Angle 140 27 -2.62 68 33 0.00 47 37 0.52 105 55 3.14 120 62 0.00 140 70 0.79 65 74 0.00 148 79 0.00 164 81 2.62 92 86 -2.62 107 116 -0.52 103 121 0.79
Correlation Coefficient
Perceptual Security means that encrypted images are completely unintelligible and make it hard for an invader to retrieve any significant information about the original image. Peak to Signal Noise Ratio (PSNR) is calculated which reflects that encrypted data is unintelligible to an unauthorized user. The minimum threshold PSNR value is 28dB that is required for perceptual similarity between original and encrypted biometric data. Correlation Coefficients must have a value between 0.75 – 1.00 for the original data and less than 0.1 for the encrypted data and if the correlation coefficient is zero it means that original and encrypted images are absolutely different. To
488
75 137 -2.09 81 137 1.57 79 144 -1.05 87 183 -0.52 ------------------------------------------------------------------Bifurcations : ------------------------------------------------------------------X Y Angle 1 Angle 2 Angle 3 148 91 2.36 -2.62 -0.79 100 98 2.62 -2.36 0.00 118 117 -2.62 2.09 -0.52 36 126 3.14 -1.05 0.79 37 154 -2.36 1.57 -0.79 72 164 3.14 -1.57 0.79 104 168 2.62 1.05 -1.05
Sl. No.
Minutia points in Original Image
Minutia points in Decrypted Image
No. of Points matched
Accuracy of matching
Fingerprint Image 1 Fingerprint Image 2 Fingerprint Image 3 Fingerprint Image 4 Fingerprint Image 5 Fingerprint Image 6 Fingerprint Image 7 Fingerprint Image 8 Fingerprint Image 9 Fingerprint Image 10
34 27 23 21 19 21 35 38 23 33
34 27 23 21 19 21 35 38 23 33
34 27 23 21 19 21 35 38 23 33
100% 100% 100% 100% 100% 100% 100% 100% 100% 100%
Table 3 : Minutia Point matching of the original image and the decrypted image
Template of the Decrypted Image :
IV. CONCLUSION Name: Decrypted_Fingerprint.jpg Date: 2013-04-25 Number of Terminations: 16 Number of Bifurcations: 7 ------------------------------------------------------------------------------------------------------------------------------------Terminations : ------------------------------------------------------------------X Y Angle 140 27 -2.62 68 33 0.00 47 37 0.52 105 55 3.14 120 62 0.00 140 70 0.79 65 74 0.00 148 79 0.00 164 81 2.62 92 86 -2.62 107 116 -0.52 103 121 0.79 75 137 -2.09 81 137 1.57 79 144 -1.05 87 183 -0.52 ------------------------------------------------------------------Bifurcations: ------------------------------------------------------------------X Y Angle 1 Angle 2 Angle 3 148 91 2.36 -2.62 -0.79 100 98 2.62 -2.36 0.00 118 117 -2.62 2.09 -0.52 36 126 3.14 -1.05 0.79 37 154 -2.36 1.57 -0.79 72 164 3.14 -1.57 0.79 104 168 2.62 1.05 -1.05
In this paper propose a two stage biometric image protection algorithm based on chaotic theory. The proposed algorithm is lossless and is based on combination of permutation and substitution. The PSNR between original and encrypted data of the proposed algorithm is found to be very much less than 10 dB which shows that there is no similarity between these two. The proposed algorithm has been tested using horizontal and vertical correlation coefficients and the result shows high resistances of the algorithm towards statistical attacks. Fingerprint minute points extraction has been done and matched from the original and decryp ted image to prove that algorithm is lossless in nature. This two stage encryption scheme is a robust and efficient method to protect biometric data. Encrypted image yields statistical properties like histogram analysis which makes difficult to the intruder to find any predictable relationship between the original and its corresponding encrypted image. Future work may include working on encryption of other biometric traits.
References 1. 2.
3. 4.
Table 2 : Minutia Point Extraction from Encrypted and Decrypted Image
5.
Table 2 gives the minutia point extracted from the original image of the sample fingerprint 1 and the decrypted image of the same sample. It can be seen that all the minutia points in the original image and the decrypted image is the same and hence it may be concluded that the encryption-decryption process is lossless in nature. Similar experiments have been performed with 150 samples and the results of 10 samples are tabulated in Table 3. The experimental results presented in Table 3 clearly indicate the accuracy of 100% which means the encryption scheme is lossless in nature.
6. 7. 8. 9.
489
Anil K. Jain, Karthik Nandakumar, and Abhishek Nagar, "Biometric Template Security," EURASIP Journal on Advances in Signal Processing, vol. 2008, p. 17, 2008. Madhavi Gudavalli et. al. “ A Template Protection Scheme for Multimodal Biometric System with Fingerprint, Palmprint, Iris and Retinal Traits”, Proceeding of the CUBE International Information Technology Conference, pp. 102-107, 2012 D. Maltoni, D. Maio, A. K. Jain and S. Prabhakar “Handbook of Fingerprint Recognition”, Springer, 2003. N. Ratha, J. H. Connell, and R. M. Bolle, “An analysis of minutiae matching strength,” in Proc. Audio and Video-based Biometric Person Authentication (AVBPA), pp. 223–228, (Halmstad, Sweden), June 2001. Chen Wei-bin,Zhang Xin et. al.,”Image Encryption Algorithm Based on Henon Chaotic System”, International Conference on image analysis and signal processing,pp.94-97, April 2009. YuanZhi Wang Sun et. al., “Image Encryption Method Based on Chaotic Map”, IEEE Conference on Industrial electronics and applications, pp.2558-2560, 2007. Mao-Yu Huang et. al., “Image Encryption Method Based on Chaotic Map”, International Computer Symposium (ICS), pp 154158, 2010. Anil K.Jain, “Handbook of Fingerprint Recognition”, Springer 2003. N. Taneja et. al., “Chaos based cryptosystem for still visual data”, Multimedia Tools and Applications, pp 281-298, 2012