An Efficient Approach to Obtaining Large Numbers of Distant Supernova Host Galaxy Redshifts C. Lidman A,B,Q , V. Ruhlmann-Kleider C , M. Sullivan D , J. Myzska A,E , P. Dobbie A , K. Glazebrook F,B , J. Mould F,B , P. Astier G ,C. Balland G,P , M. Betoule G , R. Carlberg H , A. Conley I , D. Fouchez J , J. Guy G , D. Hardin G , I. Hook D,N , D. A. Howell K,O , R. Pain B,G , N. Palanque-Delabrouille C , K. Perrett H,L , C. Pritchet M , N. Regnault G , and J. Rich C A
Australian Astronomical Observatory, PO Box 296, Epping NSW 1710, Australia ARC Centre of Excellence for All-sky Astrophysics (CAASTRO) C DSM/IRFU/SPP, CEA-Saclay, F-91191 Gif-sur-Yvette, France D Department of Physics (Astrophysics), University of Oxford, DWB, Keble Road, Oxford OX1 3RH, UK E Villanova University, 800 East Lancaster Avenue Villanova, PA 19085, USA F Centre for Astrophysics and Supercomputing, Swinburne University of Technology, PO Box 218, Hawthorn, VIC 3122, Australia G LPNHE, Universite Pierre et Marie Curie Paris 6, Universite Paris Diderot Paris 7, CNRS-IN2P3, 4 place Jussieu, 75005 Paris, France H Department of Astronomy and Astrophysics, University of Toronto, 50 St. George Street, Toronto, ON, M5S 3H4, Canada I Center for Astrophysics and Space Astronomy, University of Colorado, 593 UCB, Boulder, CO, 80309-0593, USA J CPPM, CNRS-IN2P3 and University Aix Marseille II, Case 907, 13288 Marseille cedex 9, France K Las Cumbres Observatory Global Telescope Network, 6740 Cortona Dr., Suite 102, Goleta, CA 93117, USA L DRDC Ottawa, 3701 Carling Avenue, Ottawa, ON, K1A 0Z4, Canada M Department of Physics & Astronomy, University of Victoria, PO Box 3055, Stn CSC, Victoria, BC, V8W 3P6, Canada N INAF, Osservatorio Astronomico di Roma, via Frascati 33, 00040 Monteporzio (RM), Italy O Department of Physics, University of California, Santa Barbara, Broida Hall, Mail Code 9530, Santa Barbara, CA 93106-9530, USA P Universite Paris 11, Orsay, F-91405, France
arXiv:1205.1306v1 [astro-ph.CO] 7 May 2012
B
Q
Email:
[email protected]
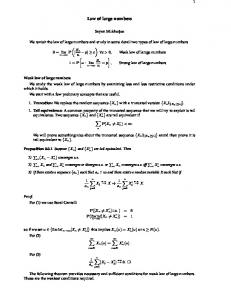
Abstract: - We use the wide–field capabilities of the 2dF fibre positioner and the AAOmega spectrograph on the Anglo-Australian Telescope (AAT) to obtain redshifts of galaxies that hosted supernovae during the first three years of the Supernova Legacy Survey (SNLS). With exposure times ranging from 10 to 60 ksec per galaxy, we were able to obtain redshifts for 400 host galaxies in two SNLS fields, thereby substantially increasing the total number of SNLS supernovae with host galaxy redshifts. The median redshift of the galaxies in our sample that hosted photometrically classified Type Ia supernovae (SNe Ia) is z ∼ 0.77, which is 25% higher than the median redshift of spectroscopically confirmed SNe Ia in the three–year sample of the SNLS. Our results demonstrate that one can use wide–field fibre–fed multi–object spectrographs on 4m telescopes to efficiently obtain redshifts for large numbers of supernova host galaxies over the large areas of sky that will be covered by future high–redshift supernova surveys, such as the Dark Energy Survey. Keywords: Cosmology: observations — supernovae: general — Galaxies: general — Galaxies: clusters: general — white dwarfs
1
2
1
Publications of the Astronomical Society of Australia
Introduction
The landmark discovery of the accelerating Universe more than a dozen years ago (Perlmutter et al. 1999; Riess et al. 1998) was made from observations of a few dozen distant Type Ia supernovae (SNe Ia). Since then, SN Ia samples have grown in size by an order of magnitude. Currently, the largest published individual sample of distant SNe Ia is the 3–year sample from the Supernova Legacy Survey (SNLS), which contains 252 SNe Ia extending out z = 1.06 (Guy et al. 2010). The Dark Energy Survey (DES), which will discover ∼4 000 distant SNe Ia (Bernstein et al. 2011), is yet another order of magnitude larger. All of the SNe Ia in the 3–year SNLS sample were spectroscopically confirmed. To confirm a SN Ia at z ∼ 0.7 from its spectral features (and to obtain its redshift) typically takes about an hour of exposure time with an efficient spectrograph on an 8–10 m class telescope. These SNe are observed one at a time, as it is, at any instant, very rare to have more than one SN Ia within one week of maximum light visible within the fields of view that are available with the current generation of spectrographs on 8–10 m class telescopes. Assuming 100% efficiency, the Dark Energy Survey will need around 4 000 hours of 8–10 m class telescope time with current instrumentation to spectroscopically confirm the 4 000 SNe Ia that they will find. Clearly, this constitutes a very large request, so alternative approaches should be investigated first. A promising yet unproven alternative is to classify SNe Ia using multi–colour lightcurves and to obtain the redshifts from host galaxies after the SNe have faded from view. The principle advantages of this alternative are that i) host galaxy redshifts can be obtained at any time, and ii) one can observe several hosts simultaneously if the number density of host galaxies is sufficiently high enough. In this paper, we describe how we used the 2dF fibre positioner and the AAOmega spectrograph on the Anglo–Australia Telescope (AAT) to obtain redshifts of galaxies that hosted supernovae in two of the four SNLS fields. A second paper reporting the results from a 3rd SNLS field (the fourth field is not visible from the AAT) and the analysis of the three fields combined will be written once observations of that field have been taken. The current paper is divided as follows. In Section 2.1, we briefly describe the characteristics of the SNLS and explain how targets from the SNLS were selected and prioritised for spectroscopy. Then, in Section 3 and Section 4, we describe the observations and outline the steps used to process the data. In the following two sections, we describe our results (Section 5) and discuss (Section 6) how our observing strategy compares to an observing strategy in which transients are observed in real time. In the final section, we summarise our main conclusions. Unless noted otherwise, we use AB magnitudes throughout this paper.
2
SNLS Host Galaxies
The SNLS consisted of a rolling search of four one– square degree fields, labeled D1 to D4, using the MegaCam camera (Boulade et al. 2003) on the Canada– France–Hawaii Telescope (CFHT)1 . During dark and grey time and over a period of of 5 to 7 consecutive lunations, the fields were imaged every 3 to 4 nights in gM , rM , iM , and zM filters. The survey ran for five years, starting in 2003 and ending in 2008. Additional details on the survey can be found in Astier et al. (2006); Sullivan et al. (2006a) and Perrett et al. (2010). During the course of the SNLS, transient events were detected, classified and prioritised in real time (Perrett et al. 2010; Sullivan et al. 2006a). The highest priority SN Ia candidates were then sent to telescopes at the Keck, ESO Paranal and Gemini Observatories for spectroscopic typing and redshifting. The spectroscopic follow–up of real–time transients are described in Howell et al. (2005), Bronder et al. (2008), Ellis et al. (2008), Balland et al. (2009), Walker et al. (2011) and Fahkouri et al. (in preparation). Likely SNe Ia were prioritised according to several criteria, such as, among others, the quality of the light curve fit, the measured stretch, peak apparent brightness and light curve phase, and the ratio of the likely peak flux of the SN Ia with respect to the flux of the host (Perrett et al. 2010). For example, SNe Ia that were likely to have a peak observer–frame i– band magnitude fainter than iAB = 24.4 were not sent for spectroscopy, since these SNe were likely to be beyond z = 0.9, are difficult to confirm spectroscopically, and generally have one well–measured colour at most. The selection criteria are not treated in isolation. For example, candidates in the magnitude range 23.8 < iAB < 24.4 were only followed if the flux of the candidate was as large as the host. Due to the vagaries of telescope scheduling and weather, not all high priority targets could be observed, and on some classically scheduled nights, lower priority targets were followed once the higher priority targets had been observed. The spectroscopically confirmed sample is about 60% complete up to z ∼ 0.6 (Perrett et al. 2010). At this redshift, the incompleteness is mostly due to the selection criteria that are applied to the lightcurve data. Completeness then falls steadily as redshift increases. By z ∼ 1, the completeness drops to 20% and then to zero by z ∼ 1.2. The most distant spectroscopically confirmed SNe Ia in the 3–year SNLS sample is at z = 1.06 (Guy et al. 2010). Therefore there are as many SNe Ia detected in the SNLS that lack spectroscopy as there are SNe Ia that were spectroscopically confirmed. Furthermore, most of the untargeted SNe Ia will be at higher redshifts. These SNe Ia are now far too faint to observe spectroscopically, so they can no longer be classified in this way; however, with full light curves, many of them can be classified photometrically (Bazin et al. 2011). Together with a precise measure of the redshift, which 1 The SNLS fields were common to the deep synoptic survey of the Canada–France–Hawaii Telescope Legacy Survey – http://www.cfht.hawaii.edu/Science/CFHLS/
3
www.publish.csiro.au/journals/pasa
can be obtained from follow–up spectroscopy of the host, these SNe Ia can be added to the Hubble diagram and used to constrain the expansion history of the Universe, provided that the light curves are of sufficient quality and only after biases specific to both the photometric selection of the SNe Ia and the spectroscopic follow–up of the hosts are modelled and correctly accounted for. Besides SNe Ia, the SNLS also contains a couple of hundred core–collapse supernovae (CC SNe) below z = 0.4. Since CC SNe were rarely followed spectroscopically, only a fraction of these (42 in the first three years of SNLS) were spectroscopically confirmed. As shown in Bazin et al. (2009), photometric classification allows one to identify CC SNe and, together with a measure of the redshift, the CC SNe rate. Precise host galaxy redshifts can reduce the uncertainty of this measurement significantly.
2.1
Target Selection
Bazin et al. (2011) reanalysed the first three years of SNLS survey and selected candidate supernovae based on the full three year light curves. Their catalogue contains 1483 candidates, of which 1233 were matched to a galaxy with a reliable photometric redshift (see Bazin et al. (2011) for details). Of these 1233 candidates, 485 were photometrically classified as SN Ia. In total, 176 of the 485 photometrically classified SN Ia were confirmed spectroscopically. None of the photometrically classified SNe Ia were confirmed to be supernovae of other types or AGNs, however, not all 485 candidates were targeted for spectroscopy during the real–time follow–up. For the follow–up spectroscopy with AAOmega, we split the catalogue of 1483 candidate supernovae into five categories and assign a priority to each category. Priority 5 — the highest priority we assign to photometrically identified SNe — goes to photometrically classified SNe Ia that lack a spectroscopic redshift. Then, in order of decreasing priority were photometrically classified CC SNe without a spectroscopic redshift, candidate supernovae of unknown type with an assigned host but without a spectroscopic redshift (most objects in this priority have a reliable photometric redshift), candidate supernovae of unknown type without an assigned host and without a redshift of any kind (photometric or spectroscopic), and finally, the lowest priority (priority 1), candidate supernovae of any kind with a spectroscopic redshift. If the identity of the host was unclear, the fibre was placed at the location of the supernova. Otherwise, it was placed on the nearest host. In addition to SN hosts, we targeted white dwarfs from Limboz et al. (2008) and from our own search of the SNLS fields, and in the 2hr field only, galaxies in X–ray selected clusters from the XMM–LSS survey (Pierre et al. 2006). Both kinds of targets are interesting for a number of reasons related to cosmology. Hot DA white dwarfs are often used as flux calibrators. If a sufficient number of hot DA white dwarfs can be found within the supernova search fields, then an alternative and perhaps more precise method of calibrating SNe
Ia fluxes would become available. These objects were given the highest priority (priority six) as we wanted to make sure that they were all allocated a fibre by the automated fibre allocation software (Miszalski et al. 2006). At the other end of the mass scale, the number density and clustering of galaxy clusters and the evolution of these properties with redshift depend on the properties of dark energy and can therefore be used to constrain it. The number of targets in each category and their priorities are listed in Table 1.
2.2
Fibre allocation
The 2dF fibre positioner positions fibres over a 2-degree diameter field. The absolute minimum separation between fibres is 3000 and is set by the rectangular shape of the magnets that hold the fibre buttons to the metallic field plate. If the separation between a given pair of supernova hosts is smaller than the minimum permitted fibre separation, then both hosts cannot be observed at the same time. The allocation of fibres to targets is then done on the basis of this requirement, the number of available fibres and target priorities (Miszalski et al. 2006). From three years of SNLS data, the number of supernovae per SNLS field is slightly larger than the number of fibres that are available with 2dF. Each SNLS field has a field-of-view of 1 sq. degree, so there is the additional constraint that the fibres need to be placed within an area that is about a factor of 3 smaller than the full field available with 2dF. It is interesting to see what fraction of the fibres were allocated to supernova hosts. A fraction that is significantly smaller than 100% is an indication of significant clustering. As an example, we compute the fraction of fibres that were assigned to supernova host galaxies for the D4 field, which has the smallest difference between the number of targets and the number of fibres. The numbers listed in Table 1 cannot be used to compute this fraction directly because multiple configurations were used for the D4 field. Instead we simply examine the fraction of fibres that were assigned in each configuration individually and average the results. For the D4 field, there were 362 supernovae of all priorities. Out of 339 fibres available for plate one and 332 fibres available for plate zero2 , respectively, 332 and 325 of them were allocated to supernova hosts. The remaining fibres were allocated to white dwarfs, which had higher priority than the supernova hosts. The allocation rate of fibres to supernova hosts was above 95% and would have been 100% if only the supernova hosts were targeted. Interestingly, Carlberg et al. (2008) finds that SNe Ia are clustered more strongly than the average galaxy. A similar study for CC SNe has not been done. While there certainly were cases where two host galaxies could not be observed simultaneously because they were too close to each other, the supernova catalogue was large 2 At the time of the observations, 357 fibres were available on plate 0 and 364 fibres were available on plate 1. After subtracting 25 fibres that were used to measure the sky background approximately 330 fibres were used to select targets in the SNLS fields.
4
Publications of the Astronomical Society of Australia
enough to ensure that all fibres could be used efficiently. The field covered by the DES camera (Flaugher et al. 2010) is three times larger than MegaCam on CFHT, the camera used by SNLS, and is similar to the field covered by 2dF. If the number of supernova discoveries per season and per unit area is similar for DES and SNLS, then it would take only one year of searching with the DES camera to find as many supernova per pointing as there are 2dF fibres. These supernova will be spread over the entire 2dF field, so the chance of fibre collisions will be smaller than it was for the follow–up of SNLS host galaxies.
SNLS fields that were free of objects. We used version T0006 of the stacks produced by TERAPIX3 to select these regions. These stacks reach a limiting magnitude of rAB ∼ 26, which is ∼ 4 magnitudes fainter than the median magnitude of galaxies targeted with AAOmega.
3
Observations
Fibres from 2dF feed AAOmega (Smith et al. 2004), which is a bench–mounted double–beam spectrograph that is located in one of the Coud´e rooms at the base of the AAT. The red and blue arms of the spectrograph are split by a dichroic. In the blue arm, we used the 580V grating: in the red arm, we used the 385R grating. The combined spectra cover the wavelength interval from 3300 ˚ A to 8840 ˚ A at spectral resolution of about 1400. The data were taken during clear conditions. The image quality, as measured by the 2df focal plane imager, which can be positioned in front of the observing plate but behind the 2df corrector, varied between 1.00 1 and 1.00 7. Each fibre has a diameter of approximately 2.00 1. Distortions from the corrector mean that fibres near the field edge subtend a slightly larger region than fibres in the centre. The data were collected over four consecutive nights starting on August 24th, 2011. Each integration lasted 2500 seconds and a given configuration was observed between two to four times before switching to a new configuration. Immediately after a new configuration was tumbled into place, a fibre flat–field and a fibre arc were obtained. Each SNLS field was configured for plate 0 and again for plate 1. Since the number of fibres for each plate are different, not all objects observed in plate 0 were also observed in plate 1 and visa–versa. Half way through the run, we processed the data that had been taken for the D4 field by that time, allowing us to re–prioritise objects that could be assigned a redshift from clearly identified spectral features. All data were taken with the telescope pointing above an altitude of 40 degrees. The total integration times for the D1 and D4 fields were 32,500 and 60,000 seconds, respectively. The time spent on any given target, however, might have been less than this as it may have not have been allocated a fibre in all the configurations. Less time was spent on the D1 field because of time lost to cloud during the 2nd half of the 3rd night and because of the smaller number of hours the D1 field was at a suitable hour angle. At the end of each night, five 2500 second dark frames were taken. In order to derive an estimate of the sky background, which is used in the processing of the data, 25 fibres were allocated to observe regions within the
4
Data Reduction
We used version 4.66 of the 2dF data reduction pipeline4 to process the data taken with AAOmega. The steps for processing data from the red and blue arms are similar although not identical. For both arms we define the spectral trace of each fibre using the fibre flat fields, then extract spectra from the science frames, arcs and flat fields, wavelength calibrate the extracted spectra from both the science data and the fibre flats, flat field the extracted spectra using the spectra from the fibre flats, and subtract the sky using the spectra extracted form the sky fibres. For the blue arm we first subtract a dark frame from the data to reduce the impact of the bad columns in the blue detector, we remove scattered light and we do the wavelength calibration with the arc. For the red arm, we remove residuals from night sky lines using a PCA model for the residuals and we use night sky lines for the wavelength calibration. The data from the different configurations are then coadded. Not all configurations were identical. For example, some targets were observed in one configuration but not another, and some targets were observed with different fibres in different configurations. The pipeline keeps track of the objects that each fibre targets, so coadding the spectra on an object–by–object basis is straightforward. At this stage, we use our own scripts, coded in Python and IRAF5 , to coadd the spectra, since given the long exposure times and the large number of exposures we needed better control of selecting which spectra went into the final sum than what is currently possible with the pipeline. The final step is to splice the blue and red halves of each spectrum. The redshifts are measured with Jan 08 version of RUNZ (Drinkwater et al. 2010). The most commonly identified features in the spectra are emission lines from the [OII] λλ 3726,3728 and the [OIII] λλ 4959,5007 doublets, emission lines from H–alpha and H–beta, and absorption lines from higher order Balmer transitions and Ca II H and K. In a few spectra, we can identify lines such as [NeIII] λ 3869, [NII] λ 6549, [NII] λ 6583 and the [SII] λλ 6716,6730 doublet. Spectra are assigned a redshift, a redshift uncertainty and a quality flag, following the scheme outlined in Drinkwater et al. (2010) and listed in Table 2. The flag provides additional information about each spectrum, such as the 3 http://terapix.iap.fr/ 4 http://www.aao.gov.au/AAO/2df/aaomega/ 5 IRAF is distributed by the National Optical Astronomy Observatories which are operated by the Association of Universities for Research in Astronomy, Inc., under the cooperative agreement with the National Science Foundation
5
www.publish.csiro.au/journals/pasa
level of assessment that the redshift is correct. The reliability of these quality flags is quantified in (Drinkwater et al. 2010), albeit in the context of their sample of highly star-forming emission line galaxies. Redshifts that have the flag set to 4 or 5 are considered to be secure, since the redshifts are obtained from at least 2 clearly identified features. Objects with the flag set to 3 have less secure redshifts. Usually, these spectra have one clear emission line, which we assume to be [OII]. Only spectra with flags 3 or higher are considered in this paper. In the following sections, we label objects that have a quality flag of 4 of 5 as objects with secure redshifts and label objects that have a quality flag of 3 as objects with probable redshifts.
Hosts targeted with AAOmega Host redshifts from AAOmega Secure host redshifts from AAOmega
100
80
Median magnitudes: 23.18, 22.33 and 21.93
60
40
5
Results 20
5.1
Redshift completeness 0
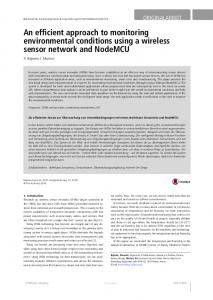
The percentage of targets for which we obtained a redshift with AAOmega (the completeness fraction) is generally highest in the D4 field. The amount of time observing the D4 field was almost a factor of two longer than the time used to observe the D1 field, so the higher percentage is a reflection of the longer integration time. The completeness fraction behaves similarly for the two fields. It is highest for photometrically classified CC SNe that did not have spectroscopic redshifts and lowest for supernovae that had neither a spectroscopic redshift nor a photometric one. Hence, in what follows, we pool the results of the two fields together when analysing completeness as a function of magnitude, redshift and target type. Histograms showing the number of galaxies with a redshift from AAOmega are shown in Figure 1. Supernovae for which the r–band magnitude of the host was unavailable are not shown. Not surprisingly, the median redshift of galaxies with a probable redshift (the quality flag set to 3) from AAOmega is higher than the median redshift of galaxies that have a secure one. Usually, the [OII] doublet is the only line that is detected in galaxies with probable redshifts. Other lines, such as the [OIII] doublet, are not detected because either they have been redshifted beyond the red end of the spectral coverage (occurs by z ∼ 0.76) or, less often, they are too weak. At the resolution provided by AAOmega, the [OII] doublet is only just resolved, which can sometimes help in making a redshift marked as possible (quality flag 2) to one that is probable (quality flag 3). In Figure 2, we split the magnitude and redshift histograms according to the photometric classification (i.e. SNe Ia, SNe CC or other (see Bazin et al. 2011, for details)). There are a couple of things to note in these histograms. In particular, the middle histogram in the lower plot shows that about 90% of galaxies that hosted a SNe Ia at z ∼ 0.5 have either a secure redshift or a probable one. By z ∼ 1, this drops to about 50%, of which about half are secure. Not shown in this lower panel are supernovae that did not have either a spec-
16
18
20
22 r (AB)
24
26
28
30
Hosts with a redshift (spec. or photo.) Host redshifts from AAOmega Secure host redshifts from AAOmega
60 50
Median redshifts 0.70, 0.62 and 0.56
40 30 20 10 0
0.0
0.2
0.4
0.6
0.8 redshift
1.0
1.2
1.4
1.6
Figure 1: Histograms of the number of objects plotted as a function of magnitude (above) and redshift (below). The blue, green and tan histograms represent all objects targeted with AAOmega, all objects with secure AAOmega redshifts (quality flags 4 or 5), and all objects with either a secure AAOmega redshift or a probable one (quality flags 3, 4 or 5). If the r-band magnitude of the host was unavailable, then the object was not plotted in the upper plot. If a spectroscopic redshift is not available for the lower plot, we use the photometric one. If neither a spectroscopic nor a photometric redshift were available, then the object was not plotted in the lower panel. The median magnitudes and redshifts of objects in the blue, tan and green histograms annotate each figure.
6
Publications of the Astronomical Society of Australia
12 10 8 6 4 2 0 40 35 30 25 20 15 10 5 0 60 50 40 30 20 10 0
CC - 20.71, 20.25, 20.25
16
18
20
22
24
26
28
30
24
26
28
30
24
26
28
30
1.4
1.6
SNe Ia - 23.07, 22.56, 22.15
16
18
20
22
Unknown - 23.66, 22.40, 21.99
16
18
20
22 r (AB)
20
CC - 0.30, 0.29, 0.29
15 10 5 0 30 25 20 15 10 5 0 35 30 25 20 15 10 5 0
0.0
0.2
0.4
0.6
0.8
1.0
1.2
SNe Ia - 0.84, 0.77, 0.68
0.0
0.2
0.4
0.6
0.8
1.0
1.2
1.4
1.6
Unknown - 0.67, 0.60, 0.56
0.0
0.2
0.4
0.6
0.8 Redshift
1.0
1.2
1.4
1.6
Figure 2: As for Figure 1, but split according to the photometric classification troscopic redshift (from any source) or a photometric one. These make up about 15% of all supernovae that were targeted with AAOmega. The median redshift of objects photometrically classified as CC SNe is lower than the median redshifts of the other two classifications. Primarily, this is driven by the absolute magnitude of CC SNe, which are, on average, about 2 mag fainter than SNe Ia. The median apparent magnitude of galaxies that hosted CC SNe is more that one magnitude brighter, leading to a relatively high completeness.
5.2
we have assigned to each of the objects are listed in Table 3. Limboz et al. (2008) also searched the SNLS fields for white dwarfs. The criteria they use to select white dwarfs differ from ours, so their catalogue and ours are not identical. They use different cuts in colour– colour space, different magnitude limits and did not use proper motions. However, nearly all of our candidates were also found by them. The candidates in common are marked with the letter ’a’ in Table 3. Since none of the Limboz et al. (2008) candidates in the D1 and D4 fields had been spectroscopically confirmed, we assigned fibres to all but one of objects that were in their catalogue but not in ours. These objects are marked in Table 3 with the letter ’b’. Not all white dwarf candidates were targeted for spectroscopy. We avoided the brightest one from Limboz et al. (2008) because of concerns that cross talk between fibres would contaminate neighbouring spectra. Out of 14 candidates, 12 are white dwarfs and 2 are AGN. Of the 12 white dwarfs, we classify 9 as DA white dwarfs, two as DC white dwarfs and one as a possible magnetic white dwarf (DAH). The two AGNs were both selected from their colours and were not in the sample that used proper motions in the selection criteria. At high galactic latitudes, AGN start to outnumber white dwarfs by g = 17 (Fan 1999), so they are an important source of contamination. In Section 6.3, we discuss how DA white dwarfs might be used as an alternative means of calibrating SN fluxes.
5.3
Cluster galaxies
For the D1 field, we assembled a catalog of 13 galaxies in 3 X–ray selected clusters from the XMM–LSS survey (Adami et al. 2011), which covers the entire D1 field. Out of 13 galaxies, 7 were assigned fibres and 6 redshifts were obtained. The results are summarised in Table 4. Both XLSS J022404.1-041330 and XLSS J022303.3-043621 — at z = 1.05 and z = 1.22, respectively — had been confirmed with data from other facilities (Adami et al. 2011). Our observations reconfirm the redshift of XLSS J022404.1-041330 but failed to do so for XLSS J022303.3-043621. Prior to our observations, only one galaxy redshift had been measured for XLSS J022357.4-043516 (Adami et al. 2011). Our observations add three more redshifts to this cluster.
White dwarfs
In addition to allocating fibres to supernova hosts, we also allocated fibres to candidate white dwarfs and to potential cluster galaxies. We defer the discussion on the follow–up of cluster galaxies until the next section: here we discuss the selection of white dwarfs. White dwarfs can be easily identified in SNLS data, using either their location in colour–colour plots or their relatively high proper motions. Both the D1 and D4 fields were searched for white dwarfs using both techniques. A listing of the candidates, notes on how they were found and the spectral classification that
6 6.1
Discussion A comparison with the real time follow–up
It is instructive to compare the results we obtain here with the results that we obtained with the VLT during the real time follow–up of live candidates. During the final two years of the spectroscopic follow–up of candidates with the VLT, the MOS modes of FORS1 and FORS2 were used to observe both live candidates and
7
www.publish.csiro.au/journals/pasa
the host galaxies of other transients that were discovered in earlier years. By the end of the SNLS survey, there were typically three to four host galaxies visible in the FORS 70 by 70 FoV.
FORS1+2 median redshift 0.59 AAOmega median redshift 0.62
50 40 30
The MOS modes of FORS1 and FORS2 consists of 38 movable blades that can be used to make 19 slits anywhere in the FORS focal plane. While there is a mode that allows pre–cut masks to be inserted into the FORS2 focal plane (called the MXU mode), this mode was not available for Target–of–Opportunity requests.
20 10 0 0.0
0.2
0.4
100
0.6
0.8 redshift
1.0
1.2
1.4
1.6
FORS1+2 median R mag 22.06 AAOmega median R mag 22.23
80 60
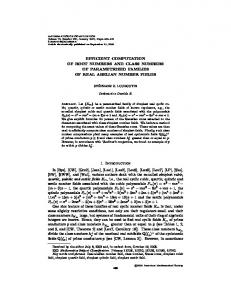
A number of targets were observed with both the VLT and AAOmega. Out of the 83 targets that were observed with both instruments, 63 have a redshift from both AAOmega and the VLT. The redshifts of all objects agree to within 0.002. The uncertainties in the redshifts from FORS1 and FORS2 are around 0.001 and are generally larger than the uncertainties in the redshifts from AAOmega. In Figure 3, we compare the magnitude and redshift distributions of objects that were observed with FORS1 and FORS2 with those that were observed with AAOmega. Excluding any sort of renormalisation to account for differences in exposure times, observing efficiency, and target selection, the redshift distributions are broadly similar. The redshifts from FORS1 and FORS2 came from 66 separate MOS setups. The exposure time for a single setup was typically one hour. Summed over all setups, the total amount of time spent on the D1 and D4 fields with FORS1 and FORS2 was 240,000 seconds. The integration times that were used with AAOmega for the D1 and D4 fields were 32,500 and 60,000 seconds, respectively. At face value, it would seem that AAOmega — a multi-object spectrograph on a 4 m class telescope — has resulted in many more redshifts than FORS1 and FORS2 — both multi-object spectrographs on 8 m class telescopes. While this is true, the difference is not as extreme as that suggested by inspecting Figure 3, since the number of targets available for the AAOmega follow–up was about a factor of two larger than the number available for FORS1 and FORS2. Nevertheless, it is difficult to imagine that the efficiency with FORS could have been increased by more than a factor of three if we were to repeat the experiment with FORS2 with the MXU mode and with the catalogue that was used in the follow–up with AAOmega. The main reason for the difference comes from the difference in the FoV between AAOmega and FORS2. With AAOmega, we can cover the entire 1 sq. degree MegaCam field in one shot, which is 60 times the area covered by FORS2. This more than compensates for differences in telescope aperture and image quality. While AAOmega is efficient in obtaining large numbers of host galaxy redshifts, it is not suitable for confirming SN types — which was, together with obtaining redshifts, the main aim of the observations with the VLT — over the redshift range that was probed with FORS1 and FORS2.
40 20 0
16
18
20
r (AB)
22
24
26
Figure 3: A comparison of the host redshift and magnitude distributions obtained with FORS1 and FORS2 with the host and magnitude distributions obtained with AAOmega.
6.2
Redshifts: photometry vs. spectroscopy
Photometric redshifts are often used as an alternative to spectroscopic redshifts when samples become large or when the precision and accuracy provided by photometric redshifts are sufficient for the tasks at hand. They also allow redshifts to be obtained for sources that are too faint for spectroscopy. For some future transient surveys, such as the transient survey of the Large Synoptic Survey Telescope (LSST), photometrically measured redshifts of the hosts of the transients will be the only realistic option for obtaining redshifts for most of the transients. Photometric redshifts are both less precise and less accurate (in the sense that they are biased) than spectroscopic redshifts. Up to z = 1, the precision of photometric redshifts, as measured by the normalised median absolute deviation – h|∆z|/(1 + z)i, (Ilbert et al. 2006) – is typically around 0.03. This can be compared to the level of uncertainty that is typical for redshifts that are measured spectroscopically, which is generally better than 0.001. The lower precision appears amenable to solution by simply increasing the number of SNe Ia in the sample. The issue of accuracy is more critical, since any change in the accuracy with redshift might be interpreted as evolution in the dark energy equation–of– state parameter. In Figure 4, we compare the photometric redshifts (from Ilbert et al. (2006)) assigned to our targets with the spectroscopic redshifts measured in this paper with AAOmega. Objects with secure and probable redshifts are represented by the green and tan symbols, respectively. To estimate the accuracy of the photometric redshifts, we compute the median difference between spectroscopic and photometric measures of the redshift in two broad redshift bins centered at z = 0.4 and z = 0.9
8
Publications of the Astronomical Society of Australia
6.3
DA white dwarfs as in–situ flux calibrators
Systematic errors now contribute as much to the uncertainty in the dark energy equation–of–state parameter as statistical errors (Conley et al. 2011; Sullivan et al. 2011; Suzuki et al. 2011). The largest systematic error, by far, comes from calibration (Conley et al. 2011; Sullivan et al. 2011), which in simple terms is the process of converting the observed counts in some filter to a relative flux. For the purpose of constraining cosmology, it is not necessary to know the absolute flux. DA (pure–hydrogen) white dwarfs are commonly
0.4
0.2
∆z
and plot them as blue circles in Figure 4 . The values in these two bins are 0.004 and 0.007, respectively, with uncertainties, which are estimated via bootstrap resampling, of 0.002 for both bins. In the standard ΛCDM cosmology, an offset of 0.007 in redshift at z = 0.9 corresponds to a change of 1% in luminosity, which changes the best fit value for the dark energy equation–of–state parameter by about 4%. In SN Ia samples that are currently used for cosmology, the systematic error in the dark energy equation–of–state parameter is around 6% (Conley et al. 2011; Sullivan et al. 2011). Samples that use photometric redshifts for host galaxies instead of spectroscopic redshifts will need to manage a source of systematic error that is roughly similar in magnitude to the systematic error in current samples. In principle, one could remove the offset in the photometric redshifts using the spectroscopic redshifts to work out the size of the offset, as we have done here. With about 160 redshifts (the number of redshifts that go into computing the location of the blue point at z = 0.9 in Figure 4), the uncertainty in the correction is 0.002, which at z = 0.9 corresponds to a 1% error in the dark energy equation–of–state parameter. With significantly more redshifts, the uncertainty could be made smaller still. An interesting alternative to using redshifts of the host galaxies to determine the size of the offset, which we do here, is to use redshifts of general field galaxies, since these are more numerous. However, there may be serious limitations to this approach. At some level, the offset must depend on galaxy type. For example, the offset for galaxies with strong emission lines will be different for galaxies that lack emission lines. So estimates of the size of the offset may be erroneous if the population of galaxies that hosted SNe Ia differs from population of galaxies that is used to determine the offset. Photometric redshifts are also prone to catastrophic failures, which lead to non-Gaussian tails in the normalised redshift deviation: ∆z/(1 + z). A commonly used definition for catastrophic failures is when the photometric redshift differs from the spectroscopic one by more than 0.15(1 + z) (Ilbert et al. 2006). We can use our redshifts from AAOmega to make an independent measurement of the rate of catastrophic failures. Considering secure and probable redshifts together, the rate is 2.9%, which is similar to the 3.7% rate reported in Ilbert et al. (2006).
0.0
−0.2
Secure redshifts Prob redshifts
−0.4 0.0
0.2
0.4
0.6 0.8 1.0 Spectroscopic redshift
1.2
1.4
Figure 4: The deviation ∆z between spectroscopic and photometric measures of redshift plotted against the spectroscopic redshift for objects with secure and probable spectroscopic redshifts (the green and tan circles respectively) . The median of the difference — in bins of width 0.5 in redshift, centered at z = 0.4 and z = 0.9 — are plotted as the large blue circles. The horizontal black line represents equality between the photometric and spectroscopic redshifts . The red lines represents the boundary beyond which the photometric redshift differs from the spectroscopic one by more than 0.15(1 + z).
www.publish.csiro.au/journals/pasa
used as flux calibrators. For example, the primary spectrophotometric standards of the Hubble Space Telescope (HST) are three DA white dwarfs (Bohlin 2000). The absolute precision of the spectral energy distributions (SED) of these stars is around 1% in the optical and near–IR (Bohlin 2007). The precision of DA white dwarf models, which use spectral measurements of the effective gravity and temperature, is thought to be even greater (Allende Prieto et al. 2009). The idea of extending the HST network of primary standards to more DA white dwarfs is explored in Allende Prieto et al. (2009). From an initial sample of 598 objects from the Sloan Digital Sky Survey (SDSS), they build a sample of 57 suitable DA white dwarfs (where suitable means a sufficiently small χ2 in the model fit to the SED, and model parameters 21000 < Tef f < 85000 and 7.1 < log g < 9) that are then analysed in more detail. This sample is then reduced to 9 after taking into account all sources of error, including extinction, which becomes important for more distant objects. In the two one–square–degree SNLS fields that we observed, we found 4 DA white dwarfs per field down to gAB ∼ 20 (see Section 5.2). For DES (Bernstein et al. 2011), which has a field–of–view that is three times larger, there will be ∼ 12 DA white dwarfs to this magnitude limit. For SkyMapper (Keller et al. 2007), which has an even larger field of view, there will be around 25 DA white dwarfs in regions that have a similar galactic latitude to the DES and SNLS fields, and considerably more at low galactic latitudes. While it is encouraging that there are a sufficient number of DA white dwarfs for one to consider the possibility of using DA white dwarfs as in–situ calibrators, the key issue is whether or not the space density of suitable white dwarfs is sufficient. Scaling from the numbers reported in Allende Prieto et al. (2009) would suggest that the answer to this is question is no. However, the needs for supernova cosmology may be less stringent, since only the relative calibration of the SED as a function of wavelength and the relative normalisation of the SEDs matters. Furthermore one can average the results over the white dwarfs that are within the field.
6.4
Selection biases
The SNLS three–year constraints on the dark energy equation–of–state parameter used SNe Ia that were discovered in real time and subsequently confirmed to be SNe Ia with spectroscopy of the supernovae near maximum light. For simplicity, we will refer to these SNe Ia as the SNLS three–year sample. The–real time discovery of candidates and the assignment of priorities for spectroscopic follow–up are described in (Howell et al. 2005; Sullivan et al. 2006a; Perrett et al. 2010). The criteria used to select and classify candidates in Bazin et al. (2011) differs from those used for the SNLS three–year sample . Furthermore, the spectroscopy undertaken with AAOmega is not used to confirm the supernova type, as was done for SNe Ia in the SNLS three–year sample, but to obtain the host redshift. Hence biases incurred in using a SN Ia sample that
9
use photometrically classified SNe Ia with host galaxy redshifts (we will refer to this sample as the host–z sample) to constrain the dark energy equation–of–state will differ from the biases that affect the SNLS three– year sample. Perrett et al. (2010) make a detailed analysis of the biases incurred in the SNLS three–year sample due to incomplete coverage of the underlying SNe Ia population. In this section, our aim is not to extend this work to the host–z sample but to describe how the biases are likely to differ between the two samples. Nevertheless, such a study will be necessary if the host–z sample is to be used to constrain cosmological parameters. Selection biases are incurred at three stages: the initial photometric selection of candidates, the spectroscopic follow–up, and the application of selection cuts to the fully assembled and integrated data set. We briefly discuss the biases associated to the photometric selection of candidates first, then discuss the biases associated to the spectroscopic follow–up in more detail, and end with a comment on the impact of selection cuts. While the photometric selection of SNe Ia in the two samples differ, the nature of the selection bias is the same for both samples. Supernova are not perfect standard candles, hence magnitude limited samples (as both these samples are) will tend to select the brightest events as the magnitude limit of the survey is approached (Malmquist bias). Once assumptions are made about the properties of the parent SNe Ia population and how these properties evolve with redshift, the bias can be computed with Monte–Carlo simulations (Perrett et al. 2010). At a given redshift, the photometric sample of Bazin et al. (2011) is less biased than the SNLS three–year sample, because it has a fainter magnitude limit. The biggest difference between the two samples lies with the spectroscopic follow–up. For the SNLS three– year sample, the spectroscopic follow–up can be broken into three steps: i) the real–time sample is filtered for SNe Ia that are deemed to be suitable for spectroscopy, ii) a request for spectroscopy is made and a spectrum is taken, and iii) the supernova is identified. The bias incurred from the last step is probably the most difficult to model. One well known difficulty in positively identifying SNe Ia spectroscopically is that SNe Ia in bright hosts are more difficult to classify than SNe Ia in faint hosts. The difficulty increases with redshift. The effect is similar to that imposed by the percentage increase cut, which is used in the SNLS three–year sample. Imposing this cut at the stage of selecting which candidates go on to be observed spectroscopically makes computing the bias more tractable, as part of the bias can be modelled using the imaging data. The bias that results from the spectroscopic follow– up of host galaxies in the host–z sample are different. It is generally a lot easier to obtain the redshift of a galaxy if it is bright, if it is forming stars or if it recently did so (such post–starburst galaxies may lack strong emission lines but contain clear Balmer absorption lines due to the presence of large numbers of A– type stars). If the properties of SNe Ia were indepen-
10
Publications of the Astronomical Society of Australia
dent of the properties of their hosts, then it would not matter if it was easier to get redshifts for these galaxies. However, there is ample evidence that the properties of SNe Ia do depend on the properties of their hosts. Brighter SNe Ia with broader light curves are preferentially found in star forming galaxies (Hamuy et al. 1995, 2000; Sullivan et al. 2006b), and brighter SNe Ia also tend to live in more massive (and therefore brighter) galaxies (see Sullivan et al. 2010, for example). This selection bias might be large enough to substantially affect the accuracy of future experiments, such as the DES SN survey. However, with a sufficiently large enough sample of host galaxies, it should be possible to model the probability of getting a host redshift given the photometric properties of the host. There is also the possibility that the wrong host galaxy is identified. Fortunately, this seems to be relatively rare. Dawson et al. (2009) show an example where the redshift of what appears to be the likely host disagrees with that of the supernova. Another interesting example is SNLS-P04D1ay from this paper. SNLS-P04D1ay was observed with FORS2 and AAOmega. Two sets of lines at different redshifts (z = 0.446 and z = 0.905) could be identified in the spectra from both instruments. This is a clear case of two galaxies along the same line of sight. A potential way to eliminate some of these events would be to exclude events in which the photometric redshift from either the supernova or the host disagrees with the spectroscopic one by an amount that does not exclude too many supernovae that have been correctly associated to their hosts. Finally, before the fully assembled SNe Ia data– set is used for cosmology – or for other studies, such as supernova rates – selection cuts for quality are applied. Usually, this means that for every supernova there needs to be a certain number of observations with a given signal–to–noise ratio in a certain number of filters both before and after maximum light. For the SNLS three–year sample, the selection cuts reduce the number of SNe used for cosmology from 279 to 242 (Conley et al. 2011). Similar selection cuts are applied to the host–z sample; however, these cuts usually occur during the initial selection.
of the 2dF field–of–view. The median redshift of photometrically classified SNe Ia in our sample is z ∼ 0.77, which is higher than the median redshift of SNe Ia in the SNLS 3–year SNe Ia sample (z = 0.61) and higher than the expected median redshift of SNe Ia in the upcoming DES supernova survey. The DES supernova search will discover around 4 000 SNe Ia in the redshift range 0.2 < z < 1.2 over a period of approximately 5 years (Bernstein et al. 2011). The number of discoveries is an order of magnitude larger than the number of SNe Ia found in either the SDSS supernova survey or SNLS. Spread over 10 fields, this amounts to 400 SNe Ia per field. After five years of operation, the number of SNe Ia per DES supernova field will be similar to the number of fibres in 2dF. Obtaining the redshifts of galaxies that hosted photometrically classified SNe with a multi–object fibre fed facility, such AAOmega on the AAT, is an efficient alternative to obtaining a spectrum of every supernova, one at a time, while it is bright enough to do so. However, before photometrically classified SN Ia samples can be used to constrain cosmology the biases in them need to be examined with the level of rigour that is currently done for spectroscopically confirmed samples.
7
The redshift catalogue is presented in Table 5. Only galaxies that have a redshift quality flag of 3 or higher are listed. The supernovae that correspond to these galaxies are given names that follow the convention SNLS-PyyDnxx. SNLS-P is the prefix indicating that the supernova was found by Bazin et al. (2011), yy marks the year during which it occurred, Dn marks the SNLS field in which it occurred (e.g. D1 or D4), and xx starts off as aa for the first supernova in a given year and field and increments as aa, ab, ..., az, ba, ..., etc. for new supernova. If the supernova matches an object in the real-time database (RTD), the RTD name is also given. Redshift uncertainties are generally less than 0.001. The coordinates refer to the location where the fibre was placed. In most cases, this corresponds to the supernova host. In cases where there was no
Summary and Conclusions
Using the 2dF fibre positioner and the AAOmega spectrograph on the AAT, we observed 698 galaxies in two SNLS fields that hosted supernovae during the first three years of the SNLS. With integrations varying from 10 to 60 ksec per object, we obtained redshifts for 400 of them. The redshifts cover a very broad range, from z = 0.03 to z = 1.3. The percentage of fibres allocated to host galaxies was very high. Even though the number of supernova hosts outnumbered the number of fibres by as little as 10%, we were able to allocate almost 100% of the fibres that were free to observe supernova hosts. This was achieved with the additional restriction that all the hosts were located in the central one square degree
Acknowledgments The authors thank the XMM–LSS collaboration, in particular Nicolas Cleric and Marguerite Pierre, for providing the coordinates of galaxies in three X–ray selected galaxy clusters in the D1 field. Chris Lidman acknowledges the support from the Australian Research Council (ARC) Future Fellowship Grant (FT0992259) and the excellent support provided by the staff at the Australian Astronomical Observatory. The Centre for All–sky Astrophysics (CAASTRO) is an Australian Research Council Centre of Excellence, funded by grant CE11E0090. Mark Sullivan acknowledges the support of the Royal Society.
Appendix A1: Redshift Catalogue
www.publish.csiro.au/journals/pasa
11
clear host, the fibre was placed at the location of the supernova.
Guy, J., Sullivan, M., Conley, A., et al. 2010, A&A, 523, A7+
References
Hamuy, M., Phillips, M. M., Maza, J., et al. 1995, AJ, 109, 1
Adami, C., Mazure, A., Pierre, M., et al. 2011, A&A, 526, A18
Hamuy, M., Trager, S. C., Pinto, P. A., et al. 2000, AJ, 120, 1479
Allende Prieto, C., Hubeny, I., & Smith, J. A. 2009, MNRAS, 396, 759
Howell, D. A., Sullivan, M., Perrett, K., et al. 2005, ApJ, 634, 1190
Astier, P., Guy, J., Regnault, N., et al. 2006, A&A, 447, 31 Balland, C., Baumont, S., Basa, S., et al. 2009, A&A, 507, 85 Bazin, G., Palanque-Delabrouille, N., Rich, J., et al. 2009, A&A, 499, 653 Bazin, G., Ruhlmann-Kleider, V., PalanqueDelabrouille, N., et al. 2011, A&A, 534, A43+ Bernstein, J. P., Kessler, R., Kuhlmann, S., et al. 2011, ArXiv e-prints
Ilbert, O., Arnouts, S., McCracken, H. J., et al. 2006, A&A, 457, 841 Keller, S. C., Schmidt, B. P., Bessell, M. S., et al. 2007, PASA, 24, 1 Limboz, F., Karata¸s, Y., Kilic, M., Benoist, C., & Ali¸s, S. 2008, MNRAS, 383, 957 Miszalski, B., Shortridge, K., Saunders, W., Parker, Q. A., & Croom, S. M. 2006, MNRAS, 371, 1537 Perlmutter, S., Aldering, G., Goldhaber, G., et al. 1999, ApJ, 517, 565
Bohlin, R. C. 2000, AJ, 120, 437 Bohlin, R. C. 2007, in Astronomical Society of the Pacific Conference Series, Vol. 364, The Future of Photometric, Spectrophotometric and Polarimetric Standardization, ed. C. Sterken, 315 Boulade, O., Charlot, X., Abbon, P., et al. 2003, in Society of Photo-Optical Instrumentation Engineers (SPIE) Conference Series, Vol. 4841, Society of Photo-Optical Instrumentation Engineers (SPIE) Conference Series, ed. M. Iye & A. F. M. Moorwood, 72–81 Bronder, T. J., Hook, I. M., Astier, P., et al. 2008, A&A, 477, 717 Carlberg, R. G., Sullivan, M., Le Borgne, D., et al. 2008, ApJ, 682, L25 Conley, A., Guy, J., Sullivan, M., et al. 2011, ApJS, 192, 1 Dawson, K. S., Aldering, G., Amanullah, R., et al. 2009, AJ, 138, 1271 Drinkwater, M. J., Jurek, R. J., Blake, C., et al. 2010, MNRAS, 401, 1429 Ellis, R. S., Sullivan, M., Nugent, P. E., et al. 2008, ApJ, 674, 51 Fan, X. 1999, AJ, 117, 2528 Flaugher, B. L., Abbott, T. M. C., Annis, J., et al. 2010, in Society of Photo-Optical Instrumentation Engineers (SPIE) Conference Series, Vol. 7735, Society of Photo-Optical Instrumentation Engineers (SPIE) Conference Series
Perrett, K., Balam, D., Sullivan, M., et al. 2010, AJ, 140, 518 Pierre, M., Pacaud, F., Duc, P.-A., et al. 2006, MNRAS, 372, 591 Pierre, M., Chiappetti, L., Pacaud, F., et al. 2007, MNRAS, 382, 279 Riess, A. G., Filippenko, A. V., Challis, P., et al. 1998, AJ, 116, 1009 Smith, G. A., Saunders, W., Bridges, T., et al. 2004, in Society of Photo-Optical Instrumentation Engineers (SPIE) Conference Series, Vol. 5492, Society of Photo-Optical Instrumentation Engineers (SPIE) Conference Series, ed. A. F. M. Moorwood & M. Iye, 410–420 Sullivan, M., Howell, D. A., Perrett, K., et al. 2006a, AJ, 131, 960 Sullivan, M., Le Borgne, D., Pritchet, C. J., et al. 2006b, ApJ, 648, 868 Sullivan, M., Conley, A., Howell, D. A., et al. 2010, MNRAS, 406, 782 Sullivan, M., Guy, J., Conley, A., et al. 2011, ApJ, 737, 102 Suzuki, N., Rubin, D., Lidman, C., et al. 2011, ArXiv e-prints Walker, E. S., Hook, I. M., Sullivan, M., et al. 2011, MNRAS, 410, 1262
12
Publications of the Astronomical Society of Australia
Table 1: Target selection summary a
Field
Target Type
Priority
D1 D1 D1 D1 D1 D1 D1
White dwarfs SNe Ia without zs CC without zs SNe with a host but no zs SNe without hosts and z SNe with zs Cluster galaxies
6 5 4 3 2 1 1–5
D4 D4 D4 D4 D4 D4
White dwarfs SNe Ia without zs CC without zs SNe with a host but no zs SNe without hosts and z SNe with zs
D1 & D4
All SNe
b
Number of potential targets 7 70 18 218 21 117 13
Number targeted 7 69 17 201 18 49 7
Completeness fractionc ... 45 94 52 6 53 54
6 5 4 3 2 1
7 65 11 129 32 125
7 64 10 125 30 115
... 77 60 60 13 76
1–5
806
698
57
a
zs represents the spectroscopic redshift: z is a redshift of any kind, i.e. spectroscopic or photometric. The priority goes from 6 (highest) to 1 (lowest). c The completeness fraction is the number of objects with a redshift quality flag of 3,4 or 5 divided by the number of objects that were targeted with AAOmega. b
Table 2: Description of redshift flags Redshift Flag 0 1 2 3 4 5 6
Description Not targeted with AAOmega Flawed spectrum Poor spectrum Possible redshift Probable redshift Secure redshift Secure redshift. High quality spectrum, more than 3 features clearly visible Not extragalactic
13
www.publish.csiro.au/journals/pasa
02 02 02 02
25 24 27 25
Table 3: RA DEC (J2000) 11.64 -04 56 05.27 -04 22 46.39 -04 21 58.19 -04 02
02 24 23.76 02 25 12.69 02 27 34.20
-04 13 18.7b -04 38 51.3b -04 22 28.6b
19.33 21.14 20.41
Colours only Colours only Colours only
DA DA AGN z = 1.14
22 22 22 22 22 22
-18 -17 -17 -17 -17 -17
42.6a 05.2a 07.9a 36.5a 18.9a 46.1
20.39 19.27 20.31 19.91 20.37 19.77
Colours Colours Colours Colours Colours Colours
DA DAH? DA DA DA AGN z = 2.10
-18 01 44.5b
20.99
Colours only
14 14 16 14 13 14
58.39 05.75 21.93 10.93 26.42 00.06
22 13 30.98 a b
Candidate white dwarfs in the SNLS D1 and D4 fields g band mag Discovery method Classification (AB) 10.6a 17.77 Colours and proper motion DA 16.3a 17.90 Proper motion only DA 09.2a 19.86 Colours and proper motion DC 36.5a 19.56 Colours and proper motion DA
07 59 44 40 23 21
DC
Also listed in Limboz et al. (2008) From Limboz et al. (2008)
Cluster XLSS J022357.4-043516 XLSS J022404.1-041330 XLSS J022303.3-043621 a
and proper motion and proper motion only only and proper motion only
See Pierre et al. (2007)
Table 4: Cluster redshifts Cluster Classa Mean redshift C1 0.495 C1 1.051 C2 ...
Number of redshifts 4 1 0
14
Publications of the Astronomical Society of Australia
Table 5: AAOmega host galaxy redshifts of photometrically identified events Name SNLS-P03D1ad SNLS-P03D1af SNLS-P03D1ah SNLS-P03D1ah SNLS-P03D1aj SNLS-P03D1ak SNLS-P03D1al SNLS-P03D1an SNLS-P03D1ao SNLS-P03D1ap SNLS-P03D1ar SNLS-P03D1ay SNLS-P03D1bg SNLS-P03D1bh SNLS-P03D1bi SNLS-P03D1br SNLS-P03D1bu SNLS-P03D1by SNLS-P03D1ca SNLS-P03D1cb SNLS-P03D1cd SNLS-P03D1cg SNLS-P03D1ck SNLS-P03D1cp SNLS-P03D1ct SNLS-P03D1cu SNLS-P03D1cv SNLS-P03D1cw SNLS-P03D4aa SNLS-P03D4aa SNLS-P03D4ab SNLS-P03D4ab SNLS-P03D4ac SNLS-P03D4ac SNLS-P03D4ad SNLS-P03D4ae SNLS-P03D4af SNLS-P03D4ag SNLS-P03D4ai SNLS-P03D4aj SNLS-P03D4ak SNLS-P03D4al SNLS-P03D4am SNLS-P03D4an SNLS-P03D4ao SNLS-P03D4ao SNLS-P03D4ap SNLS-P03D4aq SNLS-P03D4ar SNLS-P03D4as
RTD name ... ... SNLS-03D1be SNLS-03D1br SNLS-03D1am SNLS-03D1aq SNLS-03D1bk SNLS-03D1ax ... ... ... SNLS-03D1by ... SNLS-03D1df ... ... ... SNLS-03D1du ... ... SNLS-03D1fb ... SNLS-03D1ea ... ... ... ... SNLS-03D1gi ... SNLS-03D4at SNLS-03D4az SNLS-03D4ev ... ... SNLS-03D4da SNLS-03D4au SNLS-03D4fd ... ... SNLS-03D4aa SNLS-03D4fy ... SNLS-03D4gg SNLS-03D4bc SNLS-03D4ag SNLS-03D4gh SNLS-03D4hd SNLS-03D4ai SNLS-03D4be ...
RA (J2000) 02 26 07.46 02 24 28.52 02 25 51.20 02 26 09.42 02 24 13.84 02 25 03.10 02 26 27.49 02 24 23.24 02 25 40.15 02 26 48.20 02 24 53.34 02 27 54.02 02 24 47.80 02 26 41.90 02 26 21.97 02 24 42.89 02 24 24.26 02 24 59.84 02 26 51.58 02 25 21.28 02 27 12.84 02 27 48.49 02 27 50.35 02 27 06.13 02 24 29.11 02 24 32.61 02 25 08.57 02 25 18.12 22 16 37.85 22 14 24.01 22 15 47.79 22 16 51.39 22 13 54.79 22 16 54.51 22 15 57.04 22 16 09.92 22 16 14.44 22 15 49.67 22 16 05.63 22 16 56.37 22 15 33.16 22 15 26.85 22 16 40.22 22 15 28.21 22 14 45.85 22 15 34.59 22 15 39.43 22 16 41.54 22 14 09.07 22 14 41.49
DEC (J2000) Redshift -04 40 16.3 0.724 -04 08 38.2 1.083 -04 16 02.8 0.825 -04 23 45.9 0.426 -04 26 02.3 0.557 -04 05 01.9 0.705 -04 32 11.7 0.866 -04 43 16.0 0.497 -04 18 47.0 0.596 -04 03 53.4 0.548 -04 16 16.8 0.648 -04 03 04.4 0.378 -04 31 02.0 0.584 -04 45 13.1 0.237 -04 50 30.2 0.704 -04 21 03.2 1.294 -04 44 26.4 0.142 -04 18 38.2 0.852 -04 14 15.0 0.210 -04 23 00.0 0.602 -04 07 16.7 0.497 -04 19 01.6 0.689 -04 05 02.2 0.313 -04 31 28.3 0.986 -04 09 55.0 0.265 -04 30 03.2 0.328 -04 38 25.1 0.366 -04 31 55.7 0.525 -17 55 20.5 0.562 -17 46 36.0 0.634 -18 07 51.2 0.409 -17 20 03.1 0.538 -17 17 11.4 0.408 -18 02 12.1 0.936 -18 05 21.4 0.328 -18 04 39.2 0.469 -17 23 43.4 0.791 -17 43 31.7 0.755 -17 26 23.3 1.077 -17 57 38.1 0.167 -17 44 14.3 0.339 -17 16 00.3 0.643 -18 09 51.0 0.593 -17 49 48.1 0.573 -17 44 21.9 0.285 -17 56 10.4 0.341 -17 53 37.4 0.872 -17 26 10.4 0.202 -17 36 38.9 0.414 -17 32 13.7 0.338 Continued on
Quality flag 4 4 4 5 3 5 4 4 5 4 4 5 3 4 4 3 5 3 4 4 4 4 5 4 5 5 5 3 5 4 5 4 5 4 5 5 3 4 4 5 5 5 4 4 5 5 4 5 5 4 next page ...
15
www.publish.csiro.au/journals/pasa
Table 5: — continued from previous page Name SNLS-P03D4au SNLS-P03D4av SNLS-P03D4aw SNLS-P03D4ay SNLS-P03D4az SNLS-P03D4ba SNLS-P03D4bb SNLS-P03D4bc SNLS-P03D4bf SNLS-P03D4bh SNLS-P03D4bi SNLS-P03D4bl SNLS-P03D4bt SNLS-P03D4bu SNLS-P03D4bw SNLS-P03D4by SNLS-P03D4bz SNLS-P03D4cb SNLS-P03D4cd SNLS-P03D4cf SNLS-P03D4ch SNLS-P03D4cj SNLS-P03D4ck SNLS-P03D4cl SNLS-P04D1aa SNLS-P04D1ab SNLS-P04D1ac SNLS-P04D1ac SNLS-P04D1ag SNLS-P04D1ai SNLS-P04D1aj SNLS-P04D1al SNLS-P04D1am SNLS-P04D1am SNLS-P04D1an SNLS-P04D1ap SNLS-P04D1au SNLS-P04D1aw SNLS-P04D1ax SNLS-P04D1ay SNLS-P04D1be SNLS-P04D1bg SNLS-P04D1bi SNLS-P04D1bj SNLS-P04D1bk SNLS-P04D1bl SNLS-P04D1bn SNLS-P04D1bo SNLS-P04D1bq SNLS-P04D1br
RTD name ... ... SNLS-03D4bj ... SNLS-03D4bx SNLS-03D4bf SNLS-03D4cd SNLS-03D4bl SNLS-03D4cw SNLS-03D4cn ... ... SNLS-03D4cy SNLS-03D4cz SNLS-03D4ed SNLS-03D4di SNLS-03D4dh ... SNLS-03D4ec ... SNLS-03D4dp ... SNLS-03D4gi ... SNLS-04D1ad ... ... SNLS-04D1ae SNLS-04D1ec SNLS-03D1gr ... ... ... ... SNLS-04D1fh SNLS-04D1de SNLS-04D1hw ... SNLS-04D1hb SNLS-04D1dz ... SNLS-04D1la SNLS-04D1hk SNLS-04D1iu SNLS-04D1jg SNLS-04D1jt SNLS-04D1oa SNLS-04D1or SNLS-04D1oe SNLS-04D1ln
RA (J2000) 22 15 43.69 22 14 58.89 22 14 30.09 22 14 55.22 22 14 48.64 22 17 01.34 22 17 18.42 22 14 05.44 22 16 11.46 22 16 34.56 22 16 38.23 22 17 10.80 22 13 40.47 22 16 41.80 22 16 19.76 22 14 10.24 22 17 31.08 22 13 31.21 22 14 43.70 22 13 27.50 22 15 39.04 22 15 16.12 22 17 08.68 22 16 58.24 02 24 15.96 02 27 08.48 02 25 09.52 02 25 57.33 02 24 15.25 02 25 59.00 02 27 01.41 02 27 23.85 02 25 37.74 02 26 08.55 02 26 59.38 02 26 35.93 02 25 13.39 02 27 39.16 02 26 20.26 02 27 53.68 02 25 36.24 02 26 39.80 02 24 45.94 02 24 31.30 02 26 12.64 02 25 47.62 02 25 11.76 02 26 23.42 02 25 24.50 02 25 53.45
DEC (J2000) Redshift -17 48 35.6 0.800 -17 50 44.1 0.313 -18 06 49.9 0.895 -17 24 30.3 0.602 -17 31 17.7 0.600 -18 00 42.9 0.805 -18 01 26.4 0.845 -17 18 38.1 0.319 -17 13 59.7 0.155 -17 16 13.6 0.818 -17 36 50.8 1.006 -17 24 08.0 1.205 -17 40 55.1 0.927 -17 55 34.5 0.697 -17 31 27.5 0.860 -17 30 24.3 0.905 -17 37 47.6 0.627 -17 30 14.2 1.310 -17 21 40.6 1.016 -17 40 05.0 0.368 -17 16 52.4 0.955 -17 20 48.2 0.540 -18 12 46.4 0.578 -17 18 32.8 1.068 -04 28 44.9 0.392 -04 11 16.9 0.157 -04 10 41.5 1.003 -04 33 21.8 0.617 -04 23 08.6 0.603 -04 09 28.2 0.296 -04 15 30.7 0.528 -04 04 37.5 0.623 -04 35 49.1 0.612 -04 31 33.5 0.823 -04 29 42.3 0.687 -04 25 21.8 0.768 -04 52 02.0 0.350 -04 11 02.1 0.718 -04 07 45.5 0.912 -04 05 12.1 0.446 -04 36 16.1 0.825 -04 49 53.0 0.319 -04 24 05.1 0.635 -04 03 29.6 0.254 -04 08 07.1 0.585 -04 22 32.8 0.639 -04 10 49.4 1.006 -04 41 50.7 1.139 -04 53 34.7 0.641 -04 27 02.9 0.208 Continued on
Quality flag 4 5 3 5 4 5 4 5 5 3 3 4 3 4 3 3 5 3 3 4 3 5 4 3 5 4 3 4 4 5 5 5 4 3 4 4 4 4 3 5 4 4 4 5 4 5 3 4 4 5 next page ...
16
Publications of the Astronomical Society of Australia
Table 5: — continued from previous page Name SNLS-P03D4au SNLS-P03D4av SNLS-P03D4aw SNLS-P03D4ay SNLS-P03D4az SNLS-P03D4ba SNLS-P03D4bb SNLS-P03D4bc SNLS-P03D4bf SNLS-P03D4bh SNLS-P03D4bi SNLS-P03D4bl SNLS-P03D4bt SNLS-P03D4bu SNLS-P03D4bw SNLS-P03D4by SNLS-P03D4bz SNLS-P03D4cb SNLS-P03D4cd SNLS-P03D4cf SNLS-P03D4ch SNLS-P03D4cj SNLS-P03D4ck SNLS-P03D4cl SNLS-P04D1aa SNLS-P04D1ab SNLS-P04D1ac SNLS-P04D1ac SNLS-P04D1ag SNLS-P04D1ai SNLS-P04D1aj SNLS-P04D1al SNLS-P04D1am SNLS-P04D1am SNLS-P04D1an SNLS-P04D1ap SNLS-P04D1au SNLS-P04D1aw SNLS-P04D1ax SNLS-P04D1ay SNLS-P04D1be SNLS-P04D1bg SNLS-P04D1bi SNLS-P04D1bj SNLS-P04D1bk SNLS-P04D1bl SNLS-P04D1bn SNLS-P04D1bo SNLS-P04D1bq SNLS-P04D1br
RTD name ... ... SNLS-03D4bj ... SNLS-03D4bx SNLS-03D4bf SNLS-03D4cd SNLS-03D4bl SNLS-03D4cw SNLS-03D4cn ... ... SNLS-03D4cy SNLS-03D4cz SNLS-03D4ed SNLS-03D4di SNLS-03D4dh ... SNLS-03D4ec ... SNLS-03D4dp ... SNLS-03D4gi ... SNLS-04D1ad ... ... SNLS-04D1ae SNLS-04D1ec SNLS-03D1gr ... ... ... ... SNLS-04D1fh SNLS-04D1de SNLS-04D1hw ... SNLS-04D1hb SNLS-04D1dz ... SNLS-04D1la SNLS-04D1hk SNLS-04D1iu SNLS-04D1jg SNLS-04D1jt SNLS-04D1oa SNLS-04D1or SNLS-04D1oe SNLS-04D1ln
RA (J2000) 22 15 43.69 22 14 58.89 22 14 30.09 22 14 55.22 22 14 48.64 22 17 01.34 22 17 18.42 22 14 05.44 22 16 11.46 22 16 34.56 22 16 38.23 22 17 10.80 22 13 40.47 22 16 41.80 22 16 19.76 22 14 10.24 22 17 31.08 22 13 31.21 22 14 43.70 22 13 27.50 22 15 39.04 22 15 16.12 22 17 08.68 22 16 58.24 02 24 15.96 02 27 08.48 02 25 09.52 02 25 57.33 02 24 15.25 02 25 59.00 02 27 01.41 02 27 23.85 02 25 37.74 02 26 08.55 02 26 59.38 02 26 35.93 02 25 13.39 02 27 39.16 02 26 20.26 02 27 53.68 02 25 36.24 02 26 39.80 02 24 45.94 02 24 31.30 02 26 12.64 02 25 47.62 02 25 11.76 02 26 23.42 02 25 24.50 02 25 53.45
DEC (J2000) Redshift -17 48 35.6 0.800 -17 50 44.1 0.313 -18 06 49.9 0.895 -17 24 30.3 0.602 -17 31 17.7 0.600 -18 00 42.9 0.805 -18 01 26.4 0.845 -17 18 38.1 0.319 -17 13 59.7 0.155 -17 16 13.6 0.818 -17 36 50.8 1.006 -17 24 08.0 1.205 -17 40 55.1 0.927 -17 55 34.5 0.697 -17 31 27.5 0.860 -17 30 24.3 0.905 -17 37 47.6 0.627 -17 30 14.2 1.310 -17 21 40.6 1.016 -17 40 05.0 0.368 -17 16 52.4 0.955 -17 20 48.2 0.540 -18 12 46.4 0.578 -17 18 32.8 1.068 -04 28 44.9 0.392 -04 11 16.9 0.157 -04 10 41.5 1.003 -04 33 21.8 0.617 -04 23 08.6 0.603 -04 09 28.2 0.296 -04 15 30.7 0.528 -04 04 37.5 0.623 -04 35 49.1 0.612 -04 31 33.5 0.823 -04 29 42.3 0.687 -04 25 21.8 0.768 -04 52 02.0 0.350 -04 11 02.1 0.718 -04 07 45.5 0.912 -04 05 12.1 0.446 -04 36 16.1 0.825 -04 49 53.0 0.319 -04 24 05.1 0.635 -04 03 29.6 0.254 -04 08 07.1 0.585 -04 22 32.8 0.639 -04 10 49.4 1.006 -04 41 50.7 1.139 -04 53 34.7 0.641 -04 27 02.9 0.208 Continued on
Quality flag 4 5 3 5 4 5 4 5 5 3 3 4 3 4 3 3 5 3 3 4 3 5 4 3 5 4 3 4 4 5 5 5 4 3 4 4 4 4 3 5 4 4 4 5 4 5 3 4 4 5 next page ...
17
www.publish.csiro.au/journals/pasa
Table 5: — continued from previous page Name SNLS-P04D1bs SNLS-P04D1bv SNLS-P04D1bw SNLS-P04D1bx SNLS-P04D1by SNLS-P04D1ce SNLS-P04D1ch SNLS-P04D1cj SNLS-P04D1cm SNLS-P04D1cq SNLS-P04D1ct SNLS-P04D1cu SNLS-P04D1cy SNLS-P04D1cz SNLS-P04D1dc SNLS-P04D1de SNLS-P04D1df SNLS-P04D1dg SNLS-P04D1dk SNLS-P04D1dm SNLS-P04D1dn SNLS-P04D1dq SNLS-P04D1dw SNLS-P04D1dx SNLS-P04D1dz SNLS-P04D1eg SNLS-P04D1eh SNLS-P04D1ej SNLS-P04D1el SNLS-P04D4aa SNLS-P04D4aa SNLS-P04D4ab SNLS-P04D4ab SNLS-P04D4ab SNLS-P04D4ac SNLS-P04D4ac SNLS-P04D4ad SNLS-P04D4ae SNLS-P04D4af SNLS-P04D4ag SNLS-P04D4ag SNLS-P04D4ah SNLS-P04D4ah SNLS-P04D4ai SNLS-P04D4ai SNLS-P04D4aj SNLS-P04D4ak SNLS-P04D4al SNLS-P04D4ao SNLS-P04D4ap
RTD name SNLS-04D1kw SNLS-04D1qw SNLS-04D1ot SNLS-04D1nz SNLS-04D1hi ... SNLS-04D1qa SNLS-04D1po SNLS-04D1oq ... SNLS-04D1pq ... SNLS-04D1pv SNLS-04D1qs SNLS-04D1qu SNLS-04D1qn SNLS-04D1pj SNLS-04D1pu SNLS-04D1pf ... ... SNLS-04D1qr SNLS-04D1sw SNLS-04D1tb SNLS-04D1rg SNLS-05D1ad SNLS-04D1sf SNLS-04D1sl SNLS-04D1sc SNLS-04D4ih SNLS-04D4lj ... SNLS-04D4ay SNLS-04D4id ... SNLS-04D4kd SNLS-04D4lb SNLS-04D4mt SNLS-04D4di SNLS-04D4it SNLS-04D4ms ... SNLS-04D4cm ... ... SNLS-04D4ev SNLS-04D4fu SNLS-04D4dw SNLS-04D4im SNLS-04D4ec
RA (J2000) 02 25 09.96 02 26 25.60 02 26 22.42 02 25 15.65 02 26 21.60 02 25 44.81 02 25 14.88 02 25 24.55 02 24 39.56 02 26 27.24 02 24 52.84 02 25 51.16 02 24 32.48 02 25 44.81 02 26 18.65 02 27 28.18 02 26 50.27 02 27 28.43 02 25 13.69 02 24 10.34 02 24 20.81 02 25 49.10 02 26 44.52 02 24 09.59 02 26 43.64 02 24 54.23 02 25 56.14 02 24 20.96 02 26 34.39 22 17 17.01 22 15 01.49 22 15 30.47 22 15 54.07 22 16 21.50 22 17 26.04 22 13 44.03 22 14 59.53 22 16 54.10 22 15 40.78 22 16 00.53 22 16 13.40 22 15 13.70 22 13 28.78 22 13 56.80 22 16 47.69 22 15 10.50 22 14 11.42 22 16 44.63 22 15 00.83 22 16 29.30
DEC (J2000) Redshift -04 15 13.9 0.901 -04 37 24.6 0.312 -04 31 13.1 1.014 -04 41 01.3 0.264 -04 16 52.7 0.556 -04 24 05.4 0.910 -04 49 22.9 0.173 -04 21 09.0 0.141 -04 15 56.6 0.330 -04 33 53.8 0.795 -04 07 40.8 1.017 -04 59 17.6 1.001 -04 24 19.9 0.873 -04 24 05.4 0.910 -04 04 38.1 0.343 -04 20 37.1 0.490 -04 12 08.2 0.156 -04 44 41.5 0.639 -04 57 49.2 0.311 -04 38 15.3 0.647 -04 30 35.7 0.640 -04 29 00.2 0.429 -04 16 39.0 0.710 -04 50 11.8 0.495 -04 33 17.8 0.309 -04 43 47.6 0.408 -04 30 44.7 0.707 -04 03 50.1 0.703 -04 02 46.3 0.627 -17 40 38.9 0.935 -17 49 19.9 0.411 -17 23 15.2 1.046 -18 02 50.1 0.565 -17 13 44.2 0.770 -18 01 44.9 0.715 -17 57 58.9 0.745 -18 01 46.1 0.800 -17 31 56.0 0.371 -17 40 12.7 0.947 -18 05 48.5 0.982 -17 53 19.7 0.568 -18 03 19.8 0.468 -18 03 40.6 0.466 -18 01 02.4 0.741 -17 59 47.9 0.416 -18 05 58.1 0.900 -17 32 32.3 0.134 -17 50 02.4 1.032 -17 23 45.9 0.752 -18 11 04.4 0.593 Continued on
Quality flag 3 5 3 5 4 3 5 5 5 4 4 3 3 3 4 3 5 3 5 4 4 4 4 4 5 5 3 3 4 3 4 3 5 4 5 5 4 5 3 3 4 4 5 4 5 3 5 3 4 5 next page ...
18
Publications of the Astronomical Society of Australia
Table 5: — continued from previous page Name SNLS-P04D4ap SNLS-P04D4aq SNLS-P04D4aq SNLS-P04D4ar SNLS-P04D4as SNLS-P04D4as SNLS-P04D4at SNLS-P04D4at SNLS-P04D4au SNLS-P04D4av SNLS-P04D4aw SNLS-P04D4ax SNLS-P04D4ax SNLS-P04D4ba SNLS-P04D4bd SNLS-P04D4bd SNLS-P04D4be SNLS-P04D4be SNLS-P04D4bf SNLS-P04D4bh SNLS-P04D4bi SNLS-P04D4bk SNLS-P04D4bk SNLS-P04D4bl SNLS-P04D4bl SNLS-P04D4bm SNLS-P04D4bm SNLS-P04D4bo SNLS-P04D4bp SNLS-P04D4br SNLS-P04D4bt SNLS-P04D4bv SNLS-P04D4bx SNLS-P04D4by SNLS-P04D4bz SNLS-P04D4ca SNLS-P04D4cb SNLS-P04D4cc SNLS-P04D4cf SNLS-P04D4ch SNLS-P04D4cj SNLS-P04D4ck SNLS-P04D4cl SNLS-P05D1ac SNLS-P05D1ac SNLS-P05D1ad SNLS-P05D1ae SNLS-P05D1ae SNLS-P05D1af SNLS-P05D1ai
RTD name SNLS-04D4in ... SNLS-04D4jw ... SNLS-04D4eq SNLS-04D4jv ... SNLS-04D4kq SNLS-04D4kb SNLS-04D4jx SNLS-04D4lg ... SNLS-04D4dm ... SNLS-04D4et SNLS-04D4kn SNLS-04D4ew SNLS-04D4jn SNLS-04D4eu SNLS-04D4ju SNLS-04D4fo SNLS-04D4fv SNLS-04D4ky ... SNLS-04D4mx ... SNLS-04D4lw ... ... SNLS-04D4gd SNLS-04D4hk SNLS-04D4ft SNLS-04D4hg ... ... SNLS-04D4gz ... SNLS-04D4gg ... SNLS-04D4hu SNLS-04D4ht SNLS-04D4hx SNLS-04D4ib SNLS-04D1ss SNLS-05D1cq ... ... SNLS-05D1cb ... SNLS-05D1cf
RA (J2000) 22 15 08.58 22 15 09.36 22 17 18.88 22 16 27.32 22 14 23.63 22 15 36.94 22 14 44.87 22 13 31.67 22 17 16.25 22 16 52.10 22 15 08.10 22 14 18.85 22 15 25.47 22 16 09.14 22 14 51.77 22 15 04.42 22 14 59.83 22 14 27.43 22 14 47.34 22 17 02.72 22 14 47.10 22 16 04.73 22 17 27.99 22 15 45.53 22 16 30.26 22 16 21.79 22 15 53.40 22 16 58.55 22 14 40.64 22 15 09.38 22 16 34.91 22 14 31.08 22 16 41.90 22 16 48.93 22 13 56.35 22 16 58.96 22 14 03.62 22 16 09.23 22 16 52.33 22 15 36.21 22 14 33.27 22 13 40.55 22 16 41.70 02 26 48.35 02 25 19.09 02 26 05.11 02 25 44.29 02 26 57.12 02 27 05.06 02 27 55.52
DEC (J2000) Redshift -17 15 40.2 0.516 -18 11 04.5 0.886 -17 39 56.0 0.961 -18 12 18.9 0.453 -17 52 04.6 0.701 -18 09 24.3 0.230 -18 09 20.0 1.171 -17 53 47.2 0.744 -17 38 37.8 0.967 -17 38 06.9 0.373 -17 39 41.2 0.912 -17 32 32.9 1.188 -17 14 42.9 0.812 -18 06 30.8 0.933 -17 47 23.0 0.536 -17 19 45.6 0.910 -17 40 35.1 0.131 -17 58 12.6 0.330 -17 46 11.6 0.795 -17 19 58.7 0.472 -17 25 16.1 0.880 -17 59 31.9 0.533 -18 13 37.1 0.559 -17 32 14.3 0.918 -18 03 41.5 1.220 -18 04 04.6 0.852 -17 52 58.6 0.850 -17 56 14.9 0.740 -17 35 37.6 0.720 -18 13 35.1 0.193 -17 49 42.1 0.587 -17 40 19.0 0.268 -17 56 31.5 0.518 -17 53 20.8 0.805 -17 49 45.6 1.199 -17 37 18.4 0.375 -17 37 57.3 1.002 -17 17 40.1 0.424 -18 02 13.8 0.804 -17 50 20.3 0.703 -17 21 31.5 0.218 -17 23 03.5 0.543 -18 06 18.3 0.705 -04 27 50.8 0.328 -04 47 33.7 0.309 -04 38 07.7 0.563 -04 41 29.7 0.672 -04 07 03.1 0.632 -03 59 37.8 1.037 -04 54 20.3 0.497 Continued on
Quality flag 4 3 4 5 5 5 4 3 3 5 4 3 4 3 5 4 5 5 3 5 3 4 3 3 3 4 3 5 4 4 4 5 5 4 5 5 3 5 4 5 5 3 4 5 4 5 3 4 4 4 next page ...
19
www.publish.csiro.au/journals/pasa
Table 5: — continued from previous page Name SNLS-P05D1al SNLS-P05D1aq SNLS-P05D1as SNLS-P05D1au SNLS-P05D1av SNLS-P05D1ax SNLS-P05D1ba SNLS-P05D1bc SNLS-P05D1bd SNLS-P05D1be SNLS-P05D1bg SNLS-P05D1bl SNLS-P05D1bn SNLS-P05D1bo SNLS-P05D1bp SNLS-P05D1br SNLS-P05D1bv SNLS-P05D1bx SNLS-P05D1bz SNLS-P05D1ca SNLS-P05D1cd SNLS-P05D1cg SNLS-P05D1cj SNLS-P05D1co SNLS-P05D1cp SNLS-P05D1cq SNLS-P05D1cu SNLS-P05D1cw SNLS-P05D1cx SNLS-P05D1cz SNLS-P05D1da SNLS-P05D1dd SNLS-P05D1de SNLS-P05D1dg SNLS-P05D1dh SNLS-P05D1di SNLS-P05D1dj SNLS-P05D1dk SNLS-P05D1dl SNLS-P05D1dm SNLS-P05D1dn SNLS-P05D1do SNLS-P05D1dp SNLS-P05D1dr SNLS-P05D1ds SNLS-P05D1dt SNLS-P05D1du SNLS-P05D1dw SNLS-P05D1ec SNLS-P05D1ed
RTD name ... ... SNLS-05D1ds SNLS-05D1da SNLS-05D1cs ... SNLS-05D1cm ... SNLS-05D1di ... ... ... ... SNLS-05D1dd ... ... SNLS-05D1je ... ... SNLS-05D1fa SNLS-05D1ej ... ... ... SNLS-05D1fs ... ... ... ... ... SNLS-05D1jv ... ... ... ... SNLS-05D1ib ... ... ... ... ... SNLS-05D1hm SNLS-05D1ie ... ... ... ... ... ... ...
RA (J2000) 02 26 09.43 02 26 31.05 02 27 38.14 02 26 24.54 02 27 16.12 02 25 09.49 02 27 13.04 02 26 06.73 02 25 08.46 02 25 38.24 02 24 58.03 02 26 35.38 02 27 18.54 02 26 43.99 02 27 04.62 02 26 28.91 02 25 10.71 02 26 00.64 02 24 42.17 02 26 04.81 02 26 06.32 02 26 35.48 02 25 46.98 02 26 59.77 02 27 29.33 02 26 33.35 02 24 15.86 02 27 34.29 02 27 05.30 02 27 07.55 02 26 28.34 02 24 32.80 02 27 55.92 02 25 46.23 02 26 28.26 02 25 34.35 02 27 06.66 02 25 26.65 02 27 46.67 02 27 12.69 02 24 59.66 02 27 46.16 02 24 23.58 02 26 41.52 02 25 23.57 02 27 29.96 02 26 57.65 02 27 02.23 02 27 28.06 02 27 16.08
DEC (J2000) Redshift -04 23 10.3 0.855 -04 47 02.0 0.438 -04 39 33.8 0.309 -04 26 15.2 0.426 -04 11 00.1 0.918 -04 02 20.1 0.615 -04 27 18.5 0.228 -04 00 21.9 0.960 -04 14 06.7 0.629 -04 18 06.3 0.329 -04 19 27.0 0.837 -04 00 44.0 0.211 -04 51 46.8 0.436 -04 58 12.8 0.331 -04 26 48.7 0.070 -04 07 13.9 0.884 -04 50 32.8 0.310 -04 18 52.4 0.705 -04 13 04.3 0.834 -04 14 36.9 0.794 -04 43 46.0 0.312 -04 26 44.0 0.690 -04 11 34.2 0.659 -04 34 30.3 1.175 -04 22 48.9 0.346 -04 00 38.7 0.345 -04 35 20.5 1.182 -04 38 11.4 0.585 -04 37 46.0 0.071 -04 23 58.5 0.237 -04 20 14.4 0.422 -04 13 32.8 0.259 -04 54 57.4 1.140 -04 31 29.4 1.057 -04 00 51.7 0.209 -04 58 36.7 0.238 -04 36 08.7 0.228 -04 18 44.0 0.644 -04 53 56.1 0.294 -04 57 27.9 0.191 -04 47 56.8 0.439 -04 43 02.1 0.586 -04 40 39.4 0.263 -04 00 01.8 0.877 -04 05 10.4 0.600 -04 49 31.9 0.695 -04 54 38.6 0.141 -04 49 06.4 0.621 -04 38 48.3 0.298 -04 35 03.7 0.357 Continued on
Quality flag 3 4 5 5 3 5 5 4 4 3 3 4 5 4 4 3 4 4 3 3 4 4 3 3 4 4 3 4 4 5 4 4 3 3 5 5 5 4 4 4 4 4 5 4 4 4 5 4 4 5 next page ...
20
Publications of the Astronomical Society of Australia
Table 5: — continued from previous page Name SNLS-P05D1ee SNLS-P05D1ef SNLS-P05D1ei SNLS-P05D1em SNLS-P05D1en SNLS-P05D1eq SNLS-P05D1ev SNLS-P05D1ey SNLS-P05D1ez SNLS-P05D1ff SNLS-P05D1fi SNLS-P05D1fj SNLS-P05D1fm SNLS-P05D1ft SNLS-P05D1fv SNLS-P05D1fw SNLS-P05D1fx SNLS-P05D1gk SNLS-P05D1gm SNLS-P05D1gn SNLS-P05D1gu SNLS-P05D1gv SNLS-P05D1gw SNLS-P05D1gy SNLS-P05D1gz SNLS-P05D1hb SNLS-P05D1hc SNLS-P05D1hd SNLS-P05D1hf SNLS-P05D1hg SNLS-P05D1hi SNLS-P05D1hk SNLS-P05D4aa SNLS-P05D4ab SNLS-P05D4ac SNLS-P05D4ac SNLS-P05D4ad SNLS-P05D4ad SNLS-P05D4ae SNLS-P05D4af SNLS-P05D4af SNLS-P05D4ag SNLS-P05D4ag SNLS-P05D4ah SNLS-P05D4ai SNLS-P05D4ai SNLS-P05D4aj SNLS-P05D4ak SNLS-P05D4al SNLS-P05D4am
RTD name ... SNLS-05D1jq ... ... ... SNLS-05D1jh SNLS-05D1ku SNLS-05D1kh ... ... ... ... ... ... ... ... ... ... ... ... ... ... ... ... ... ... ... ... ... ... SNLS-05D1ma SNLS-05D1lo SNLS-05D4ff SNLS-05D4ek SNLS-05D4al SNLS-05D4fl SNLS-05D4bc SNLS-05D4fg SNLS-05D4bf ... ... ... SNLS-05D4ay SNLS-05D4be SNLS-05D4bn SNLS-05D4fi ... SNLS-05D4av ... SNLS-05D4bl
RA (J2000) 02 27 02.49 02 24 12.10 02 27 16.41 02 26 53.65 02 25 39.89 02 24 25.48 02 26 13.23 02 25 56.06 02 26 03.81 02 27 46.42 02 24 55.14 02 26 26.00 02 25 45.14 02 24 00.31 02 27 55.05 02 27 11.32 02 27 15.90 02 24 17.30 02 27 30.80 02 27 18.37 02 25 00.92 02 24 58.70 02 24 46.34 02 24 05.31 02 24 03.91 02 27 32.99 02 27 27.07 02 27 04.24 02 25 22.38 02 24 09.98 02 24 19.58 02 25 54.37 22 16 20.16 22 16 27.49 22 15 44.81 22 15 01.83 22 17 22.47 22 16 41.34 22 16 26.36 22 16 56.54 22 17 04.45 22 16 53.55 22 14 33.16 22 16 53.39 22 16 07.41 22 16 09.58 22 14 40.11 22 14 10.49 22 14 07.08 22 16 47.53
DEC (J2000) Redshift -04 35 31.2 0.030 -04 41 41.8 0.500 -04 22 52.3 0.514 -04 04 14.1 0.683 -04 05 25.0 0.063 -04 03 47.4 0.765 -04 24 14.7 0.319 -04 13 29.4 0.327 -04 42 09.8 0.603 -04 08 25.9 0.874 -04 53 35.2 0.710 -04 54 46.7 0.658 -04 55 23.0 0.903 -04 04 33.2 0.571 -04 49 56.9 0.676 -04 50 20.4 0.964 -04 49 46.3 0.722 -04 55 03.6 0.965 -04 40 13.9 0.578 -04 33 47.9 0.309 -04 17 29.2 0.863 -04 17 38.7 0.254 -04 18 29.5 0.669 -04 19 25.4 0.557 -04 18 04.5 0.466 -04 00 30.0 0.706 -04 07 20.5 0.255 -04 05 17.3 0.767 -04 09 31.9 0.558 -04 13 16.6 1.050 -04 08 04.0 0.432 -04 20 04.7 0.862 -18 02 33.0 0.403 -17 44 09.3 0.536 -17 51 59.3 0.308 -17 56 36.3 0.308 -18 08 46.1 0.127 -17 35 44.9 0.840 -18 13 53.6 0.553 -17 52 11.5 0.745 -18 12 20.9 0.618 -17 57 58.2 0.740 -17 46 03.2 0.409 -17 14 10.1 0.538 -17 30 40.7 0.878 -17 14 16.2 0.411 -17 37 35.2 0.657 -17 54 42.6 0.508 -17 39 21.8 0.793 -17 16 44.0 1.286 Continued on
Quality flag 5 5 4 4 5 4 5 5 4 4 4 3 3 4 3 4 4 4 5 5 4 4 4 4 5 4 5 3 5 3 4 4 5 4 5 5 5 4 5 5 4 4 4 4 4 5 4 4 3 3 next page ...
21
www.publish.csiro.au/journals/pasa
Table 5: — continued from previous page Name SNLS-P05D4an SNLS-P05D4ao SNLS-P05D4ap SNLS-P05D4aq SNLS-P05D4ar SNLS-P05D4ar SNLS-P05D4as SNLS-P05D4at SNLS-P05D4at SNLS-P05D4au SNLS-P05D4aw SNLS-P05D4ax SNLS-P05D4ax SNLS-P05D4ay SNLS-P05D4ay SNLS-P05D4az SNLS-P05D4ba SNLS-P05D4bb SNLS-P05D4bc SNLS-P05D4bd SNLS-P05D4be SNLS-P05D4be SNLS-P05D4bg SNLS-P05D4bg SNLS-P05D4bh SNLS-P05D4bi SNLS-P05D4bi SNLS-P05D4bj SNLS-P05D4bj SNLS-P05D4bk SNLS-P05D4bk SNLS-P05D4bl SNLS-P05D4bl SNLS-P05D4bm SNLS-P05D4bm SNLS-P05D4bn SNLS-P05D4bo SNLS-P05D4br SNLS-P05D4bs SNLS-P05D4bt SNLS-P05D4bu SNLS-P05D4bx SNLS-P05D4by SNLS-P05D4bz SNLS-P05D4ca SNLS-P05D4cb SNLS-P05D4cc SNLS-P05D4cd SNLS-P05D4ce SNLS-P05D4ch
RTD name SNLS-05D4bi SNLS-05D4fp ... ... ... SNLS-05D4ar ... ... SNLS-05D4jq ... ... ... SNLS-05D4jp SNLS-05D4bw SNLS-05D4gx ... SNLS-05D4bm ... SNLS-05D4ck SNLS-05D4ch ... SNLS-05D4jz SNLS-05D4cw SNLS-05D4gy SNLS-05D4jy SNLS-05D4de SNLS-05D4lb SNLS-05D4cb SNLS-05D4kp SNLS-05D4ca SNLS-05D4is SNLS-05D4cn SNLS-05D4jw SNLS-05D4cq SNLS-05D4jx SNLS-05D4dd ... SNLS-05D4dt SNLS-05D4dr ... SNLS-05D4dp ... SNLS-05D4dn SNLS-05D4dx SNLS-05D4eq SNLS-05D4en SNLS-05D4du SNLS-05D4fc ... ...
RA (J2000) 22 15 56.53 22 14 32.56 22 16 47.45 22 16 51.11 22 15 37.70 22 14 30.52 22 14 35.03 22 17 02.83 22 14 50.86 22 14 47.72 22 15 23.09 22 16 14.60 22 13 44.29 22 14 31.39 22 13 55.94 22 13 28.98 22 17 04.60 22 14 33.00 22 16 01.52 22 14 13.84 22 13 57.64 22 16 05.43 22 14 50.05 22 16 28.50 22 16 22.93 22 15 46.38 22 13 54.16 22 15 57.36 22 14 31.44 22 14 11.32 22 17 08.06 22 13 31.43 22 17 14.21 22 14 09.68 22 14 55.55 22 16 17.23 22 13 57.28 22 14 25.85 22 15 51.17 22 16 10.33 22 15 55.41 22 13 49.29 22 16 01.37 22 13 39.37 22 14 07.74 22 14 13.79 22 15 29.58 22 16 53.04 22 15 07.24 22 15 37.65
DEC (J2000) Redshift -17 59 09.7 0.776 -17 24 30.0 1.014 -18 12 15.8 0.973 -17 45 55.3 0.939 -17 14 10.9 0.923 -18 02 19.6 0.191 -17 25 15.9 0.479 -17 21 31.6 1.030 -17 33 23.3 1.081 -17 36 19.2 1.187 -18 13 57.6 0.685 -18 09 00.3 0.840 -17 49 55.2 0.883 -18 01 31.5 0.259 -17 32 04.0 0.300 -17 52 49.1 0.792 -17 40 39.9 0.373 -17 17 38.2 0.420 -18 04 59.2 0.459 -17 22 42.4 0.856 -18 12 36.6 0.397 -17 42 16.0 0.516 -17 44 19.9 0.376 -17 51 49.4 0.588 -17 46 59.4 0.868 -17 27 49.8 0.644 -17 24 40.2 0.797 -17 54 18.8 0.208 -17 57 50.4 0.409 -17 48 15.2 0.607 -18 01 30.6 0.837 -17 17 20.8 0.764 -17 55 08.5 0.309 -18 13 34.6 0.701 -17 30 23.2 0.811 -17 22 31.5 0.791 -18 02 47.7 0.590 -17 40 15.9 0.407 -18 06 10.4 1.033 -17 55 31.7 0.441 -17 29 06.1 0.340 -17 25 27.7 0.952 -17 57 17.3 0.191 -18 03 21.0 0.792 -17 52 35.8 0.950 -17 16 60.0 0.422 -17 54 05.4 0.306 -17 41 13.4 1.065 -17 16 58.5 0.969 -18 04 21.7 1.171 Continued on
Quality flag 3 3 4 4 4 5 5 3 4 3 3 4 4 5 5 4 5 5 5 3 4 4 4 4 4 4 4 5 5 5 3 4 4 4 4 4 4 5 3 5 5 3 5 4 3 5 5 3 3 4 next page ...
22
Publications of the Astronomical Society of Australia
Table 5: — continued from previous page Name SNLS-P05D4ci SNLS-P05D4cl SNLS-P06D1ac SNLS-P06D1ag SNLS-P06D1ah SNLS-P06D1ai SNLS-P06D1aj SNLS-P06D1am SNLS-P06D4aa SNLS-P06D4ac SNLS-P06D4ad SNLS-P06D4af SNLS-P06D4ag SNLS-P06D4ah SNLS-P06D4ai SNLS-P06D4an SNLS-P06D4ao SNLS-P06D4ar SNLS-P06D4as SNLS-P06D4av SNLS-P06D4aw SNLS-P06D4ax SNLS-P06D4ay SNLS-P06D4az SNLS-P06D4ba SNLS-P06D4bb SNLS-P06D4bc SNLS-P06D4bd SNLS-P06D4be SNLS-P06D4bf SNLS-P06D4bj SNLS-P06D4bk SNLS-P06D4bm SNLS-P06D4bo SNLS-P06D4br SNLS-P06D4bs SNLS-P06D4bt SNLS-P06D4bv SNLS-P06D4bw SNLS-P06D4bx SNLS-P06D4bz SNLS-P06D4ca SNLS-P06D4cb SNLS-P06D4cd SNLS-P06D4ce SNLS-P06D4cf SNLS-P06D4ch SNLS-P06D4ci SNLS-P06D4cj SNLS-P06D4ck
RTD name SNLS-05D4er SNLS-05D4ej SNLS-06D1ac ... SNLS-05D1lz ... SNLS-05D1ln SNLS-05D1lj ... SNLS-06D4bw ... ... ... SNLS-06D4bz SNLS-06D4cd SNLS-06D4bo SNLS-06D4cb SNLS-06D4dp ... ... SNLS-06D4co SNLS-06D4dl ... SNLS-06D4du ... SNLS-06D4cm SNLS-06D4ds SNLS-06D4cq SNLS-06D4dt ... SNLS-06D4eb SNLS-06D4dv SNLS-06D4dh SNLS-06D4do SNLS-06D4el ... ... ... SNLS-06D4ee ... SNLS-06D4gq ... ... SNLS-06D4fo ... SNLS-06D4fa SNLS-06D4fc SNLS-06D4hh ... SNLS-06D4gp
RA (J2000) 22 16 04.12 22 15 52.51 02 24 07.83 02 24 21.65 02 25 27.53 02 25 14.10 02 24 45.17 02 25 52.16 22 16 21.09 22 15 03.71 22 15 10.87 22 13 37.14 22 16 56.62 22 13 44.15 22 16 39.20 22 15 28.05 22 15 16.34 22 14 35.23 22 17 34.79 22 15 43.58 22 15 26.49 22 16 59.80 22 16 24.10 22 15 47.37 22 15 55.56 22 15 15.75 22 16 01.40 22 16 55.48 22 14 05.87 22 15 35.59 22 15 45.04 22 15 31.90 22 14 19.57 22 15 48.60 22 16 27.25 22 14 59.91 22 16 35.03 22 14 33.12 22 13 29.35 22 14 10.66 22 14 24.34 22 16 16.62 22 15 54.01 22 13 49.45 22 17 13.68 22 13 39.66 22 13 51.06 22 15 52.04 22 13 28.59 22 15 53.26
DEC (J2000) -17 34 00.3 -18 11 44.3 -04 55 52.7 -04 40 08.5 -04 28 42.8 -04 16 59.8 -04 20 37.2 -04 09 40.2 -17 27 54.1 -17 52 60.0 -17 32 29.1 -17 35 45.5 -17 25 34.0 -17 17 20.5 -18 00 03.8 -17 24 34.0 -17 37 00.8 -17 17 38.8 -17 56 55.1 -18 10 48.3 -17 52 09.0 -17 15 02.9 -17 50 44.7 -17 54 41.9 -17 41 36.3 -17 18 11.8 -18 05 20.7 -17 42 43.4 -17 35 39.7 -18 01 08.7 -18 04 24.9 -18 10 33.6 -17 35 05.2 -17 17 00.7 -17 51 22.7 -17 31 37.1 -17 25 45.7 -17 19 54.8 -17 55 47.6 -18 08 44.2 -17 24 06.6 -18 02 54.7 -17 44 08.7 -17 36 26.2 -17 22 24.9 -17 24 14.6 -17 19 31.3 -18 13 50.5 -18 11 57.3 -17 47 29.8
Redshift 1.069 0.586 0.416 0.641 0.461 0.863 0.656 0.956 0.555 0.732 0.556 0.991 1.267 0.663 0.590 0.552 0.440 1.126 0.840 0.561 0.439 0.753 1.161 0.602 0.665 0.918 0.318 0.413 1.105 0.369 0.652 0.129 0.304 0.290 0.587 1.166 0.784 0.752 0.651 1.111 0.990 0.784 0.999 0.806 0.969 0.720 0.678 0.599 0.187 0.681
Quality flag 4 5 4 5 5 3 4 3 5 5 3 3 3 4 5 4 5 4 4 4 4 4 3 4 4 3 5 5 3 5 4 5 5 5 4 3 4 4 4 3 4 4 4 4 3 4 4 5 5 4