Cases and solutions
An efficient cost-sharing program to reduce nonpoint-source contamination: theory and an application to groundwater contamination C.S. Kim 7 G.D. Schaible 7 S.G. Daberkow
However, cost-sharing programs have been a traditional policy tool used to encourage producers to adopt resource conserving and/or environmentally beneficial agricultural practices. In response to increased public concern about nonpoint-source contamination, the U.S. Congress established as part of the 1996 Farm Act, the agricultural cost-share program known as the Environmental Quality Incentive Program (EQIP). Since nitrogen fertilizer is highly water-soluble, cost-share programs are primarily designed to encourage farmers to adopt water-conserving, contamination-reducing irrigation technologies. Cost-share programs typically are voluntary, with taxpayers (in the case of EQIP) subsidizing up to 75% of the selected project cost of the conservation or contamination-reducing practice or investment (in the case of structures or equipment). Financial assistance to farmers under EQIP is designed to ensure the maximum level of environmental benefits possible per public dollar expended. Recent research, however, has been somewhat critical of agricultural cost-share programs. Davies (1997) concluded that the voluntary nature of these incentive payment programs has not achieved much beyond good Key words Cost-share 7 Irrigation 7 Nitrogen intentions. Ervin (1997) argues that such policies have fertilizer 7 Nonjoint production not secured protection against excessive soil erosion or water contamination despite considerable outlays. Economists who have examined agricultural, nonpointsource contamination problems have viewed the producIntroduction tion process as a problem of joint production where both outputs, crops and nonpoint-source contamination, are A number of public policies and programs, such as regulproduced using the same nitrogen fertilizer inputs emations, taxes, crop land retirement, or technical assistance ployed by farmers (Anderson and others 1985; Larson are available to address agricultural resource contaminaand others 1996). However, Kim and others (1997, 1999) tion problems (US Department of Agriculture 1997). have demonstrated that in the case of nitrogen fertilizer use and groundwater irrigated agriculture, the production process is one of nonjoint production rather than joint production. Mis-specifying the production process results Received: 3 November 1998 7 Accepted: 15 February 1999 in overestimated economic benefits, and both supra-opti1 C.S. Kim (Y) 7 G.D. Schaible 7 S.G. Daberkow mum nitrogen fertilizer use and an increased stock of niResource Economics Division, Rm. 4056, Economic Research trates in groundwater. Service, US Department of Agriculture, 1800 M Street NW, A second issue associated with evaluating an agricultural Washington DC 20036-5831, United States, e-mail:
[email protected] cost-share program concerns the relative size of the cost 1 share between the government (taxpayers) and the indiThe views expressed are those of the authors and do not vidual farm operator. The adoption of a new agricultural necessarily represent the policies of the U.S. Department of technology or practice which reduces runoff or leaching Agriculture Abstract This research evaluates the economics of cost-sharing improved irrigation technologies to reduce agricultural, nonpoint-source contamination. Irrigation and fertilization inefficiencies are modeled within a nonjoint production process to evaluate both private and public costs of technology adoption and its effect on groundwater nitrate-contamination levels. A central Nebraska application indicates that even without a current government subsidy, a farmer is economically better off switching from gravity-flow to surge-flow irrigation rather than a center-pivot system. An annual government subsidy of $22.50 (US$) per hectare per year is required over the life of a center-pivot system to make the farmer financially indifferent. However, cost-sharing center-pivot adoption improves the groundwater contamination level, while other irrigation systems result in continued deterioration of groundwater quality.
Environmental Geology 39 (6) April 2000 7 Q Springer-Verlag
649
Cases and solutions
of an agri-chemical results in greater profits for the farmer, since less of the input is applied and increased resource efficiency can enhance productivity. Society also benefits from the adoption of a resource-conserving technology through the following: (1) a reduction in the opportunity costs associated with producer input-use inefficiency; (2) fewer resources devoted to cleaning the contaminated resource such as nitrate removal from drinking water; (3) improved human health or less demand for health service; and/or (4) lowered risk of ecological damage such as improved habitat for endangered species. Of course, all of these benefits must be weighed against the cost of adopting the new technology or practice. Presumably, if private benefits are sufficiently large relative to adoption costs, farmers will adopt the technology without a cost-share program. If private benefits are insufficient to encourage voluntary adoption, then the public sector may be justified in sharing the cost of adoption, particularly if the public plus private benefits exceed adoption costs. Quantifying the relative shares of public and private benefits from technology adoption then, are also critical economic concerns for any cost-share policy which aims to reduce agricultural-based nonpoint-source contamination. This paper sets out to examine rigorously the economics of a cost-share program as it may be applied to encourage adoption of technologies and/or practices intended to reduce the risks of groundwater and surface-water contamination associated with nitrogen fertilizer use in irrigated agriculture. Research results demonstrate that, under certain economic circumstances, both agricultural producers and society benefit from such programs. This paper begins by formally recognizing the nonjoint nature of irrigated agricultural production and agricultural resource contamination within the context of an economic framework. Then, a theoretical model is developed which captures both economic and environmental characteristics of the producer production decision process. The model allows one to derive the optimal government cost-share needed to encourage farmers to adopt improved irrigation technologies or practices intended to reduce nonpoint-source groundwater contamination. Finally, the model is used to quantify both the private and public benefits of adopting a specific technology designed to increase the use-efficiency of contamination-causing agricultural inputs. Factor-demand relationships for irrigation water and nitrogen fertilizer that correctly recognize input-use losses are used to identify farmer costs associated with input-use inefficiency, related social costs, and the economic benefits derived from reducing inputuse inefficiency. The model is then applied to farm-level data from Central Nebraska to evaluate the private and social economic benefits of government-subsidized irrigation technology investments and their effects on the groundwater contamination level. Because the adoption of an improved irrigation technology affects both the rate of leaching and the amounts of irrigation water and nitrogen fertilizer use, economic benefits of improved irrigation technology 650
Environmental Geology 39 (6) April 2000 7 Q Springer-Verlag
are evaluated for both irrigation water and nitrogen fertilizer use.
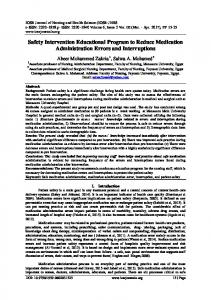
Nonjoint irrigated production technology A number of studies have examined the agricultural nonpoint-source contamination problem, recommending the use of taxing policies to encourage reduced use of contamination-causing agri-chemicals (Choi and Feinerman 1996; Fleming and others 1995; Hrubocak and others 1990; Kim and others 1993; Larson and others 1996; Shortle and Dunn 1986). However, these studies viewed the production process as a problem of joint production, where both crops and nonpoint-source contamination are produced using the same input quantity. This perspective can be mathematically expressed as: Ypf(n) and Zph(n), where Y is crop output, n is nitrogen fertilizer applied, and Z is nonpoint-source contamination. Unlike the case of burning coal that generates energy and smoke, the assumption of joint production associated with nitrogen fertilizer use is somewhat misleading. Traditional crop production functions assume that all variable inputs, including irrigation water and nitrogen fertilizers, are fully employed to produce crop output. However, a portion of applied nitrogen fertilizer is lost through leaching, runoff, denitrification or volatilization. Only a portion of applied nitrogen fertilizer is used for crop growth in the crop production process. Therefore, the crop production process and the generation of nonpointsource contamination is more appropriately characterized as a nonjoint production process, and for nitrogen fertilizer, can be represented as: Ypf(sn), Zph[(1–s)n], and Pr[snE(1–s)n]pf, where s is the fertilization efficiency coefficient, Pr is the probability operator, and f is the empty or null set. Estimation of a crop response function to nitrogen fertilizer assumes that crop production and groundwater contamination from nitrates are characterized as nonjointness in input quantities (Kohli 1983). If the crop production and groundwater contamination are characterized as jointness in output, a crop production function can not be estimated (Shumway and others 1983). Figure 1 demonstrates the conceptual difference between joint and nonjoint production perspectives. The production of crop and nonpoint contamination in agriculture is nonjoint because given an input application technology, the total nitrogen fertilizer use is allocated between two separate production processes, one for crop-growth/output and one which results in nonpoint contamination. Recognizing the unique character of agricultural production is particularly important when evaluating the economic effects of public sector conservation or environmentallyconscience programs. The following model structure accounts for this unique production process by differentiating, for both irrigation water and nitrogen fertilizer, ap-
Cases and solutions
man and Evenson 1989; Shumway 1983). This functional specification imposes homogeneity in prices and is selfdual. Furthermore, the normalized-quadratic profit function is as good as any other flexible functional form of a profit function with respect to Allen-Uzawa partial-substitution elasticities or price and fixed-factor elasticities (Thomson and Langworthy 1989). More importantly, the factor demand functions derived from the normalizedquadratic profit function are linear. The use of linear irrigation water and nitrogen fertilizer demand functions, as in the case of this paper, are easily tractable mathematically. Irrigation water There are both farmer and social costs associated with farm-level irrigation inefficiency (Kim and Schaible 1997). To evaluate these costs and to estimate the economic benefits of improved irrigation efficiency at the farm-level, the following discussion first identifies the difference between consumptive and applied irrigation water demand functions. Second, the discussion then correctly specifies economic benefits to a farmer for irrigation water use, and finally, a measure identifies the social costs and total economic benefits associated with a farmer shifting from an existing to an improved irrigation technology. To begin with, let the crop-water production relationship for a farmer based on irrigation water applied be quadratic as follows: Y(Wi)paWiP(b/2)Wi 2, a,b 1 0, dY/dWi 1 0 and d 2Y/dWi 2~0 Fig. 1 Joint and nonjoint production technologies
plied input use between crop-growth consumptive use and nonpoint contamination.
for ip1, 2,...m, where Y is output and Wi is the amount of irrigation water applied with the ith irrigation technology. The irrigation water demand function associated with the ith irrigation system is obtained from Eq. 1 as follows: PwpPY [dY(Wi)/ dWi]pPY [aPbWi]
Economic benefits from adoption of an improved irrigation technology The model development begins with the estimation of a crop response function to irrigation water and nitrogen fertilizer. Even though some evidence indicates that plant-level crop response functions may be more correctly estimated by the von Liebig model (Ackello-Ogutu and others 1985), aggregate production functions for estimating crop response across fields or regions with heterogeneity or nonuniformities in the distribution of inputs, such as irrigation water and nitrogen fertilizer, will result in smooth nonlinear functions that are concave with positive marginal products (Berck and Helfand 1990). Consequently, the normalized-quadratic profit function has been frequently used to characterize the economic benefits (returns) of agricultural production technology (Huff-
(1)
(2)
where Pw is the marginal benefit of Wi, and PY is output price. While the crop production function in Eq. 1 assumes that all irrigation water applied, Wi, is fully employed in the production process, only a portion of the irrigation water applied is actually used (consumed) for crop growth. To derive a consumptive water demand function, consistent with a nonjoint production perspective, let Wc be the crop’s consumptive-use quantity of irrigation water, such that: WcpgiWi for ip1, 2, ... m,
(3)
where gi (0~gi~1) is a coefficient of irrigation efficiency associated with the ith irrigation system. Since the actual crop-water production relationship must be correctly specified in terms of consumptive irrigation water use, Eq. 3 is inserted into Eq. 1 and is represented as follows: Y(Wc)p(a/gi)WcP(b/2gi 2)Wc 2 for ip1, 2, ... m, dY/dWc 1 0 and d 2Y/dWc 2~0.
(4)
Environmental Geology 39 (6) April 2000 7 Q Springer-Verlag
651
Cases and solutions
mated from the applied irrigation water demand function in Eq. 2, or equivalently Eq. 7, are represented as follows:
The irrigation water demand function obtained from Eq. 4 is then represented by: PwpPY [dY(Wc)/ dWc] [dWc / dWi] pPY [aP(b/ gi)Wc], for ip1, 2, ..., m.
(5)
(6)
Second, using information from Eqs. 3 and 6, the applied irrigation water demand function in Eq. 2 can be represented in generalized form as follows: Pwpa0–(gibc)Wi, pa0–biWi where bipbPYpgibc for ip1, 2, ..., m.
(7)
These farm-level water demand functions can be represented graphically. The curve ADc in Fig. 2 represents the farmer’s consumptive irrigation water demand function for the ith irrigation system presented in Eq. 5, or equivalently Eq. 6. The curve ADi represents the irrigation water demand function based on the amount of irrigation water applied with the ith irrigation system as represented in Eq. 2, or equivalently Eq. 7. Economic benefits resulting from irrigation water use are measured with Eq. 6, represented by the area underneath the curve ADc, regardless of the type of irrigation technology, as follows: Wc
B(Wc : Pw)p # [a0–bcx] dx
(9)
0
To generalize the relationship between the consumptive and applied irrigation water demand functions, first let the consumptive irrigation water demand function (5) be rewritten as follows: Pwpao–bcWc, where aopaPY and bcp(b/gi)PY.
Wi
B(Wi : Pw)p # [a0–bix] dx
(8)
0
p[a0Wc–(bc /2)(Wc) 2], or equivalently, pgi [a0Wi–(gibc /2)Wi2] from Eq. 3, pgi [a0Wi–(bi /2)Wi2] (ip1, 2, ..., m),
p[a0Wi–(bi /2)Wi2] for ip1, 2, ..., m, which represents the area 0ADi in Fig. 2. By comparing Eqs. 8 and 9, one can derive the following condition (Kim and others 1997; Kim and Schaible 1997): B(Wc : Pw)pgiB(Wi : Pw) for ip1, 2,...m. This result indicates that economic benefits estimated using an irrigation water demand function based on applied water as presented in Eq. 7, and measured by the area 0ADi in Fig. 2, would be overestimated by a portion attributable to the irrigation water lost through runoff, evaporation and leaching, or the rate of irrigation inefficiency, (1–gi). This result also implies that there are losses in economic benefits, equivalent to (1–gi)B(Wi:Pw), as a result of the irrigation inefficiency associated with the ith irrigation system. For a given per unit cost of irrigation water Cw ($ per hectare-meter), total economic benefits resulting from irrigation water use (for an irrigation system) are represented by the area 0AEWc and associated irrigation water costs are represented by the area 0CwFWi, so that net economic benefits resulting from this irrigation water use are represented by the area CwAE less the area WcEFWi. Total costs resulting from the irrigation inefficiency associated with the ith irrigation system are represented by the area WcEAFWi, which is the sum of social opportunity costs (the area EAF) and additional farmer costs (the area WcEFWi). The area WcEFWi, which represents the farmer’s increased water costs due to the inefficiency associated with the ith irrigation technology, ICFw(i), is measured from Fig. 2 as follows:
where x is the variable of integration and bcpbi/gi from Eq. 7. Economic benefits presented in Eq. 8 represents the ICFw(i)pCw(Wi–Wc)pCw(1–gi)Wi from Eq. 3, pCw(a0–Cw)[(1–gi)/bi] from Eq. 7 for ip1, 2, ..., m. area 0ADc in Fig. 2. Economic benefits, B(Wi : Pw), esti-
(10)
Since theory tells us that economic surplus generated from activity in an input market measures scarcity rents to producers plus consumer’s surplus in the product market under general-equilibrium competitive conditions (Just and Hueth 1979), the area EAF represents social benefits foregone or net social economic costs, NSCw(i), resulting from the irrigation inefficiency associated with the ith irrigation technology. This cost is measured from Fig. 2 as follows: NSCw(i)p0.5(A–Cw)(Wi–Wc) p0.5(a0–Cw)(1–gi)Wi where Apa0, p0.5(a0–Cw) 2 [(1–gi)/bi] from Eq. 7 for ip1, 2, ..., m.
Fig. 2 The consumptive-use irrigation water demand curve (Dc), and the irrigation water demand curve (Di) based on an application rate
652
Environmental Geology 39 (6) April 2000 7 Q Springer-Verlag
(11)
Consequently, total economic costs resulting from the irrigation inefficiency associated with the ith irrigation technology, TCw(i), are defined as the sum of the additional water costs to farmers presented in Eq. 10 and the net social economic costs presented in Eq. 11, and are represented as follows:
Cases and solutions
TCw(i)pICFw(i)cNSCw(i) p0.5[a02–Cw2 ][(1–gi)/bi] for ip1, 2, ..., m.
(12) trient cycle, is derived from Eq. 17 and is represented as follows:
Now assume that there are two irrigation technologies, i and j, where the jth irrigation system is associated with an improved irrigation technology. Economic benefits to farmers, EBFw(ij), resulting from reducing irrigation water costs as a result of switching to the jth irrigation system from the ith system are represented by:
PnpPY [dY(nickiN)/ dni] pPY[(a–bkiN)–bni] for ip1, 2, ..., m,
(18)
where Pn represents the marginal benefits resulting from nitrogen fertilizer use. Similar to irrigation water use, not all applied nitrogen fertilizer is consumptively used by the crop-growth proc(13) ess. Therefore, when the crop production function in EBFw(ij)pICFw(i)–ICFw(j) pCw(a0–Cw)[(1–gi)/bi–(1–gj)bj]. Eq. 17 is correctly specified based on consumptive nitrogen fertilizer use, the production for the ith irrigation sysThe reduction in net social economic costs, or equivaltem is represented as follows: ently the net social economic benefits, NSBw(ij), as a result of switching to the jth irrigation system from the ith Y(n cs k N)pa[(n cs k N)/s ]–(b/2)[(n cs k N/s ] 2 c i i c i i i c i i i irrigation system, are estimated by: for ip1, 2, ..., m. (19) NSBw(ij)pNSCw(i)–NSCw(j) p0.5(a0–Cw) 2 [(1–gi)/bi–(1–gj)bj].
(14)
Finally, total economic benefits, TEBw(ij), resulting from switching to the jth irrigation system from the ith system are represented by: TEBw(ij)pEBFw(ij)cNSBw(ij) p0.5(a02–Cw2 )[(1–gi)/bi–(1–gj)bj].
(15)
Nitrogen fertilizer Since nitrogen fertilizer is highly water soluble, the amount of nitrogen fertilizer lost through leaching and runoff depends largely on the adopted irrigation technology in irrigated crop production, as well as other factors such as soil type and topography, which affect the amounts of both irrigation water and nitrogen fertilizer applied in crop production. For those areas where groundwater is the primary water source for irrigation, nitrates in groundwater are another source of nitrogen for crops. Therefore, the nutrient cycle must be considered in farm-level economic analysis associated with the nonpoint-source groundwater contamination problem (Kim and others 1996). Let ni and nc be the amount of nitrogen fertilizer applied with the ith irrigation system and the consumptive use of nitrogen fertilizer, respectively, such that: ncpsini for ip1, 2, ..., m,
(16)
where si (0~si~1) is a coefficient of fertilization efficiency associated with the ith irrigation technology. Furthermore, let the estimated crop nitrogen-fertilizer production function be quadratic in the amount of nitrogen fertilizer use, and represented as follows:
The consumptive nitrogen-fertilizer demand function associated with the nutrient cycle then, is obtained from Eq. 19 and represented by: PnpPY[dY(nccsikiN)/ dnc][dnc / dni] pPY[a–bkiN–(b / si)nc] for ip1, 2, ..., m.
(20)
Research demonstrates that, even when the nutrient cycle is accounted for, economic benefits estimated using a nitrogen-fertilizer demand function based on application would be overestimated by the portion of nitrates lost through runoff, denitrification and leaching (Kim and others 1997, 1999). That is, B(nccsikiN : Pn)p siB(nickiN : Pn). This relationship can be shown by first integrating the consumptive nitrogen-fertilizer demand function presented in Eq. 20, resulting in: nc
B(nccsikiN : Pn)pPY # [(a–bkiN)–(b/si)x] dx
(21)
0
pPY[(a–bkiN)nc–(b/2si)nc2] psiPY[(a–bkiN)ni–(b/2)ni2] for ip1, 2, ..., m, where ncpsini from Eq. 16 and x is the variable of integration. Second, the integration of the applied nitrogenfertilizer demand function, as presented in Eq. 18, results in the following: ni
B(nickiN : Pn)pPY # [(a–bkiN)–bx]dx
(22)
0
pPY[(a–bkiN)ni–(b/2)ni2] for ip1, 2, ..., m.
Then, after comparing Eqs. 21 and 22, the results indicate that si times B(nickiN : Pn) from Eq. 22 equals B(nccbsikiN : Pn) from Eq. 21. (17) To generalize the relationship between the consumptive Y(nickiN)pa(nickiN)–(b/2)(nickiN) 2, and applied nitrogen-fertilizer demand functions, first let where a and b are nonzero positive constants, ki is a fractional coefficient which measures the ratio of the irri- the consumptive nitrogen-fertilizer demand function pregation water applied per hectare (using the ith irrigation sented in Eq. 20 be rewritten as follows: technology) to the amount of groundwater available per Pnpa0–bcnc, where aopPY(a–bkiN) and bcpPY(b/si). hectare from the underlying aquifer, and N is the stock (23) of nitrates in groundwater. The nitrogen fertilizer deSecond, the applied nitrogen-fertilizer demand function mand function associated with the ith irrigation system, from Eq. 18 is rewritten in similar terms to allow a more based on nitrogen applied and accounting for the nu-
Environmental Geology 39 (6) April 2000 7 Q Springer-Verlag
653
Cases and solutions
general comparison with the consumptive nitrogen-fertilizer demand function presented in Eq. 23 as follows: Pnpao–(sibc)ni.
(24)
These more general, fertilizer factor-demand relationships can then be used to identify increased farmer costs associated with fertilization inefficiency, and the economic benefits for a farmer and society associated with increased fertilization efficiency. Increased fertilization costs to a farmer, ICFn(i), resulting from the fertilization inefficiency associated with the ith irrigation technology is estimated by: ICFn(i)pCn[ni-nc]pCn(1–si)nipCn(ao–Cn)[(1-si)/sibc], (25) where Cn is a per unit cost of nitrogen fertilizer. Meanwhile, the net social economic cost, NSCn(i), resulting from the fertilization inefficiency associated with the ith irrigation technology is estimated by: NSCn(i)p0.5(a0–Cn)(ni–nc) p0.5(a0–Cn) 2 [(1–si)/ sibc].
(26)
Therefore, the total economic cost resulting from the fertilization inefficiency associated with the ith irrigation technology, TCn(i), is defined as follows: TCn(i)pICFn(i)cNSCn(i)p0.5(a02–Cn2)[(1–si)/ sibc]. (27) Now, to estimate economic benefits of improved technology embodying improved fertilization efficiency, again assume that there are two alternative irrigation technologies i and j, where the jth irrigation system is associated with an improved irrigation technology. Then, the economic benefits to a farmer, EBFn(ij), resulting from the reduction of nitrogen fertilizer use as a result of switching to the jth irrigation technology from the ith technology are represented as follows: EBFn(ij)pICFn(i)–ICFn(j) pCn[(a0–Cn)[(1–si)/ sibc–(1–sj)/ sjbc].
(28)
The net social economic benefits of improved fertilization efficiency, NSBn(ij), resulting from switching from the ith to the jth irrigation technology are represented by: NSBn(ij)pNSCn(i)–NSCn(j) p0.5(a0–Cn) 2[(1–si)/sibc–(1–sj)/ sjbc].
(29)
Aggregate total economic benefits to farmers alone of improved water and fertilization efficiency, TEBFwcn, are represented by: TEBFwcn(ij)p[EBFw(ij)cEBFn(ij)] pCw(a0–Cw)[(1–gi)/bi–(1–gi)bj] cCn(a0–Cn)[(1–si)/sibc–(1–sj)/sjbc].
(32)
These results indicate that in cases where the sum of increased capital costs and reduced net operating and maintenance costs associated with the adoption of an improved irrigation technology, K(ij), is less than the aggregate total economic benefit to a farmer as presented in Eq. 32, a regulatory policy would likely be effective by penalizing those farmers not adopting an improved irrigation technology. On the other hand, in cases where the sum of increased capital costs and reduced net operating and maintenance costs for an improved irrigation system are greater than TEBFwcn(ij) in Eq. 32, but less than total economic benefits to farmers and society presented in Eq. 31, a farmer would be willing to incur additional costs, but only up to an amount equivalent to TEBFwcn(ij) in Eq. 32. In this situation, the farmer remains financially indifferent toward adoption of the improved irrigation technology if additional costs associated with the adoption of an improved irrigation technology, K(ij), greater than TEBFwcn(ij), are financed by the government. In those cases where additional costs to farmers, K(ij), are greater than the aggregate total economic benefits to farmers and society, as presented in Eq. 31, the farmer would remain willing to pay only additional costs equivalent to TEBFwcn(ij) in Eq. 32, and still remain financially indifferent, while the government pays all remaining costs, even those costs greater than TEBFwcn(ij). The cost-share between the government and farmers that encourages the technology adoption resulting in improved irrigation water use and fertilization efficiency is then given by: Government cost sharep[K(ij)–TEBFwcn(ij)]/K(ij), iff TEBFwcn(ij)~K(ij).
Irrigation technology selection and its effects on groundwater quality
(33)
Total economic benefits of improved fertilization efficiency, TEBn(ij), resulting from switching from the ith to the For a given soil type and topography, the amount of nijth irrigation system are represented by: trogen fertilizer lost through leaching depends largely on (30) the adopted irrigation technology. Therefore, the fertilizaTEBn(ij)pEBFn(ij)cNSBn(ij) p0.5(a02–Cn2)[(1–si)/sibc–(1–sj)/sjbc]. tion efficiency coefficient also changes as a result of the adoption of an improved irrigation technology. Let the Finally, aggregate total economic benefits for the farmer change in the stock of nitrates in groundwater, N˙, be repand society of improved water and fertilization efficiency, resented by the following system of first-order differential TEBwcn(ij), resulting from the adoption of an improved equations: irrigation technology are represented as follows: (34) N˙i(t)pti[ni(t)ckiNi(t)]–riNi(t) for ip1, 2, ..., m, (31) TEBwcn(ij)pTEBw(ij)cTEBn(ij) 2 2 where the subscript i represents the ith irrigation techp0.5[(a 0–Cw )[(1–gi)/bi–(1–gj)bj] nology, ti represents the rate of nitrate leaching assoc(a02–Cn2)[(1–si)/sibc–(1–sj)/sjbc]]. 654
Environmental Geology 39 (6) April 2000 7 Q Springer-Verlag
Cases and solutions
ciated with the ith irrigation technology such that ti~(1–si), and r represents the rate of nitrate discharge from the stock of nitrates in groundwater, which is the sum of natural nitrate discharge due to groundwater flows and the rate of artificial nitrate discharge through pumping groundwater for irrigation. It is assumed in the hydrologic Eq. 34 that the leaching of nitrates into the groundwater would occur instantly. This is not an unusual occurance in many irrigated areas. In watershed areas underlaid by a shallow aquifer, particularly when the area is defined by sandy loam soils, the stock of nitrates in groundwater are often immediately affected after fertilization. This assumption is relevent here because a shallow aquifer underlying a watershed area with sandy loam soils defines the study area in the following empirical analysis. Furthermore, within the context of a competitive dynamic model of nitrogen fertilizer use, the omission of the time lag would affect neither the rate of fertilizer application nor the stock of nitrates in groundwater. Let the fertilization efficiency be represented by sip(1–ti–ri), where ri is the rate of nitrate loss through runoff and denitrification. Substituting Eq. 18 for applied nitrogen fertilizer demand for the ith irrigation system, ni(t), into Eq. 34 results in the following change in nitrate stocks: (35) N˙i(t)pti[(aPY–Cn)/sibc]–riNi(t) for ip1, 2, ..., m. Then the time path of nitrate accumulation in groundwater is determined by solving the first-order differential Eq. 35 as follows: Ni(t)puic(No–ui) exp(–ri)t for ip1, 2, ..., m,
(36)
where NopN(tp0) and uip[ti(aPY–Cn)/risibc]. Finally, the nitrate concentration level at the end of each irrigation system’s life expectancy can be estimated by inserting area-specific economic and geohydrologic data into Eq. 36. The change in aquifer nitrate concentration levels associated with improved irrigation technologies will demonstrate water quality impacts. The time path of nitrogen fertilizer application is then obtained by inserting Ni(t) from Eq. 36 into Eq. 18 and deriving ni(t) as follows: ni(t)p[(a/b)–Cn/(bPY)–kimi]cki(No-mi) exp(–ri)t for ip1, 2, ..., m.
(37)
Application to Merrick County, Nebraska The study area is located in Merrick county, Nebraska, where the observed nitrate concentration level in groundwater on average was 18.7 parts per million (ppm), according to a survey conducted by the Central Platte Natural Resources District (CPNRD) during the 1988–1990 period. Economic and geohydrologic data for the study area are presented in Table 1. The hydrologic data are obtained from Bentall (1975a, b); Exner and Spalding (1976) and Signor and others (1996). Data on the irriga-
tion efficiency coefficients are obtained from Williams and others (1997). Data on groundwater quality, groundwater pumping costs, the amounts of nitrogen fertilizer and irrigation water applied during the period between 1988 and 1990 are obtained from a survey conducted by the CPNRD during the same period. Data on prices for corn and soybeans are from various volumes of Agricultural Statistics, National Agricultural Statistics Service, USDA. Nitrogen fertilizer price data are from Vroomen and Taylor (1992). The fertilization efficiency coefficient associated with the ith irrigation technology is assumed to be identical with its irrigation efficiency coefficient for two reasons. First, estimates of irrigation water and nitrogen fertilizer losses through runoff and leaching from the Erosion Productivity Impact Calculator (EPIC) simulation model were unreliable, and second, nitrates are highly soluble and deep percolation into the aquifer generally carry only soluble substances due to the fact that the soil acts as a filter for the percolating water (Porter 1975). Examination of EPIC-based simulation studies confirms these conclusions. The EPIC simulation model was recently used to estimate rates of nitrate leaching as well as fertilization efficiency coefficients (Chowdhury and Lacewell 1996; Larson and others 1996; Magleby and others 1995; Wu and others 1994). These authors conducted EPIC simulation runs at different fertilizer application levels for each combination of crop, soil type, and irrigation system. Each EPIC simulation run generated crop yield, the amounts of irrigation runoff and percolations, as well as the amounts of nitrogen fertilizer lost through runoff and leaching. Estimates of the amounts of nitrogen fertilizer lost through runoff and leaching were then regressed with the amounts of irrigation water and nitrogen fertilizer applied, which were used to estimate the rates of nitrate leaching and runoff. EPIC estimates for the amounts of irrigation water and fertilizer lost through runoff and leaching are somewhat variable. For instance, EPIC simulation results revealed that more than 77% of irrigation water applied with a conventional furrow irrigation system would be lost through percolation on a mid-Nebraska 15 county area with crete silt loam soil (Magleby and others 1995). Furthermore, EPIC results also showed that a great portion of irrigation water applied would be lost through runoff when using a conventional furrow irrigation system on silt roam soil. Therefore, the reliability of the EPIC estimates for the fertilization efficiency rate associated with the unreasonable rates of irrigation efficiency would be questionable. Since most acreage in the CPNRD are allocated to continuous corn production to meet local feed demand for livestock production, we employed a multiple inputs – single output normalized profit function (Huffman and Evenson 1989; Shumway 1983) to estimate the supply of corn, the demand for nitrogen fertilizers, and the demand for irrigation groundwater. Pooled data for the period 1960–1990 was grouped for Buffalo, Hall, and Merrick counties which are located within the Nebraska Mid-State area (Kim and others 1999). The normalized price elasti-
Environmental Geology 39 (6) April 2000 7 Q Springer-Verlag
655
Cases and solutions
Table 1 Economic and hydrologic parameters pertaining to Merrick county, Nebraska Symbol description a0 bc b1 b2 b3 b4
Per hectare inverse water demand intercept The slope of consumptive water demand The slope of water demand with a furrow irrigation system The slope of water demand with a tail-water recovery irrigation system The slope of water demand with a surge-flow irrigation system The slope of water demand with a center-pivot irrigation system
1.37818 1.55783 1.01259 1.13722 1.16837 1.32416
ao bc b1 b2 b3 b4
Per hectare inverse nitrogen fertilizer demand intercept The slope of consumptive N-fertilizer demand The slope of N-fertilizer demand with a furrow irrigation system The slope of N-fertilizer demand with a tail-water recovery system The slope of N-fertilizer demand with a surge-flow irrigation system The slope of N-fertilizer demand with a center-pivot irrigation system
1.4980 0.00984 0.00640 0.00718 0.00738 0.00836
v m No PY Wi Cw ni Cn
Saturated thickness (m) Specific yield a The stock of nitrates in the underlying aquifer at the base year (kg/ha) Unit price of corn ($/l) The observed (average) amount of irrigation water use (m/ha) b Variable cost of pumping one hectare-meter of groundwater ($) The observed amounts of nitrogen fertilizer use (kg/ha) Unit cost of nitrogen fertilizer ($/kg)
gi or si
Irrigation efficiency coefficient and fertilization efficiency ip1 for a conventional furrow irrigation system ip2 for a tail-water recovery irrigation system ip3 for a surge-flow irrigation system ip4 for a center pivot irrigation system
0.65 0.73 0.75 0.85
ti
The rate of leaching ip1 for a conventional furrow irrigation system ip2 for a tail-water recovery irrigation system ip3 for a surge flow irrigation system ip4 for a center pivot irrigation system
0.23 0.27 0.15 0.09
The rate of artificial discharge (ri) or the ratio of the irrigation water applied per acre to the amount of groundwater available per acre from the underlying aquifer (ki) ip1 for a conventional furrow irrigation system ip2 for a tail-water recovery irrigation system ip3 for a surge flow irrigation system ip4 for a center pivot irrigation system
0.0375 0.0334 0.0325 0.0287
ri or ki
656
Parameter value
45.72 0.25 715.5 0.0653 0.991 0.293 161.56 0.38
a Specific yield is defined as the unitless ratio of the volume of water a saturated rock or soil will yield under the influence of gravity to its own volume (Cleary and others 1992)
b Estimated based on 32% of total irrigated land for corn production in the CPNRD during 1989–1990 using sprinkler irrigation systems (primarily center pivots), and the remainder using primarily conventional furrow irrigation
cities of applied irrigation water and nitrogen fertilizer demands are estimated to be –0.27 and –0.34, respectively. Using these estimated price elasticities, parameters for both consumptive and applied per hectare irrigation water demand and per hectare nitrogen fertilizer demand functions are estimated using the procedure specified in Kim and others (1999), along with the efficiency, water use, and irrigation statisitcs presented in Table 1. Social, as well as economic benefits to a farmer resulting from the adoption of an improved irrigation technology are estimated using the data for the study area presented in Table 1. Results are presented in Table 2. Results indicate that a farmer would be economically better off ad-
opting a tail-water recovery irrigation system or a surgeflow irrigation system even without a government subsidy. These results are consistent with those reported by Williams and others (1997). The results also demonstrate that the aggregated total economic benefits for a farmer, TEBFwcn, that are associated with the adoption of a center-pivot irrigation system are not large enough to offset its higher capital costs. These results most likely explain the reason why the adoption of a center-pivot irrigation system in the study area has been sluggish. The minimum government cost-share required to encourage the adoption of a center-pivot irrigation system is estimated to be $22.55 (US$) per hectare per year (Table 2).
Environmental Geology 39 (6) April 2000 7 Q Springer-Verlag
Cases and solutions
Table 2 Economic benefits resulting from the adoption of improved irrigation technologies Irrigation System Tail-water recovery
Surge-flow
Center-pivot
($/hectare) a EBFw NSBw TEBw
1.7665 3.2710 5.0375
2.1503 3.9823 6.1325
3.8113 7.0578 10.8690
EBFn NSBn TEBn
7.1145 10.4625 17.5770
8.6743 12.7563 21.4305
15.4105 22.6625 38.0730
TEBFwcn NSBwcn TEBwcn
8.8810 13.7335 22.6145
10.8245 16.7385 27.5630
19.2218 29.7203 48.9420
4.83
4.83
59.98
(A) Annuity of capital investment costs over furrow irrigation system (5% discount rate) b (B) Annual labor and system maintenance costs over furrow irrigation system c
P11.90
P12.85
P18.20
(C) Rows (A)c(B)
P 7.07
P 8.03
41.78
15.95
18.85
P22.55
(D) TEBFwcn–(C) a
c Annual labor and system maintenance costs are assumed to be $1.10/ha–cm ($47.23/ha), $0.93/ha–cm ($35.33/ha), $0.93/ha–cm ($34.38/ha), and $0.88/ha–cm ($29.03/ha) for a conventional furrow, a tail-water recovery, surge-flow, and a low-pressure center pivot irrigation system, respectively (Williams and others 1997)
All prices are represented by the 1990 price Capital investments for a conventional furrow, a tail-water recovery system, a surge-flow system and a center pivot irrigation system are assumed to be $587.5/ha, $637.5/ha, $637.5/ha and $1,210/ha, respectively (Williams and others 1997). A life expectancy of 15 years is assumed for each system b
Table 3 Trajectories for the stock of nitrates in groundwater, Ni(t) Irrigation technology
Conventional furrow irrigation system Tail-water recovery irrigation system Surge-flow irrigation system Center-pivot irrigation system
Ni(t)puicviexp[–wit]
Ni(tp15)
ui
vi
wi
(kg/hectar)
ppm
1227.99 1441.14 800.87 480.13
P512.49 P725.64 P 85.37 235.37
0.0375 0.0334 0.0325 0.0287
935.83 1001.30 748.27 632.99
24.47 26.18 19.56 16.55
Extending this analysis using Eq. 36, the time path of nitrate accumulation in groundwater is estimated for each irrigation technology and presented in Table 3. Most major components of each irrigation system are assumed to have a 15-year life expectancy (Williams and others 1997), so that the amounts of nitrate accumulation in groundwater after the 15-year period are estimated by irrigation system as follows: N1(tp15)p935.83 kg (24.47 ppm) for a conventional furrow irrigation system; N2(tp15)p1,001.30 kg (26.18 ppm) for a tail-water recovery system; N3(tp15)p748.27 kg (19.56 ppm) for a surgeflow irrigation system; and N4(tp15)p632.99 kg (16.55 ppm) for a center-pivot irrigation system. These results indicate that the groundwater contamination level would deteriorate (nitrates in terms of ppm in-
crease) at a faster rate with a tail-water recovery system alone. This result is expected because while a tail-water recovery system has a higher irrigation efficiency than a conventional furrow system (0.73 vs. 0.65), it also has a higher rate of leaching than a conventional furrow system (0.27 vs. 0.23). Even the groundwater contamination level with a surge-flow irrigation system would continue to deteriorate, but at a decreasing rate. Only the center-pivot, sprinkler irrigation system reduces the groundwater contamination level from 18.7 ppm to 16.55 ppm after 15 years. Currently, farmers in the CPNRD who adopt a surge-flow irrigation system can share the cost of such a system with the CPNRD. However, the CPNRD does not subsidize farmers for adopting a sprinkler irrigation system.
Environmental Geology 39 (6) April 2000 7 Q Springer-Verlag
657
Cases and solutions
From a social-economic perspective, these results imply that it would be economically efficient and environmentally beneficial for the government (public sector) to costshare the adoption of center-pivot irrigation systems rather than surge-flow irrigation systems. Furthermore, given the likelihood of even additional social benefits (not measured here) associated with safe drinking water supplies, as well as from potential ecological enhancement where hydrologic relationships may impact downstream flows, these results justify a government costshare greater than the aggregate private (producer) economic benefits less the additional producer costs. In other words, results here likely justify an actual government cost share for this study area greater than $22.55 (US$) per hectare per year.
While farmers in the CPNRD who adopt a surge-flow irrigation system can share the cost of such a system with the CPNRD, the CPNRD does not subsidize farmers for adopting a sprinkler irrigation system. Results indicate that from a competitive economic efficiency perspective (without a government subsidy), a farmer would be economically better off adopting a surge-flow irrigation system. Economic benefits resulting from improving irrigation inefficiency are large enough to cover the capital costs associated with a surge-flow irrigation system, even though the groundwater contamination level with a surge-flow irrigation system continues to deteriorate, but at a decreasing rate. However, economic benefits resulting from the adoption of a center-pivot irrigation system are not large enough to offset its higher capital costs. Results indicate that a government subsidy of $22.55 (US$) per hectare per year is needed for farmers to adopt a center-pivot irrigation system and to remain financially Conclusion indifferent, but the groundwater contamination level would improve from 18.7 ppm to 16.55 ppm after 15 Most research in environmental economic policy analysis years. The groundwater contamination level with a conassociated with nonpoint-source groundwater contamina- ventional furrow irrigation system would be 24.47 ppm tion from nitrogen fertilizer use have assumed that the after a 15-year life expectancy of the irrigation system. production process of crop output and nonpoint-source Consequently, these results imply that from a social percontamination is a joint production process. As a conse- spective, it would be economically efficient and environquence, economists have failed to recognize the losses in mentally beneficial for the government to cost-share the economic benefits associated with both irrigation and fer- adoption of center-pivot irrigation systems rather than tilization inefficiencies. Results from this study demonsurge-flow irrigation systems. In addition, human health strate that irrigation and fertilization inefficiencies gener- and ecological benefits could possibly justify a governate economic costs to society and farmers, but that the ment cost share greater than $22.55 (US$) per hectare per economic losses due to these inefficiencies decline as a year. result of adopting improved irrigation technologies. FurAcknowledgements The authors thank the reviewers of this pathermore, results also demonstrate that there are environmental as well as economic reasons for a government per for their helpful suggestions. cost-share program by characterizing the crop production process and the generation of nonpoint-source contamination as a nonjoint production process. This paper evaluates the current EQIP cost-share program perspective associated with the voluntary adoption References of an improved irrigation technology to reduce the risks of groundwater contamination from agricultural producAckello-Ogutu C, Paris Q, Williams WA (1985) Testing a tion acitivity. Since the adoption of an improved irrigavon Liebig crop response function against polynomial specifition technology affects both the rate of leaching and the cation. Am J Agric Econ 67 : 873–880 amounts of irrigation water and nitrogen fertilizer use, Anderson GD, Opaluch JJ, Sullivan WM (1985) Nonpoint the economic benefits resulting from the adoption of an agricultural pollution: pesticide contamination of groundwater supplies. Am J Agric Econ 67 : 1238–1243 improved irrigation technology are evaluated for both irBentall R (1975a) Hydrology Nebraska Mid-State Division, rigation water and nitrogen fertilizer use. The effects on Pick-Sloan Missouri Basin Program, and associated area. Inthe nitrate contamination level of adopting an improved stitute of Agriculture and Natural Resources, University of irrigation technology are also evaluated under the asNebraska-Lincoln, Lincoln NE sumption that the fertilization efficiency coefficient asso- Bentall R (1975b) Physiograph, geology, soils, agriculture: Neciated with each irrigation technology is identical with its braska Mid-State Division. Institute of Agriculture and Natuirrigation efficiency coefficient. Considering the fact that ral Resources, University of Nebraska-Lincoln, Lincoln NE Berck P, Helfand G (1990) Reconciling the von Liebig and nitrates are highly soluble and deep percolation into an differentiable crop production functions. Am J Agric Econ aquifer generally will carry only soluble substances (Port72 : 985–996 er 1975), and that EPIC estimates for concurrent rates of Choi EK, Feinerman E (1996) Regulation of nitrogen polluboth irrigation and fertilization inefficiencies are unreliation: taxes versus quotas. J Agric Resour Econ 20 : 122–134 ble, the rate of irrigation efficiency may be considered a Chowdhury M, Lacewell R (1996) Implications of alternative reasonable proxy for the rate of fertilization efficiency for policies on nitrate contamination of groundwater. J Agric the study area. Appl Econ 21 : 82–95 658
Environmental Geology 39 (6) April 2000 7 Q Springer-Verlag
Cases and solutions
Cleary R, Miller D, Pinder G (1992) The Princeton course: groundwater pollution and hydrology. Groundwater Associates of Princeton, Princeton, NJ Davies T (1997) Voluntary incentives are no shortcut to pollution abatement. Resources, Resources for the Future, Issue 126, 2 pp Ervin D (1997) The environment and agriculture: reading the evidence and rethinking policy. Choices, Second quarter:1 Exner M, Spalding R (1976) Groundwater quality of the Central Platte Region, 1974. Institute of Agriculture and Natural Resources, The University of Nebraska-Lincoln, Lincoln NE Fleming RA, Adams RM, Kim CS (1995) Regulating groundwater pollution: effects of geophysical response assumptions on economic efficiency. Water Resour Res 31 : 1069–1076 Hrubocak J, LeBranc M, Miranowski J (1990) Limitations in evaluating environmental policy coordination benefits. Am Econ Rev 80 : 208–212 Huffman WE, Evenson RE (1989) Supply and demand functions for multiproduct U.S. cash grain farms: biases caused by research and other policies. Am J Agric Econ 71 : 761–773 Just RE, Hueth DL (1979) Welfare measures in a multimarket framework. Am Econ Rev 69 : 947–954 Kim CS, Hostetler JE, Amacher G (1993) The regulation of groundwater quality with delayed responses. Water Resour Res 29 : 1369–1377 Kim CS, Sandretto CL, Hostetler JE (1996) Effects of farmer response to nitrogen fertilizer management practices on groundwater quality. Water Resour Res 32 : 1411–1415 Kim CS, Sandretto CL, Lee D (1999) Controlling groundwater quality with endogenous regulatory instruments. Nat Resour Model (in press) Kim CS, Sandretto CL, Fleming R, Adams R (1997) An alternative specification for modeling groundwater dynamics. Nat Resour Model 10 : 173–183 Kim CS, Schaible GD (1997) Economic implications from estimating economic benefits using irrigation water applied. A paper presented at the Northeastern Agricultural and Resource Economic Association annual meetings, Sturbridge, Massachusetts, June 22–24, Economic Research Service, Washington DC Kohli U (1983) Non-joint technologies. Rev Econ Studies 51 : 209–219 Larson D, Helfand G, House B (1996) Second-best tax policies to reduce nonpoint source pollution. Am J Agric Econ 78 : 1108–1117
Magleby R, Selly R, Zara P (1995) The Mid-Nebraska Demonstration Project. A paper presented at the Soil and Conservation Society annual meetings, August 6–9, Economic Research Service, Washington DC Porter KS (ed; 1975) Nitrogen and phosphorus: food production, waste and the environment. Ann Arbor Science Publishing, Ann Harbor, Michigan Shortle JS, Dunn JW (1986) The relative efficiency of agricultural source water pollution control policies. Am J Agric Econ 68 : 668–677 Shumway CR (1983) Supply, demand, and technology in a multiproduct industry: Texas field crops. Am J Agric Econ 65 : 748–760 Shumway CR, Pope RD, Nash EK (1983) Allocatable fixed inputs and jointness in agricultural production: implications for economic modeling. Am J Agric Econ 65 : 72–78 Signor D, Helgesen J, Gorgensen D, Leonard R (1996) Geohydrology and simulation of steady-state flow conditions in regional aquifer systems in cretaceous and older rocks underlying Kansas, Nebraska and parts of Arkansas, Colorado, Missouri, New Mexico, Oklahoma, South Dakota, Texas and Wyoming. US Geo Surv, Prof Paper 1414-C Thomson GD, Langworthy M (1989) Profit function approximations and duality applications to agriculture. Am J Agric Econ 71 : 791–798 US Department of Agriculture (1997) Agricultural resources and environmental indicators, 1996–97. Agricultural Handbook No. 712, Economic Research Service, US Department of Agriculture, Washington DC Vroomen H, Taylor H (1992) Fertilizer use and price statistics, 1960–91. Statistical Bulletin No. 842, Economic Research Service, US Dept. of Agriculture, Washington DC Williams J, Llewelyn R, Reed M, Lamm F, Delano D (1997) Economic analysis of alternative irrigation systems for continuous corn and grain sorghum in western Kansas. Contribution No. 96–473-S, The Kansas Agricultural Experiment Station, May Version Wu J, Mapp H, Bernardo D (1994) A dynamic analysis of the impact of water quality policies on irrigation investment and crop choice decisions. J Agric Appl Econ 26 : 506–525
Environmental Geology 39 (6) April 2000 7 Q Springer-Verlag
659