NS, Canada, 3Medicinie, Dalhousie University, Halifax, NS, Canada, 4Psychology .... at http://www.fmrib.ox.ac.uk/fslcourse/lectures/practicals/melodic/index.htm.
An Efficient Global Clustering Algorithm for the Identification of Functional Connectivity from BOLD fMRI A. R. McIntyre1,2, X. Song1,3, E. E. Milios2, M. I. Heywood2, A. Major1, R. D'Arcy1,4, and K. Rockwood3,5 Institute for Biodiagnostics - Atlantic, National Research Council, Halifax, NS, Canada, 2Faculty of Computer Science, Dalhousie University, Halifax, NS, Canada, 3Medicinie, Dalhousie University, Halifax, NS, Canada, 4Psychology and Neuroscience, Dalhousie University, Halifax, NS, Canada, 5Centre for Health Care for the Elderly, QEII Health Sciences Centre, Halifax, NS, Canada 1
Introduction It has been suggested that the spontaneous BOLD signal fluctuations in the brain reflect the default functional connectivity [1]. The conventional statistical correlation analyses that are often employed to identify such connectivity patterns are hampered by computational overheads and the need for a priori definitions of region-of-interest. To address these concerns, we propose an approach that first utilizes a Self-Organizing Map (SOM) to capture a simplified temporal representation of the key characteristics of the data. The ensuing representation is readily amenable to global clustering, where distinctive map regions are explicitly identified as separate clusters. Sufficiently correlated points in the original data are then assigned to clusters resulting in a global view of the distinctive versus self-similar sets of patterns. This paper describes the approach and presents preliminary testing results. Methods Data: The proposed method was applied to two sets of benchmark data. The first being the FSL artificial testing suite [2], while the second data set was created from a set of real-world resting-state fMRI data acquired using 4T MRI (Spiral sequence, TR/TE=1000/15ms, flip=60, FOV=240, Matrix=64x64, 22 axial slices). The data were preprocessed for motion correction, co-registration, spatial normalization, and 6mm smoothing. A low-pass filter was applied (t < 0.1Hz). The data were further modified by imposing a known pattern of signal fluctuation. Percentage signal changes for the pattern were designed at 1-2%; representative for typical resting phase fMRI variation. Algorithms: The time course data were modeled using the Self-Organizing Map (SOM) algorithm taking each demeaned, standardized voxel time course as a separate training pattern. The SOM algorithm is a non-parametric, iterative regression process that optimally models the feature domain [3]. The SOM identifies temporally correlated voxels by arranging a set of nodes in a two-dimensional lattice so that neighbors are mutually similar with more distant nodes being increasingly dissimilar. In this way, it achieves a basic representation (or `map') that preserves topological properties of the data [3]. Advantages of this model include: implicit robustness to noise (i.e., tendency of nodes to position along the feature space so as to best represent the most dense and mutually dissimilar regions) and automatic reduction of samples used to describe the underlying data. In the real-world-based data, the second property provides a reduction of two orders of magnitude in the data. All SOM parameters, including map size and training epochs, were determined by the standard training heuristics provided by the implementation package [4]. The next step separates the map into hard partitions or clusters. The k-means algorithm is a standard clustering approach that divides n input vectors into k partitions, with k supplied a priori and the objective of minimizing total intra-cluster variance [5]. To eliminate manual selection of the k parameter, we repeatedly applied the algorithm to the SOM nodes, starting with k=2 and incrementally adding cluster candidates until the stopping criterion, based on minimization of quantization error (QE), is reached. At each k-value, 10 initializations of the k-means starting partition are attempted and the best result is selected. This process automatically divides the map into similarity regions with minimal QE. For each cluster centroid identified by k-means, we assign the points from the original data that are nearest in Euclidean distance. Finally each cluster is analyzed with respect to its centroid, removing any intra-cluster points outside a distance of 1.5 · IQR and those beyond of a pre-specified correlation p-value. Mapping the data back to the 3D brain space while maintaining the cluster labels provides a global visualization of regions that belong to the same clusters. Results A representative sample result based on the artificial FSL data set is provided in Figure 1, depicting the isolated cluster “S” returned under increasing p-value thresholds. The “F” and “L” slices on the same data represented slightly worse and better cluster identifications, respectively. A sample result for the second data set (depicting the letters “N” and “C”) is provided in Figure 2. Results for the second data set were analyzed by using the known pattern image as a label template and calculating the area under the ROC curve (AUC) after each of 20 initializations. The resulting distribution of AUC values had a median of 0.895, with upper/ lower quartile values of 0.900 and 0.885 respectively, indicating relatively strong detection accuracy with low variation in the results returned. The system has an asymptotic run time complexity of O(N N ), with N being the number of voxel inputs from the data volume.
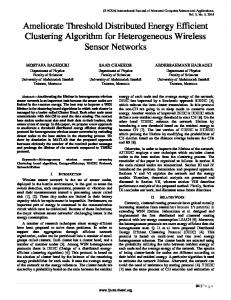
Figure 1.
Figure 2.
Single slice S cluster reconstruction under p-value thresholds of 0.01, 0.1, 0.5, and 0.95
Single slice N C cluster reconstruction under p-value thresholds of 0.2, 0.5, 0.75, and 0.95
Conclusions The SOM clustering algorithm was applied to the resting state BOLD data. The ensuing models are a sufficient approximation of the original time course data to allow a global, hard clustering step on the SOM nodes directly. Our preliminary results suggest that the global clustering approach efficiently identifies the embedded patterns from the perspective of both highly noisy data and real-world data and appear to be applicable to the identification of the whole brain functional connectivity. Future work will evaluate the proposed approach over a large database of resting state data against a standard suite of model-free algorithms. Moreover, we intend to consider the use of SOM and feature selection methods for providing more efficient temporal representations prior to application of the global clustering step. References [1] Fox MD, Raichle ME. Spontaneous fluctuations in brain activity observed with functional magnetic resonance imaging. Nat Rev Neurosci. 2007;8:700-11. [2] FSL data available at http://www.fmrib.ox.ac.uk/fslcourse/lectures/practicals/melodic/index.htm. [3] Kohonen, T. Self-Organizing Maps. Series in Information Sciences, Vol. 30. Springer, Heidelberg. Second ed., 1997. [4] Implementation provided by SOM Toolbox for MATLAB®. Source available at http://www.cis.hut.fi/projects/somtoolbox. [5] T. Kanungo et al. An efficient k-means clustering algorithm: Analysis and implementation, IEEE Trans. Pattern Analysis and Machine Intelligence, 2002;24:881-892.
Proc. Intl. Soc. Mag. Reson. Med. 17 (2009)
1727