An Efficient Method for Filtering Image-Based Spam E-mail Ngo Phuong Nhung and Tu Minh Phuong Posts and Telecommunications Institute of Technology, Hanoi, Vietnam
[email protected] Abstract. Spam e-mail with advertisement text embedded in images presents a great challenge to anti-spam filters. In this paper, we present a fast method to detect image-based spam e-mail. Using simple edge-based features, the method computes a vector of similarity scores between an image and a set of templates. This similarity vector is then used with support vector machines to separate spam images from other common categories of images. Our method does not require expensive OCR or even text extraction from images. Empirical results show that the method is fast and has good classification accuracy.
1 Introduction The increasing number of Internet users and the low cost of e-mail make this form of communication very attractive for direct marketers. As a consequence, the volume of unsolicited commercial e-mail (“spam”) has grown tremendously in past few years. In addressing this growing problem, many solutions to spam reduction have been proposed. Among these solutions are automated methods for filtering spam. Using hand-crafted rules or machine learning techniques, anti-spam filters analyze the text content of e-mail to detect spam. Some anti-spam filters are reported to achieve accuracy of up to 99% [9]. To circumvent such systems, spammers have invented many techniques. An example of techniques spammers use is to embed advertising text in images being sent with spam. While the contents of such messages are normally viewed by spam receivers they are shielded from text-based anti-spam filters. By some estimates, up to 25% of spam being sent today contain imagery and this number is expected to increase [1]. Therefore, it is desirable to develop systems that can detect and filter image-based spam. A possible way to detect image-based spam is using a pipeline of an optical character recognition (OCR) system that extracts and recognizes embedded text, followed by a text classifier that separates advertising text from legitimate content. While this solution promises to detect spam with a certain level of accuracy, the existing OCR algorithms are computationally expensive and thus cannot operate on heavily loaded e-mail servers. In a recent paper, Aradhye et al. [1] described an image-based anti-spam filter that does not require full text recognition. Their method starts by extracting regions with overlaid text from images. Based on the text regions and other image elements, the method creates several simple features that are indicative of spam. Images represented by the extracted features are then classified into spam and non-spam using SVM. W.G. Kropatsch, M. Kampel, and A. Hanbury (Eds.): CAIP 2007, LNCS 4673, pp. 945–953, 2007. © Springer-Verlag Berlin Heidelberg 2007
946
N.P. Nhung and T.M. Phuong
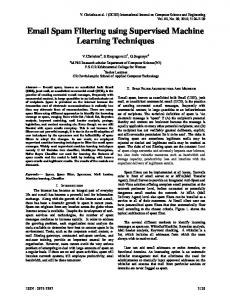
Since the method does not include the text recognition step, it is much faster than systems with full OCR. However, the extraction of text regions is nontrivial and still requires considerable computational resources. In this paper, we propose a fast method to detect spam images. The proposed method does not try to extract embedded text from an image. Instead, it uses an edgebased feature vector, which can be computed efficiently, to represent major shape properties of the image. Since most of spam images contain large proportions of text (Fig. 1), they must have shape representation similar to that of other text intensive images. Our method uses the edge-based feature to compute a vector of similarity measures from an image to a small set of gold standards – images with different proportions of overlaid text. These similarity vectors then serve as input to SVMs that separate spam images from legitimate ones. The method is fast because it does not use computationally expensive image processing and text recognition steps. On a collections of images, the method separates spam images from non-spam ones with accuracy of 80% and higher.
(a) Image containing only text
(b) Image with photographic elements
Fig. 1. Examples of spam images
(a) Natural scene photo
(b) Greetings e-card
Fig. 2. Examples of non-spam images
Related work. The problem of image-based spam detection is a special case of image categorization that has been studied in context of many important applications. Depending on application requirements and the nature of images to categorize, generic image categorization methods can use different image features or their combinations to distinguish between two or more classes. In a work by Hu and Bagga [4], the authors relied on the correlation between image functional categories and
An Efficient Method for Filtering Image-Based Spam E-mail
947
several features such as: whether the images are graphic or photographic, whether the images have text elements. They used frequency domain analysis of image intensity and DCT coefficients to decide about the presence of these features. The learning and classification steps were then done with SVMs. Gavilan et al. [3] represented an image in term of blobs – image regions lighter or darker than background. The blob representations of the images are then used to train neural networks to distinguish among natural, artificial, portrait, or text images. Another interesting application is indoor vs. outdoor classification [10]. Beside spam images, many other categories of images and videos contain text. Since overlaid text contains important information about image content, the extraction of text blocks and recognition of their content have attracted research interest in the image processing and multimedia analysis community. Previous work on text extraction used different characteristics of text regions such as their color [7], the frequent occurrence of vertical edges, or wavelets and spatial variance of texture [13] to locate blocks of text.
2 Algorithm Our proposed spam detection method uses SVM combined with vector representation of images to distinguish between spam and non-spam images. The algorithm consists of three steps outlined next. 1) Feature extraction and normalization using Edge Directions (ED) or Edge Orientation Autocorrelogram (EOAC). This step summarizes shape properties of an image in term of edge orientation and correlation. 2) Calculation of similarity scores between the image and a small set of templates or sample images containing only text. This step allows representing the image as a vector of similarity scores with respect to the templates. 3) Training and classification with SVM. The vector representations of images as computed in step 2 are used to train SVM and subsequently to classify each new image as spam or non-spam. In the following sections, we provide a detailed description for each of these steps. 2.1 Edge Directions and Edge Orientation Autocorrelogram In image categorization, it is important to choose appropriate features to represent images. Since spam images are text intensive, and text elements have special shape characteristics which make them different from that of background or other elements, it is desirable to use features able to capture such characteristics. At the same time, for the method to be practical, a feature of choice must be fast to compute. Although other features like color-based features, texture-based features, blobs etc. have been used with success for other image categorization tasks [3,4,8,10], edgebased features are very indicative of text intensive spam images while remain simple to compute. In this work, we have chosen two edge-based features: ED [5,6] and EOAC [8]. The ED feature summarizes global shape information. EOAC is an extension of ED which captures correlation between text elements over small distances. The ED histogram of an image is computed in three steps, and the EOAC is computed by adding two more steps as follows.
948
N.P. Nhung and T.M. Phuong
1. Edge detection: The Sobel operator is used to generate two edge components Gx and Gy, from which edge amplitude and edge orientation are computed as follows:
G = Gx 2 + G y 2
∠G = tg-1 (Gy / Gx)
and
2. Finding prominent edges: only edges with amplitude higher than a predefined threshold T1 are extracted. In our experiment we used T1 = 25 as in [8]. 3. Edge orientation quantization: Edges are quantized into k segments ∠G1, ∠G2, …, ∠Gk, each segment is five degrees. The result of this step is the ED histogram. 4. Determining distance set: This step constructs a distance set D, member of which are the distances from the current edge. This set is used to compute the correlations in the next step. We used the set of four members as in the original paper D = {1, 3, 5, 7}. 5. Computing EOAC matrix: The EOAC matrix is a two-dimensional array with k rows and |D| columns. The element of this matrix contains the number of similar edges with the orientation ∠Gj , which are i pixel distances apart. Two edges are defined to be similar if the absolute values of their orientations amplitudes differences are less than an angle and an amplitude threshold value. Figure 3 shows examples of EOAC graphs and ED histograms. The ED and EOAC features are translation invariant. This is a desired characteristic in our case because text can be located anywhere within an image. To achieve also scaling invariance, the ED histogram is normalized with respect to the number of edge points of the image, and the EOAC matrix is normalized with respect to the sum of the populations of all EOAC bins. 2.2 Calculation of Similarity Scores If the proportion of overlaid text within an image is large enough, the contribution of the text to the image’s ED and EOAC will dominate that of the other image elements. As a consequence, two images containing large amounts of text tend to share similarities in their shape representations. The algorithm proposed herein exploits this observation to distinguish text intensive images from others. Specifically, in this step, the algorithm computes similarity scores of the image with respect to a small set of n sample images or templates. Here we define a template as a specially constructed image, which contains only text. The proportions of text as well as text characteristics are chosen to vary among different templates so that the set covers a large variety of images with overlaid text. Figure 3 shows a non-spam image (a), a spam image (b), and a template (c) as well as their respective EOAC graphs [(d)-(f)] and ED histograms [(g)-(i)]. As shown in the figure, the EOAC and ED representations of the spam image share some similarities with those of the template while the representations of the non-spam image look very different. To measure the similarity between an image with EOAC X and a template with EOAC Y we use L1 distance computed as follows: k
L1( X , Y ) =
d
∑∑| X
ij
− Yij |
i =1 j =1
For the ED feature, the similarity is computed similarly.
An Efficient Method for Filtering Image-Based Spam E-mail
949
1200 1000 800 600 400 200 0 0
10 20 30 40 50 60 70
(d)
(g)
(a) Non-spam image 5000
1500 4000
1000
3000 2000
500 S1
1000 0
0 0
10
20
30
40
50
60
70
0
10
20
(e)
30
40
50
60
70
(h)
(b) Spam image 5000 4000 3000 6000 4000 2000 0
S1 0
(c) Template image
10
20
30
40
50
60
2000 1000 0
70
(f)
0
10
20
30
40
50
60
70
(i)
Fig. 3. An example of shape representation using EOAC and ED; (a) - (c) show three images, where (a) is non-spam, (b) spam, (c) a template; (d)-(e) their respective EOAC graphs; and (g)(i) their respective ED histogram.
At the end of this step, each image is represented by a vector of length n, elements of which are the similarity scores with respect to the templates. In machine learning community, the idea of representing an object via its similarity to a set of other objects is known as empirical feature map [11]. The merit of the empirical feature map is that it provides a general way to map from similarity scores to vector representation, from which a proper kernel can be constructed to use with SVM. 2.3 Support Vector Machine Learning and Classification
With vector of similarity computed above, we train SVM to differentiate between the two classes: spam and non-spam. The SVM algorithm relies on two main ideas. First, the algorithm maps the given training sets of n-dimensional vectors with positive and negative examples into a (possibly) high-dimensional feature space. Then, in the feature space, the algorithm seeks to locate a hyperplane with two properties: 1) it separates the positive from the negative examples; 2) it maintains a maximum margin from any example in the training set [12]. Having found such a hyperplane, the SVM predicts the label of a new example by mapping it into the feature space and defining on which side of the hyperplane the example is located. The mapping from the input
950
N.P. Nhung and T.M. Phuong
space to the feature space is done by using a so called kernel function. In this work, we used similarity vectors as input to the SVM and tried several kernel functions defined on input vectors.
3 Experiments and Results Dataset. Unlike the situation with text-based spam filtering, to our best knowledge, there is no public benchmark dataset for image-based spam. To create a dataset for experiments, we collected images from spam messages arriving at an e-mail server. We used images from a spam message only if the message does not contain text in its body and hence the image content provides the major source of information to make spam-non-spam decision. Images that exist only for formatting were not included. The spam part of the dataset contains 411 images, about half of them contain only text without complex background (Fig. 1a). The other images contain graphic and photographic elements with different levels of complexity (Fig. 1b). The non-spam images in our dataset were collected from several sources. We asked our friends and colleagues to donate e-cards they received over email. The e-card collection was augmented by free e-cards downloaded from different websites with default text. This resulted in 287 images all contain text. We further randomly selected 300 images from the CorelDraw collection. Finally, following the work presented in [1] other 723 images were collected by querying the Google-images search engine with keywords “nature photo”, “portrait” and “baby” and then randomly selecting from what the engine returned. Evaluation methodology. We assessed the method by using 10-fold cross-validation. The dataset was randomly divided into 10 folds of equal size. One fold is left as the test set and the other folds were used for training. The experiment was repeated 10 times with different folds being the test sets; the classification accuracy is calculated by averaging over 10 runs. In our evaluation, we used spam recall and non-spam recall defined as follows: # of spam correctly classified # of all spam # of non - spam correctly classified non − spam recall = # of all non - spam spam recall =
SVM training. To conduct experiments we used WEKA library (http://www. cs.waikato.ac.nz/ml/weka). All the similarity vectors were normalized to have unit length. In all the experiments we used SVM with soft margin and C = 1. We tried different kernels and found that the linear kernel and the RBF kernel give the best results. In what follows, only results obtained with the linear kernel are reported. Template set construction. Since the algorithm makes sense only when an image contains dominating amount of text, the templates were constructed so that text regions cover more than 50% of each template. Specifically, we used black-white templates with text areas covering from 50% to 90% of the whole images with interval of 10%. Letters were chosen uniformly so that all the letters of the English alphabet appear with the same frequency. We tried several commonly used font families and their italic and bold face variants. Since EOAC is scaling-invariant, the
An Efficient Method for Filtering Image-Based Spam E-mail
951
choice of font size is not critical. In our experiment, we used font size = 10. To avoid unexpected effect when comparing images of different sizes, we used ten sets of templates each of them consists of templates of the same size. The sizes were chosen from 80x60 to 800x600 pixel with interval of 80x80. When computing the similarity vector for the given image, the set with the size closest to the image’s size is used. Results. In the first experiment, we compared the performance of two versions of the method - with ED and EOAC used as image features. We also examined how the use of templates with different font families affected the spam detection accuracy. In addition to three fonts that are commonly used in the Internet namely Times New Romans (TNR), Arial, and Tahoma, we used two other template sets constructed with Gothic and Lucida fonts. The results are summarized in Table 1. The results show that, in average, the two edge-based features have nearly the same non-spam recall, but EOAC gives significantly higher spam detection accuracy. At the same time, computing EOAC is more expensive than computing ED. On a PC with Pentium IV and 512 MB RAM, the computation of EOAC and ED for 1000 800x600 images takes 260 seconds and 125 seconds respectively. Table 1. Spam recall and non-spam recall for different edge-based features and font families
TNR
Tahoma
Arial
Gothic
Lucida
ED
Spam recall Non-spam recall
0.73 0.88
0.75 0.88
0.74 0.88
0.74 0.88
0.79 0.87
EOAC
Spam recall Non-spam recall
0.80 0.87
0.83 0.87
0.80 0.88
0.79 0.87
0.86 0.84
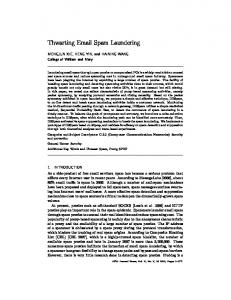
1
Non-spam recall
0.9 0.8 0.7
Nature photo Portrait
0.6
E-cards 0.5 0.5
0.6
0.7
0.8
0.9
1
Spam recall
Fig. 4. Spam and non-spam recalls for different image categories
As expected, the proposed method is not sensitive to the choice of font families used in template construction step. Except small fluctuations in cases of Tahoma and Lucida, the different font sizes give nearly the same classification accuracy. A possible explanation is that the small differences in shapes of the letters from different font families are smoothed during the edge orientation quantization step.
952
N.P. Nhung and T.M. Phuong
The next experiment was designed to evaluate the performance of the method on different categories of non-spam images. The method was run with EOAC as image feature and the template set constructed from Tahoma font family. In figure 4, nonspam recall for each image category is plotted against spam recall. The results show that the method can accurately distinguish spam images from “nature photo” images both spam and non-spam recalls are higher than 93%. At the same time, e-cards proved to be most difficult to distinguish from spam images. Images of this category always contain some amount of overlaid text, which make them similar to spam.
4 Conclusion We have described a new method for detecting spam e-mail with content embedded in images. Given an image, our method first extracts an edge-based feature, which summarizes the global information of the image. It then computes a vector of similarity scores between the image and a set of templates that contain only text. This vector representation of the image is used as input for support vector machines training and classification. The use of edge-based feature allows capturing regularities in shapes of text intensive spam images while does not require costly computations. Empirical tests show that our method achieves overall accuracy of 80% and higher in classifying spam from different categories of images whiles remains fast. Given the complexity of the problem, these results are encouraging and the proposed method can be used as a starting step for the construction of image-base anti-spam filters.
References 1. Aradhye, H.B., Myers, G.K., Herson, J.A.: Image Analysis for Efficient Categorization of Image-based Spam E-mail. In: Proc. of ICDAR’05, Seoul, Korea, pp. 914–918 (2005) 2. Fumera, G., Pillai, I., Roli, F.: Spam filtering based on the analysis of text information embedded into images. J. of Machine Learning Research 7, 2699–2720 (2006) 3. Gavilan, D., Takahashi, H., Nakajima, M.: Image Categorization Using Color Blobs in a Mobile Environment. Computer Graphics Forum (EG 2003) 22(3), 427–432 (2003) 4. Hu, J., Bagga, A.: Categorizing Images in Web Documents. IEEE Multimedia 11(1), 22– 30 (2004) 5. Jain, A.K., Vailaya, A.: Image retrieval using color and shape. Pattern Recognition 29(8), 1233–1244 (1996) 6. Jain, A.K., Vailaya, A.: Shape-basedretrieval: a case study with trademark image database. Pattern Recognition 31(9), 1369–1390 (1998) 7. Lienhart, R., Effelsberg, W.: Automatic Text Segmentation and Text Recognition in Video Indexing. ACM/Springer Multimedia Systems 8, 69–81 (2000) 8. Mahmoudi, F., Shanbehzadeh, J., Soltanian-Zadeh, H.: Image retrieval based on shape similarity by edge orientation autocorrelogram. Pattern Recognition 36, 1725–1736 (2003) 9. Sahami, M., Dumais, S., Heckerman, D., Horvitz, E., Bayesian, A.: Approach to Filtering Junk E-Mail. In: Proc. of AAAI-98 Workshop on Learning for Text Categorization (1998) 10. Szummer, M., Picard, R.W.: Indoor-Outdoor Image Classification. In: Proc. IEEE Intl. Workshop on Content-Based Access of Image and Video Databases, pp. 42–51 (1998)
An Efficient Method for Filtering Image-Based Spam E-mail
953
11. Tsuda, K.: Support vector classification with asymmetric kernel function. In: Proc. of 7-th European symposium on Artificial Neural Networks, pp. 183–188 (1999) 12. Vapnik, V.N.: Statistical Learning Theory. Adaptive and learning systems for signal processing, communications, and control. Wiley, New York (1999) 13. Li, H., Doermann, D., Kia, O.: Automatic Text Detection and Tracking in Digital Video. IEEE Transactions on Image Processing 9(1), 147–156 (2000)