Proceedings of the International MultiConference of Engineers and Computer Scientists 2010 Vol II, IMECS 2010, March 17 - 19, 2010, Hong Kong
An Efficient Method to Simulate the Pulse Propagation and Switching Effects of a Fiber Bragg Grating F. Emami, Member IAENG, A. H. Jafari, M. Hatami, and A. R. Keshavarz
Abstract—In this paper we investigated the pulse propagation in a grating using a novel, fast and efficient algorithm. This method is used for the related boundary values equations and is much faster than other methods such as shooting method. The nonlinear coupled equations of a fiber Bragg grating are solved numerically for an arbitrary input pulse. By this method, the first and second order variations of the propagation constants with respect to frequency, β1 and β2, are survived and compared with the experimental results. It is shown that β1 causes a shift in the pulse peak along the time axis and a large dispersion (or equivalently positive or negative β2) is exist in a FBG. The effect of different coupling coefficient in dispersion and soliton propagation is investigated and we found that in strong coupling regime, the FBG operates like an ideal filter.
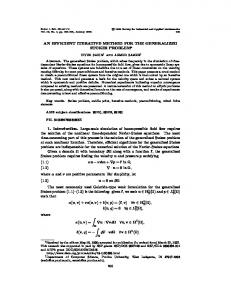
II. FBG STRUCTURE AND MATHEMATICAL MODELING FBGs are short lengths of optical fiber that reflect at a particular wavelength and are made by laterally exposing the core of a single mode fiber to a periodic pattern of intense ultraviolet light. The exposure produces a permanent increase in the refractive index of the fiber core, creating a fixed index modulation according to the exposure pattern. This fixed index modulation is called a grating and causes a coupling coefficient in the fiber. A simple structure of FBG is shown in Fig. 1.
Index Terms— Fiber Bragg grating, dispersion, soliton, optical switching
I. INTRODUCTION Fiber Bragg Gratings (FBGs) have attracted interests for many researcher groups in last few years and several techniques have been proposed to use them in the fiber optic communication systems and laser structures [1]. They often are used for some applications such as dispersion compensations, which can compress the pulses [2]-[4], and optical filter applications. For example band-pass filters with negative coefficients are made by an electro-optic phase modulator (EOPM) and fiber Bragg gratings [5]. In the switching applications, the nonlinear behavior of FBGs is used to design the optical switches [6]-[7]. Another application of FBGs is their usage in ultra-wide band (UWB) wireless communications to enhance the operational capabilities [8]. FBGs also can be used to select an especial frequency, where their frequency selective property can be utilized in wavelength division multiplexing (WDM) systems [9]-[10]. Manuscript received November 19, 2009. This work was supported in part by the Opto-Electronic Research Center of Shiraz University of Technology. F. Emami is with the Shiraz University of Technology, Shiraz, Iran (corresponding author to provide phone: +98-711-7266262; fax: +98-711-7353502; e-mail:
[email protected]). A. H. Jafari, was with Shiraz University of Technology, Shiraz, Iran. He is now with the Department of Electronics, Industrial and Science University, Tehran, Iran (e-mail: a.h.jafari@ sutech.ac.ir). M. Hatami, is with the Atomic Physics Department, University of Yazd, Yazd, Iran, (e-mail:
[email protected]). A. R. Keshavarz, is with the Physics Department, Shiraz University of Technology, Shiraz, Iran, (e-mail: keshavarz@ sutech.ac.ir).
ISBN: 978-988-18210-4-1 ISSN: 2078-0958 (Print); ISSN: 2078-0966 (Online)
Fig. 1: A schematic structure of FBG
FBGs can be explained by a set of coupled differential equations. In some cases, the ‘gap solitons’ may be provided in these mediums which can be used in the optical fibers for information-transmission [5]; they can be simulated by the nonlinear Schrödinger equation [11]. So, to solve the coupled equations of the FBGs, the different methods such as transfer matrix method (TMM) and inverse scattering method are used; but none of them can solve and analysis the general cases of the coupled equations. In this article, we use a heuristic numerical method to solve these equations and simulate the pulse propagation in FBGs. This is applicable to any cases of FBG. Modeling of a FBG is based on the refractive index variations along the fiber length, in the form of:
n (ω , z ) = n (ω ) + n 2 | E | 2 + ∆ n ( z )
(1)
where ∆n(z) is the periodic index variations, n0 is the background index and n2 describes the nonlinear index term due to high input signal energy (or the nonlinear Kerr effect). Decomposing the field to the forward and backward terms and using the Maxwell equations together with (1), a set of IMECS 2010
Proceedings of the International MultiConference of Engineers and Computer Scientists 2010 Vol II, IMECS 2010, March 17 - 19, 2010, Hong Kong
two coupled equations can be derived for the forward and backward pulses as [12]:
iβ 2 ∂ 2 f + ∂f + ∂f + + β1 + ∂t 2 ∂t 2 ∂z = iδ f + + iκ f − + iγ | f + | 2 + 2 | f
(
−
)
|2 f
+
(2)
iβ 2 ∂ 2 f − ∂f − ∂f − + + β1 −i 2 ∂t ∂z ∂t 2 − + = iδ f + iκ f + iγ | f − |2 + 2 | f
(
+
)
|2 f
−
(3) in these equations, f and f denote the forward and +
−
(a)
backward wave amplitudes respectively. κ is the coupling coefficient and can found from κ=(π/λ)∆n, δ is the detuning and is equal to 2πn(1/λ−1/λd), where λd is the Bragg wavelength. The second and third terms in (2) and (3) show the effects of the self phase modulation (SPM) and the cross phase modulation (XPM), respectively. To investigate the pulse propagation in a FBG, it is assumed that the input pulse energy is less than the critical energy [12], so the Kerr effect is negligible. For this purpose, we should solve and simulate the equations by using the Fourier method. The boundary conditions are: 1- f + which is a pulse amplitude in z=0, and 2- f − (=0) in z=L.
(b)
Due to these boundary conditions, the nonlinear effects and the existence of coupled nonlinear partial differential equations, simulation and analyzing of the arbitrary pulse propagation in FBGs in general case is difficult. Our method to overcome this problem is combination of Gauss-Seidel iteration, fourth (or fifth) order, and Runge-Kutta methods so the equations can be described in form of initial conditions equations, and any pulse propagation is possible to simulate. If we use the shooting method to convert this boundary value problem to an initial problem, we need a large number of iterations, maybe 40 or grater. But when the Gauss-Seidel iteration is used, the number of iterations decreases to 3-4 times and the calculation time becomes very small. (c)
III. SIMULATION RESULTS At first, consider the input pulse with a power less than the Pc; the critical power. To compare the results of our method, assume that there is a very wide pulse in the steady state case at the input. Without the nonlinear effects in FBGs, the coupled equations can be solved analytical as: f
−
(z) =
f + ( z) =
− ik sinh[ γ B ( z − L / 2 )] i δ sinh( γ B L ) + γ B cosh( γ B L )
γ B cosh( γ B ( z − L / 2 )) − i δ sinh[ γ B ( z − L / 2 )] iδ sinh( γ B L ) + γ B cosh( γ B L )
(4) (5)
Backward and forward wave can be computed with these analytical relations and at the same time with our numerical method too. The results are shown in Fig. 2.
ISBN: 978-988-18210-4-1 ISSN: 2078-0958 (Print); ISSN: 2078-0966 (Online)
(d) Fig. 2: (a) The forward field amplitude of the propagated pulse using analytical solution and (b) the analytical backward amplitude (c) numerical results of the forward field and (d) backward fields
IMECS 2010
Proceedings of the International MultiConference of Engineers and Computer Scientists 2010 Vol II, IMECS 2010, March 17 - 19, 2010, Hong Kong
For the case of δ < κ , or equivalently when the frequency center of the input pulse is in the forbidden band, the FBG behaves as a filter. In Fig. 2(a) and Fig. 2(c) the forward and backward waves are obtained from the analytical relations (4) and (5) and shown the filter behavior of FBG. Now by considering a wide input pulse and ignoring the nonlinear effects, the numerical results are shown in Fig. 2(b) and (d). As expected, there is a good compatibility between the analytical and our numerical method. This compatibility can be obtained for the case δ > κ (the pulse central frequency lies at the outside of the forbidden band) too. Now consider the general case of (2) and (3) that should be solved with the proposed numerical method, including the partial differentiation and nonlinear terms. For δ < κ , the
Without this term, the shape of the input soliton pulse is expected to be constant when it propagates along a lossless fiber (as shown in Fig. 2). The periodic variations of the refractive index can change the coupling strength and hence the output pulse shape. This is because of the reflected pulse will be changed. The transmitted and reflected waves are depended on the amount of the coupling strength. As seen in Fig. 4, for higher coupling (and when the input pulse wavelength is in the forbidden gap), there is more reflectance of the input light. Therefore, the FBG reflected spectrum is the same as the ideal case.
FBG shows a filtering effect and some of the input frequency components are reflected (Fig. 3). Indeed, due to first order dispersion, β1, the soliton pulse peak shifts to the right or left for positive or negative β1 respectively during propagation, so provides an asymmetric soliton. This peak power shift is because of the group velocity changes, vg, of pulse (T = (t - z/vg)/to).
Fig. 4: The power of output pulse to input pulse versus coupling coefficient for δ = 1 cm-1
The coupling coefficient affects the pulse amplitude oscillations and the reflected pulse peak. As shown in Fig. 5(a) and (b), for the case δ > κ , the soliton propagates
(a)
(b) Fig. 3: Numerical results that show β1 causes a peak power shift in the (a) propagated forward pulse and (b) asymmetric backward pulse shape in a FBG
ISBN: 978-988-18210-4-1 ISSN: 2078-0958 (Print); ISSN: 2078-0966 (Online)
through FBG in an oscillatory shape. As shown in Fig. 5(c), if the coupling coefficient increases, we have a growth in the pulse amplitude oscillation for solitons along the propagation direction. This is due to coupling increment between forward and backward waves where more energy is transferred to the reflected wave. Fig. 5(d) shows the periodic oscillations of the forward pulse is increased for a constant coupling, when δ increases. It is clear that the amplitude of the propagated pulse becomes more than the input pulse. This is due to the pulse narrowing; a fraction of its energy is transferred to the backward part, since the total energy is constant. Usually FBGs provide large total group velocity dispersion (GVD) for δ > κ . The reason is additive dispersion effects of the grating structure and the fiber dispersions. The grating dispersion depends hardly on the parameters κ and δ, which is, maximize near the forbidden band. For negative value of detuning, δ, the input pulse is compressed during the propagation. Indeed, for negative detuning, δ κ . IMECS 2010
Proceedings of the International MultiConference of Engineers and Computer Scientists 2010 Vol II, IMECS 2010, March 17 - 19, 2010, Hong Kong with different values of κ, (d) Periodic variations of the input pulse with different values of δ
Shown in Fig. 6, for δ>0, near the forbidden band there is a large dispersion. As an example, for a fixed coupling less −1
than δ ≈ 10cm there are 25% and 50% broadening for forward and backward parts of the pulse respectively. When the absolute value of the detuning becomes larger (more negative), the imposed dispersion is lower and the full width at half maximum (FWHM) of output and reflected pulse decrease as plotted in Fig. 6.
(a)
(b) Fig. 6: Numerical results of the effects of GVD versus detuning
δ. Decreasing the detuning δ, the imposed dispersion (GVD) on input
pulse increases and for large value of δ, GVD is zero nearly (κ=5cm-1)
Higher negative detuning is equivalent to lower FWHM. This is in accordance with the experimental results in reported in Fig. 7 [13].
(c)
Fig. 7: Experimental results show the effects of GVD in FBGs versus detuning δ [13]
(d) Fig. 5: Variation of oscillation amplitude of soliton propagation versus coupling coefficient for δ > κ , (a) Forward soliton propagation, (b) Backward soliton propagation (c) Amplitude oscillations of input pulse
ISBN: 978-988-18210-4-1 ISSN: 2078-0958 (Print); ISSN: 2078-0966 (Online)
In Fig. 8, the FWHM of output pulse is plotted versus negative detuning (δ