Abstractâ In this paper, a pitch estimation method is proposed based on windowless and normalized autocorrelation functions from noise corrupted speech ...
INTERNATIONAL JOURNAL OF CIRCUITS, SYSTEMS AND SIGNAL PROCESSING
An Efficient Pitch Estimation Method Using Windowless and Normalized Autocorrelation Functions in Noisy Environments M. A. F. M. Rashidul Hasan, and Tetsuya Shimamura
The autocorrelation model appears to be one of the most popular methods for its simplicity and explanatory power. The autocorrelation function (ACF) method [5] is tunable in random noise and is the most powerful method particularly in a white noise environment. A white noisy environment is often seen in communication systems, and an accurate estimation method of pitch is, thus, desired to handle this environment. However, the ACF produces extraction errors of pitch and the error rate is greatly influenced by the vocal tract characteristics [6]. Various methods for pitch estimation have been introduced in the last few decades [7-13]. Among many other improvements reported on the ACF method, Markel [14] and Itakura et al. [15] utilized auto-regressive (AR) inverse filtering to flatten the signal spectrum. This AR preprocessing step has effects on emphasizing the true period peaks in ACF. However, for high-pitched speech or in white Gaussian noise, the process of AR estimation is itself erroneous. Shahnaz et al. [16] proposed to combine temporal and spectral representations for robust pitch estimation. The method aimed at accurately locating pitch harmonics in noisy speech spectrum, and used discrete cosine transform-domain information to resolve the corresponding harmonic numbers. It demonstrated the advantage of using both temporal and spectral information. Nevertheless, accurate estimation and identification of pitch harmonics may not be always possible, especially when the signal-to-noise ratio (SNR) is low or the noise is highly non-stationary. Shimamura et al. [17], proposed a weighted autocorrelation (WAC) method utilizing the periodicity property of ACF and AMDF, where the ACF is weighted by the reciprocal of the AMDF in order to emphasize the true pitch peak for noisy speech. Since, in a highly noisy environment, the global maximum of ACF or the global minimum of AMDF may occur at a lag that is a multiple or sub multiple of true pitch period, thus in the weighted ACF, the peaks at non pitch locations may be wrongly emphasized more than those at the true pitch location. This causes inaccurate pitch estimation, especially at a low SNR. Talkin [18] proposed a normalized cross correlation based method that produces better results in pitch detection than the ACF as the peaks are more prominent and less affected by rapid variations in the signal amplitude. Normalized ACF (NACF) based technique is introduced in [19] with higher pitch estimation
Abstract— In this paper, a pitch estimation method is proposed based on windowless and normalized autocorrelation functions from noise corrupted speech observations. Instead of the input speech signal, we utilize its windowless autocorrelation function for obtaining the normalized autocorrelation function. The windowless autocorrelation function is a noise-reduced version of the input speech signal where the periodicity is more apparent with enhanced pitch peak. The performance of the proposed pitch estimation method is compared in terms of gross pitch error with the recent other related methods. A comprehensive evaluation of the pitch estimation results on male and female voices in white and pink noises shows the superiority of the proposed method over some of the related methods under low levels of signal-to-noise ratio.
Keywords— Normalized autocorrelation function, Pitch extraction, Pink noise, White noise, Windowless autocorrelation function. I. INTRODUCTION
P
itch or fundamental frequency estimation of speech signal is used in various important application areas such as automatic speech recognition, speaker identification, low-bit rate coding, speech enhancement using harmonic model etc. Besides these, pitch analysis can be used for detecting baby voice [1]. Recently many pitch estimation algorithms have been proposed, but accurate and efficient pitch estimation is still a challenging task [2], [3]. The speech signal is not always strongly periodic and the instantaneous frequency varies within each frame. Also, the presence of noise generates a degraded performance of pitch extraction algorithms. Numerous methods have been proposed in the literature to address this problem. In general, they can be categorized into three classes: time-domain, frequency-domain, and time-frequency domain algorithms. Due to the extreme importance of the problem, the strength of different methods has been explored [4]. Time-domain methods operate directly on the signal temporal structure. These include, but are not limited to, zerocrossing rate, peak and valley positions, and autocorrelation. M. A. F. M. R. Hasan is with the Graduate School of Science and Engineering, Saitama University, Saitama, 338-8570, Japan (phone: 81-48858-3496; fax: 81-48-858-3716; e-mail: hasan@ sie.ics.saitama-u.ac.jp). T. Shimamura is with the Graduate School of Science and Engineering, Saitama University, Saitama, 338-8570, Japan (e-mail: shima@ sie.ics.saitama-u.ac.jp).
Issue 3, Volume 6, 2012
197
INTERNATIONAL JOURNAL OF CIRCUITS, SYSTEMS AND SIGNAL PROCESSING
accuracy than the simple ACF. A noticeable improvement of the NACF based method is achieved by a signal reshaping technique in which the enhancement of specific harmonic is performed [20]. The dominant harmonic of the noisy speech signal is determined by using discrete Fourier transform and boosting the amplitude of dominant harmonic in the analyzing signal. The method is termed here as dominant harmonic enhancement (DHE). In the DHE method, there may occur the shifting of fundamental frequency peak due to the noise effects, and the presence of higher frequency harmonics introduces some errors. In this paper, we propose another modification of an efficient pitch estimation technique that utilizes the windowless ACF of the speech signal instead of the speech signal itself for computing the NACF [21]. The windowless ACF of the speech signal is a noise compensated equivalent of the speech signal in terms of periodicity which improves SNR greater than 10 dB [22]. Then, application of the NACF method on the SNR improved speech signal provides better pitch determination. Experimental results on male and female voices in white and pink noise show that the occurrence probability of pitch errors becomes lower using the proposed windowless autocorrelation based NACF method when compared with other methods. The rest of the paper is organized as follows. In Section II, we describe the background information of ACF methods. A brief description of the proposed method is given in Section III. Section VI compares the pitch estimation performance of the proposed method with the existing methods in terms of gross pitch error, fine pitch error, and root mean square error. Finally, Section V concludes this paper.
period candidates. The main advantage of this method is its noise immunity. However, effect of formant structure can result in the loss of a clear peak in Rss(τ) at the true pitch period. The second difficulty is that the peak estimation varies as a function of the lag index τ, since the summation interval shrinks as τ increases. This compromises its noise immunity and estimation accuracy when the peak is at a longer lag (that corresponds to a lower pitch (higher fundamental frequency) case). Methods have been proposed to improve the pitch period extraction by emphasizing the true peak in ACF [4-20]. A modification to the basic autocorrelation is the normalized ACF [18] of the signal s(n), 0 ≤ n ≤ N-1, that is computed as
NACF ( )
1 e0 e
N 1
s ( n) s ( n )
(4)
0 ≤ τ ≤ L-1
(5)
n 0
where
e
N L 1
s
2
(n),
n
As reported in [18], this method is better suited for pitch period estimation than the standard ACF as the peaks are more prominent and less affected by rapid variations in the signal amplitude. Nevertheless, the largest peak in ACF still occurs at double or half the correct lag value or some other incorrect values, giving rise to some errors. In this paper, we propose a modified NACF method that utilizes the windowless ACF instead of the speech signal itself. Experimental results suggest that the proposed method can be effective against the presence of white noise and pink noise.
II. BACKGROUND INFORMATION III. PROPOSED METHOD
The voiced speech can be expressed as a periodic signal s(n) as follows:
According to the signal in (1) and the ACF in (3), clearly the periodicity of s(n) and that of Rss(τ) are similar. Since the autocorrelation of a signal is obtained by an averaging process, it can be treated as a noise-compensated version of the speech segment in terms of periodicity. This can be shown as follows. When s(n) is corrupted by additive noise v(n), the noisy signal is given by
s(n) ai cos(2if 0 n i )
(1)
i 0
where f0 = 1/T0 is the fundamental frequency and T0 is the pitch period. The ACF is a popular measure for pitch period that can be expressed as
Rss ( )
1 N
x(n) s(n) v(n)
N 1
s ( n) s ( n )
When v(n) is white Gaussian uncorrelated with s(n), (3) can be written as
(2)
n 0
Rxx ( )
for s(n), n = 0, 1, 2,..., N-1. By using (1), (2) can be expressed for a very long data segment approximately as
where
Rss ( )
1 a n2 cos(2f 0 n ) 2 n 0
v2
Rss v2 Rss
for 0, for 0
(7)
is the noise variance of v(n). According to (7), only
the first lag is affected by the noise presence. In this paper, we aim to utilize Rxx(τ) as the input signal with modification for pitch period estimation. The modification is performed because Rxx(τ) is computed using a finite length of speech
(3)
The Rss(τ) exhibits local maxima at nT0 and provides pitch Issue 3, Volume 6, 2012
(6)
198
INTERNATIONAL JOURNAL OF CIRCUITS, SYSTEMS AND SIGNAL PROCESSING
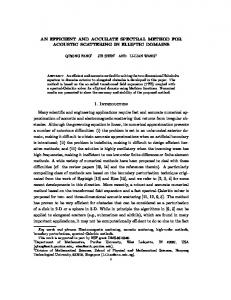
segment. As the lag number increases, there is less data involved in the computation, leading to reduction in amplitude of the correlation peaks. As mentioned in Section II, it compromises the accuracy when the true peak occurs at a long lag. The similar problem can arise for a speech segment with relatively weaker periodicity. The Rxx(τ) can be enhanced in terms of periodicity by defining it in a windowless condition as exploited in [22], where the signal outside the window is not considered as zero as shown in Fig. 1(a).
estimation. The second concern in [22] was the exclusion of zero-lag since it includes the noise component. This exclusion might be useful for spectral estimation as described in [23]. However, for pitch period estimation, the exclusion of zero-lag or lower lags somewhat hampers the periodicity. Thus, Rxw(τ), τ = 0, 1, 2,..., N-1, results in a noise-compensated version of the speech signal with strong periodic waveform. By using (8), (4) can be expressed as
1
NACFw ( )
Signal outside window not zero
e0 wew
5000
N 1
R n0
xw
(n) Rxw (n )
(9)
where 0
ew
-5000 0
200 8
x 10
800
1000
0
n
2 xw
(n), 0 ≤ τ ≤ L-1
(10)
5000
-5 0
200 6
1
R
To demonstrate that the use of the windowless ACF signal enhances the pitch peak, we present a noisy voiced signal as shown in Fig. 2.
x 10
400 600 Lag (samples) (b)
800
Amplitude
Amplitude
5
400 600 Time (samples) (a)
N L 1
1000
0 -5000
0
0
x 10
5 -1 0
200
400 600 Lag (samples) (c)
800
1000
-5
Amplitude
Thus the number of additions in the averaging process is always common. This results in almost similar amplitude correlation peaks even as the lag number increases. The windowless ACF can be defined for the noisy signal x(n) as
(8)
500
0
50
100 150 (b) Accurate peak detection
200
0
100 (c)
150
200
Accurate peak detection
0 -2
for x(n), n = 0, 1, 2, . . . , 2N-1. In this case, an N length sequence of Rxw(τ), τ = 0, 1, 2, . . . , N-1 is obtained. For the ACF in (2), when (n+τ) > N, s(n+τ) becomes zero. However, in (8), x(n+τ) is not zero outside N. This modification makes Rxw(τ) more stronger in periodicity with emphasized peaks as seen in Fig. 1(c). Suzuki [22] demonstrated that the use of autocorrelation domain signal (as expressed in (7)) improves the SNR greater than 10 dB. The main concern in [22] was the distortion
0
50
0
50
2
100 150 (d) Accurate peak detection
200
1 0 -1
100 150 200 Lag (samples) (e) Fig. 2 (a) Noisy speech signal of a female speaker at an SNR of 0 dB, Pitch peak detection using (b) WAC, (c) NACF, (d) DHE, and (e) proposed method. The vertical line indicates the correct pitch value
a 2n 2 instead
of a n ). This is, however, completely irrelevant in pitch period Issue 3, Volume 6, 2012
50
2
n 0
introduced due to the change of amplitude (i.e.,
0
1
-1
N 1
x ( n) x ( n )
5
200 300 400 Time (samples) (a) Accurate peak detection
0
Fig. 1 (a) Noisy speech signal, (b) ACF of signal in (a), (c) Windowless ACF of signal in (a)
1 Rxw ( ) N
100
199
INTERNATIONAL JOURNAL OF CIRCUITS, SYSTEMS AND SIGNAL PROCESSING
enabling accurate estimation of pitch period (Fig. 3(e)). It is, therefore, worth using the windowless ACF signal for reducing the pitch errors.
Fig. 2 implies that all methods provide accurate peak detection for true pitch period. However, the performance of the conventional algorithms is significantly degraded at very low SNR. This can be seen in Fig. 3, where a high noisy voiced signal is used for peak detection.
IV. EXPERIMENTAL RESULTS To assess the proposed method, natural speeches spoken by three Japanese female and three male speakers are examined. Speech materials are 11 sec-long sentences spoken by every speaker sampled at 10 kHz rate, which are taken from NTT database [24]. The reference file of the fundamental frequency of speech is constructed by computing the fundamental frequency every 10 ms using a semi-automatic technique based on visual inspection. The simulations were performed after adding additive noise to these speech signals. For the performance evaluation of the proposed method, criteria considered in our experimental work are: 1) gross pitch error (GPE); 2) fine pitch error (FPE); and 3) root mean square error (RMSE). The evaluation of accuracy of the extracted fundamental frequency is carried out by using
5000 0 -5000
0 x 10
100 5
2
200 300 400 500 Time (samples) (a) Failure of peak detection
0 -2
Amplitude
0
50
100 (b)
1
150
200
Failure of peak detection
e(l ) Ft (l ) Fe (l )
0.5
(11)
0
-0.5
0
50
100 (c)
150
200
150
200
where Ft(l) is the true fundamental frequency, Fe(l) is the extracted fundamental frequency by each method, and e(l) is the extraction error for the l-th frame. If |e(l)| > 20%, we recognized the error as a gross pitch error (GPE)[13], [20]. Otherwise we recognize the error as a fine pitch error (FPE). The possible sources of the GPE are pitch doubling, halving and inadequate suppression of formants to affect the estimation. The percentage of GPE, which is computed from the ratio of the number of frames (FGPE) yielding GPE to the total number of voiced frames (Fv), namely,
2 Failure of peak detection
1 0 -1
0
50
2
100 (d) Accurate peak detection
1
GPE (%)
0 -1
0
(12)
The mean FPE is calculated by
50
100 150 200 Lag (samples) (e) Fig. 3 (a) Noisy speech signal of a female speaker at an SNR of -5 dB,Pitch peak detection using (b) WAC, (c) NACF, (d) DHE, and (e) proposed method. The vertical line indicates the correct pitch value
FPEm
1 Ni e(l j ) Ni j 1
(13)
where lj is the j-th interval in the utterance for which |e(lj)| ≤ 20% (fine pitch error), and Ni is the number of such intervals in the utterance. Another metric, the root mean square error (RMSE) as given by
From Fig. 3 it is observed that using the WAC and NACF of x(n) pitch period can be estimated only with double pitch error. In both WAC and NACF, the amplitude of the pitch peaks are smaller than the peaks at double pitch location. It is assumed that the application of the DHE emphasize only the amplitude of the dominant harmonic of the prefiltered speech signal [20]. However, the amplitude of the other harmonics may also be emphasized based on their relative phases. That is the reason why the performance of fundamental frequency detection using the DHE method often degrades especially for low SNR speech signals. In Fig. 3(d), a pitch error has occurred in the DHE. On the contrary, in the NACF of Rxw(τ) in (9), the amplitude of the true pitch peak is enhanced,
Issue 3, Volume 6, 2012
FGPE 100 Fv
RMSE (%)
1 Fv
Ft (l ) Fe (l ) 100 Ft (l ) l 1 Fv
2
(14)
is the measure of error in percentage in the pitch estimates of all the Fv voiced frames in an utterance. As metrics, the GPE (%), FPEm and RMSE (%) provide a good description of the performance of a pitch estimation method. The experimental conditions are tabulated in Table I.
200
INTERNATIONAL JOURNAL OF CIRCUITS, SYSTEMS AND SIGNAL PROCESSING
Fig. 4 shows that in contrast to the other three methods, the proposed method yields a relatively smoother pitch contour even at an SNR of 0 dB. Fig. 5 shows a comparison of the pitch contour resulting from the four methods for the female speech corrupted by the pink noise at an SNR of 0 dB. In Fig. 5 it is clear that the proposed method is able to give a smoother contour even in the presence of pink noise. The pitch contours in Figs. 4 and 5 obtained from the four methods have convincingly demonstrated that the proposed method is capable of reducing the double and half pitch errors thus yielding a smooth pitch track.
Table I Condition of experiments Sampling frequency 10 kHz Band limitation 3.4 kHz Window function Rectangular Window size 51.2 ms (N=512) Frame shift 10 ms Number of FFT points 2048 SNRs (dB) ∞, 20, 15, 10, 5, 0, -5
Amplitude
Amplitude
We attempt to extract the pitch information of clean and noisy speech signals. All the candidate algorithms are applied in additive white Gaussian noise and pink noise. The noises are taken from the Japanese Electronic Industry Development Association (JEIDA) Japanese Common Speech Corporation. The performance of the proposed method is compared with a well-known weighted autocorrelation method, WAC [17], normalized ACF based method, NACF [18] (according to (4)), and dominant harmonic enhancement based method, DHE [20]. For the implementation of the DHE, the parameter α in [20] is set to 0.5 and for WAC, the parameter K in [17] is set to 1. As the pitch range is known to be 50-500 Hz for most male and female speakers and our sampling frequency is 10 KHz, the setting of L (L=200) is commonly used for the NACF, DHE, and the proposed method. In order to evaluate the pitch estimation performance of the proposed method, we plot a reference pitch contour for noisy speech in white noise speech of a female speaker from the reference database and also the pitch contours obtained from the four pitch estimation methods in Fig. 4.
2
4
6 Time (s) (a)
400
8
10
200 0
100
200
300
400
500 600 (b)
700
800
900
1000
100
200
300
400
500
600
700
800
900
1000
100
200
300
400
500 600 (d)
700
800
900
1000
100
200
300
400
500 600 (e)
700
800
900
1000
100
200
300
400
500 600 700 Frame number (f)
800
900
1000
400 200
Frequency (Hz)
0 400
(c)
200 0 400 200 0 400
5000 200
0
0
-5000 2
4
400
6 Time (s) (a)
8
10
Fig. 5 (a) Noisy speech signal in pink noise at an SNR 0 dB, (b) True pitch of signal (a), Pitch contours extracted by (c) WAC, (d) NACF, (e) DHE, and (f) proposed method
200 0
100
200
300
400
400
500 600 (b)
700
800
900
1000
Pitch estimation error in percentage, which is the average of GPEs for male and female speakers, are shown in Figs. 6 and 7, respectively. The performance of the WAC and NACF methods provides slightly better results than the other two methods up to SNR = 5 dB for male cases in white noise and pink noise, but in all other SNR conditions for both speakers and noises cases their performances are not satisfactory. For male and female in higher white noisy cases the DHE method provides better results compared with the WAC and NACF methods but in pink noise cases the DHE method provides worst results both in male and female cases. In particular, it is evident from Figs. 4 and 5 that, for the levels of SNR equal to or greater than 5 dB, the percentage GPE values resulting from the proposed method are small but the WAC, NACF and DHE methods give relatively higher values of percentage GPE in this range.
200 0 Frequency (Hz)
5000 0 -5000
100
200
300
400
500 600 (c)
700
800
900
1000
100
200
300
400
500 600 (d)
700
800
900
1000
100
200
300
400
500 600 (e)
700
800
900
1000
100
200
300
400
500 600 700 Frame number (f)
800
900
1000
400 200 0 400 200 0 400 200 0
Fig. 4 (a) Noisy speech signal in white noise at an SNR 0 dB, (b) True pitch of signal (a), Pitch contours extracted by (c) WAC, (d) NACF, (e) DHE, and (f) proposed method Issue 3, Volume 6, 2012
201
INTERNATIONAL JOURNAL OF CIRCUITS, SYSTEMS AND SIGNAL PROCESSING
On the contrary, in white and pink noise cases, the proposed method gives far better results for both male and female cases in different types of SNR conditions. These experimental results show that the proposed method is superior to the three other methods in almost all cases. Particularly, at low SNR (0 dB, -5 dB), the proposed method performs more robustly compared with the other methods. The FPE indicates a degree of the fluctuation in detected fundamental frequency. For the FPE, mean of the errors (in Hz) was calculated. Considering all the utterances of the male and female speakers, in Figs. 8 and 9, the FPE values resulting from the four methods are plotted, respectively. Average FPEs for all methods range approximately from 0.5 Hz ~ 7.5Hz. It is also seen from Figs. 8 and 9 that in every case at an SNR as low as -5 dB, the FPE values resulting from the proposed method are small but the WAC, NACF and DHE methods give relatively higher values of FPE in this range. From the simulation results it is found that the value of FPEs is also within the acceptable limit and consistently satisfactory at other SNRs. RMSE is also used to quantify the pitch detection accuracy. Figs. 9 and 10 present the variation of RMSE values with respect to the level of SNR obtained by using all the four methods, for the same male and female speakers in both noisy cases, respectively. It is observed from Figs. 10 and 11 that the proposed method continues to provide better results for the low levels of SNR, such as 0 dB and -5 dB. Based on our analysis, it is found that at a high SNR, the small percentage GPE, RMSE and low FPE values are obtained from the proposed method in comparison to the other three methods. Therefore, we infer that the proposed method is suitable for pitch extraction method in noise-corrupted speech with a very low SNR.
Average no. of GPE (%)
20 WAC NACF DHE PROPOSED
15 10 5 0 Clean
20
15
10 SNR (dB) (a)
5
0
-5
20
15
10 SNR (dB) (b)
5
0
-5
Average no. of GPE (%)
50 40 30 20 10 0 Clean
Fig. 6 Average performance results in terms of percentage of gross pitch error for male speakers in (a) white noise, (b) pink noise at various SNR conditions
Average no. of GPE (%)
20 WAC NACF DHE PROPOSED
15 10
V. CONCLUSION In this paper, an efficient pitch estimation method using windowless and normalized autocorrelation functions was introduced which leads to robustness against additive noise. Simulation results indicate that the proposed method provides better performance in terms of GPE (in percentage) compared with the existing methods such as WAC, NACF and DHE for a wide range of SNR varying from -5 dB to ∞ dB. Especially the performance of the proposed method in low SNR cases is noticeable higher both in white and pink noise cases than that of the WAC, NACF and DHE based methods. The competitive value of mean FPEs and RMSEs also indicate the accuracy of pitch extraction by the proposed method. These results suggest that the proposed method can be a suitable candidate for extracting pitch information both in white and color noise conditions with very low levels of SNR as compared with other related methods.
5 0 Clean
20
15
10 SNR (dB) (a)
5
0
-5
20
15
10 SNR (dB) (b)
5
0
-5
Average no. of GPE (%)
50 40 30 20 10 0 Clean
Fig. 7 Average performance results in terms of percentage of gross pitch error for female speakers in (a) white noise, (b) pink noise at various SNR conditions
Issue 3, Volume 6, 2012
202
INTERNATIONAL JOURNAL OF CIRCUITS, SYSTEMS AND SIGNAL PROCESSING
5
60
FPE (Hz)
4 3
RMSE (%)
WAC NACF DHE PROPOSED
WAC NACF DHE PROPOSED
40
20
2 1 Clean
20
15
10 SNR (dB) (a)
5
0
0 Clean
-5
20
15
10 SNR (dB) (a)
5
0
-5
20
15
10 SNR (dB) (b)
5
0
-5
8 80
6
RMSE (%)
FPE (Hz)
7 5 4 3
60 40 20
2 1 Clean
20
15
10 SNR (dB) (b)
5
0
0 Clean
-5
Fig. 8 Comparison of average performance results in terms of mean fine pitch error for male speakers in different noises: (a) white noise, (b) pink noise at various SNR conditions
Fig. 10 RMSE as a function of various SNR conditions in (a) white noise and (b) pink noise for male speaker
5
60 WAC NACF DHE PROPOSED
RMSE (%)
FPE (Hz)
4 3 2 1 Clean
20
15
10 SNR (dB) (a)
5
0
40
20
0 Clean
-5
20
15
10 SNR (dB) (a)
5
0
-5
20
15
10 SNR (dB) (b)
5
0
-5
8 80
WAC NACF DHE PROPOSED
6 5 4
RMSE (%)
FPE (dB)
7
3
40 20
2 1 Clean
60
20
15
10 SNR (dB) (b)
5
0
0 Clean
-5
Fig. 9 Comparison of average performance results in terms of mean fine pitch error for female speakers in different noises: (a) white noise, (b) pink noise at various SNR conditions
Issue 3, Volume 6, 2012
Fig. 11 RMSE as a function of various SNR conditions in (a) white noise and (b) pink noise for female speaker
203
INTERNATIONAL JOURNAL OF CIRCUITS, SYSTEMS AND SIGNAL PROCESSING
[23] B. J. Shannon and K. K. Paliwal, “Feature extraction from higher-lag autocorrelation coefficients for robust speech recognition,” Speech Communication, vol. 48, pp. 1458-1485, Nov. 2006. [24] NTT, “Multilingual Speech Database for Telephometry,” NTT Advance Technology Corp., Japan, 1994.
REFERENCES [1]
[2] [3] [4]
[5]
[6]
[7]
[8]
[9]
[10]
[11]
[12]
[13]
[14]
[15]
[16]
[17]
[18]
[19]
[20]
[21]
[22]
S. Yamamoto, Y. Yoshitomi, M. Tabuse, K. Kushida and T. Asada, “Detection of baby voice and its application using speech recognition system and fundamental frequency analysis,” in Proc. 10th WSEAS Int. Conf. Applied Computer Science, Iwate, 2010, pp. 341-345. W. Hess, Pitch Determination of Speech Signals. New York: SpringerVerlag, 1983. L. R. Rabiner and R. W. Schafer, Theory and Applications of Digital Speech Processing. New York: Prentice Hall, 2010. P. Veprek and M. S. Scordilis, “Analysis, enhancement and evaluation of five pitch determination techniques,” Speech Communication, vol. 37, pp. 249-270, July 2002. L. R. Rabiner, “On the use of autocorrelation analysis for pitch detection,” IEEE Trans. Acoustics, Speech, and Signal Processing, vol. ASSP-25, no. 1, pp. 24-33, Feb. 1977. W. J. Hess, “Pitch and voicing determination,” in Advances in Speech Signal Processing, S. Furui and M. M. Sondhi, Eds. New York: Marcel Dekker, 1992, pp. 3-48. C. Shahnaz, W. Zhu and M. O. Ahmad, “Pitch estimation based on a harmonic sinusoidal autocorrelation model and a time-domain matching scheme,” IEEE Trans. Audio, Speech and Language Processing, vol. 20, no. 1, pp. 322-335, Jan. 2012. C. Llerena, L. Alvarez and D. Ayllon, “Pitch detection in pathological voices driven by three tailored classical pitch detection algorithms,” in Proc. 11th WSEAS Int. Conf. Signal Processing, Computational Geometry and Artificial Vision, Florence, 2011, pp. 113-118. F. Huang and T. Lee, “Pitch estimation in noisy speech based on temporal accumulation of spectrum peaks,” in Proc. 11th Annu. Conf. Int. Speech Communication Association, Chiba, 2010, pp. 641-644. Y. Tadokoro, T. Saito, Y. Suga and M. Natsui, “Pitch estimation for musical sound including percussion sound using comb filters and autocorrelation function,” in Proc. 8th WSEAS Int. Conf. Acoustics & Music: Theory & Applications, Vancouver, 2007, pp. 13-17. H. Farsi, “Target correlation approach for modification of low correlated pitch cycles of residual speech,” in Proc. 7th WSEAS Int. Conf. Signal Processing, Computational Geometry & Artificial Vision, Athens, 2007, pp. 153-158. L. Hui, B. Q. Dai and L. Wei, “A pitch detection algorithm based on AMDF and ACF,” in Proc. IEEE Int. Conf. Acoustic, Speech, and Signal Processing, Toulouse, 2006, vol. 1, pp. 377-380. A. Cheveigne and H. Kawahara, “YIN, a fundamental frequency estimation for speech and music,” J. Acoustical Society of America, vol. 111, no. 4, pp. 1917-1930, Apr. 2002. J. D. Markel, “The SIFT algorithm for fundamental frequency estimation,” IEEE Trans. Audio and Electroacoustics, vol. AU-20, no. 5, pp. 367-377, Dec. 1972. F. Itakura and S. Saito, “Speech information compression based on the maximum likelihood spectral estimation,” J. Acoustical Society of Japan, vol. 27, no. 9, pp. 463-472, 1971. C. Shahnaz, W. Zhu and M. O. Ahmad, “A pitch extraction algorithm in noise based on temporal and spectral representations,” in Proc. IEEE Int. Conf. Acoustic, Speech, and Signal Processing, Las Vagas, 2008, pp. 4477-4480. T. Shimamura and H. Kobayashi, “Weighted autocorrelation for pitch extraction of noisy speech,” IEEE Trans. Speech and Audio Processing, vol. 9, no. 7, pp. 727-730, Oct. 2001. D. Talkin, “A robust algorithm for pitch tracking (RAPT),” in Speech Coding and Synthesis, W. B. Kleijn and K. K. Paliwal, Eds. Amsterdam: Elsevier, 1995, pp. 496-518. K. Kasi and S. A. Zahorian, “Yet another algorithm for pitch tracking,” in Proc. IEEE Int. Conf. Acoustic, Speech, and Signal Processing, Florida, 2002, pp. 361-364. M. K. Hasan, S. Hussain, M. T. Hossain and M. N. Nazrul, “Signal reshaping using dominant harmonic for pitch estimation of noisy speech,” Signal Processing, vol. 86, pp. 1010-1018, May 2006. M. A. F. M. R. Hasan and T. Shimamura, “A fundamental frequency extraction method based on windowless and normalized autocorrelation functions,” in Proc. 6th WSEAS Int. Conf. Circuits, Systems, Signal and Telecommunications, Cambridge, 2012, pp. 305-309. J. Suzuki, “Speech processing by splicing of autocorrelation function,” in Proc. IEEE Int. Conf. Acoustic, Speech, and Signal Processing, Pennsylvania, 1976, pp. 713-716, Issue 3, Volume 6, 2012
204