International Journal of Mechanical Engineering and Robotics Research Vol. 7, No. 4, July 2018
An Elevator Kinematics Optimisation Method for Aggregate Production Planning Based on Fuzzy MOLP Model Pasura Aungkulanon Faculty of Industrial Technology, Phranakhon Rajabhat University, Bangkok, 10220, Thailand Email:
[email protected]
Pongchanun Luangpaiboon Industrial Statistics and Operational Research Unit (ISO-RU), Faculty of Engineering, Thammasat University Pathumthani, 12120, Thailand Email:
[email protected]
Roberto Montemanni Dalle Molle Institute for Artificial Intelligence (IDSIA), University of Applied Sciences of Southern Switzerland, Galleria 2, Manno 6928, Switzerland Email:
[email protected]
meet fluctuating or uncertain demand via forecasting and to make decisions and strategies concerning hiring, overtime, layoffs, backorders, subcontracting and inventory level including appropriate scarce resources so that the planned products and services will be available to meet all the customer requirements. Moreover, decisionmakers always need to formulate a model with the reallife situation with multiple objectives. The APP may consider both the minimisation of production cost, inventory levels, changes in workforce levels, production in overtime, subcontracting, changes in production rates, number of machine or tool set-ups, production or personnel idle time and the maximisation of profits and customer satisfaction [1]. In this paper, simultaneously minimise two objective functions of total production costs, carrying or backordering costs and rates of change in labor levels for planning non-metallic substances were applied. In this multi-objective linear programming (MOLP) model of the APP as shown below, there are some related constraints of inventory and labor levels, labor capacity in regular and overtime and non-negativity constraints on decision variables. The related constraints are from inventory levels (3-4), labor levels (5-6), labor capacity in regular and overtime (7) and non-negativity on decision variables (8). Parameters and constants definition are given in Table I. Many engineering optimisation problems have been focused on the case with only one goal or objective. However, in these problems many researchers and practitioners are increasingly aware of the presence of multiple objectives. A determination of the optimised decision variables would require simultaneous consideration of all of these objectives. Consequently, it is desirable for a decision maker (DM) to determine an overall optimal solution or a best compromise of all
Abstract—This study proposes a multi-objective linear programming model for solving the multi-product aggregate production planning (APP) decision problem for Topline Co., Ltd. in Thailand. The model attempts to minimise total production and work force costs and carrying inventory costs to bring a planning framework for the industrial resources management under complex information environment. The proposed model yields an efficient compromise solution and the overall levels of decision making satisfaction with the multiple objectives via the fuzzy programming using the elevator kinematics optimisation (EKO) algorithm including its hybridisations of harmony search and bee algorithms. The comparisons are made for two different levels of inventory. It can be concluded that the EKO is slightly more effective than the other hybrid approaches in terms of quality of solutions. However, there is no difference in required computation time. The basic idea is to produce reliable solution in search space with the random external command in escaping from local trap during searching for a better solution. Numerical results demonstrate the robustness and effectiveness of the developed EKO method. Index Terms—aggregate production planning, fuzzy programming, elevator kinematics optimisation, harmony search and bee algorithms
I.
INTRODUCTION
Aggregate production planning (APP) deals with matching capacity to forecasted demand and varies customer orders over the medium-time planning horizon, often from approximately T months in advance. The proposes of the APP are to generate the near future aggregated production levels for all N product types to Manuscript received January 9, 2018; revised April 1, 2018.
© 2018 Int. J. Mech. Eng. Rob. Res doi: 10.18178/ijmerr.7.4.422-427
422
International Journal of Mechanical Engineering and Robotics Research Vol. 7, No. 4, July 2018
In practical input data are usually fuzzy/imprecise because of incomplete or non-obtainable information. To formulate this fuzzy information, membership function is used. In the proposed model objective functions are fuzzy. The membership functions should increase monotonously from 0 to 1. It can be defined by the Positive-Ideal Solution (PIS) and the Negative-Ideal
desired characteristics simultaneously to improve its practicality. This problem is formulated as a multiobjective optimisation model subject to various requirements on problem constraints and decision variables. Fuzzy programming approach is an effective method for solving Multiple Objective Decision Making (MODM) problem. A fuzzy set can be classified based on a membership function, as denoted μ, which assigns to each objective. In general, the non-increasing and nondecreasing linear membership functions are frequently applied for the inequalities with less than or equal to and greater than or equal to relationships, respectively. Since the solution procedure of the fuzzy mathematical programming is to satisfy the fuzzy objective, a decision in a fuzzy environment is thus defined as the intersection of those membership functions corresponding to fuzzy objectives [2]. Hence, the optimal decision could be any alternative in such a decision space that can maximise the minimum attainable aspiration levels, represented by those corresponding memberships.
PIS
Solution (NIS). The Z k
NIS
when the kth objective is optimised and the Z k is the feasible and worst value of kth objective. Under the concept of min-operator, the feasible solution set is defined by interaction of the fuzzy objective set. The DM makes a decision with a maximum value in the feasible decision set. II.
N
T
T
(vit Pit )
i 1 t 1
(rW h H t
t
t
t
ft Ft ) (1)
t 1
Minimise carrying costs: T
(c I
(2)
Subject to Pit Ii,t 1 Iit dit
(3)
MIN Z 2
it it )
t 1
Iit Iit.MIN Wt Wt 1 Ht Ft 0 WMIN Wt WMAX Pit Kit *Wt 0 Pit , Iit ,Wt , Ht , Ft 0 Wt , Ht , Ft Integer
(4) (5) (6) (7) (8) (9)
TABLE I. PARAMETERS AND CONSTANTS DEFINITION OF THE MOLP MODEL vit cit rt dit Kit Ioi T N Pit Iit Ht Ft 𝐼𝑖𝑡𝑀𝐼𝑁 Wt WMin WMax
Definition of Parameters and Constants Production cost for product i in time t Inventory carrying cost for product i Work force level in regular time cost per employee hour in time t Demand forecasting for product i in time t (Units) Quantity to produce one worker in regular time for product i in time t Initial inventory level for product i (Units) Planning horizon Total number of products Quantity of i product to the time t Inventory level for product i in time t (Units) Worker hired in time t (man) Workers laid off in time t (man) Minimum inventory level available for product i in time t (Units) Total number of work force level in time t (man) Minimum work force level (man) available in time t Maximum work force level (man) available in time t
© 2018 Int. J. Mech. Eng. Rob. Res
THE ELEVATOR KINEMATICS OPTIMISATION (EKO) ALGORITHM
Today’s elevator systems utilise computer systems in controlling elevator directions and movements. Ordinary elevators simply wait for the instruction to travel upward or downward by the pressing of buttons located in front of floors. The elevators travel in line with given instructions. For example, if an elevator is parked on the third floor when a person presses a button on the first floor, the elevator will traverse downward. The elevator processes the next instruction only once doors have opened on the aforementioned floor, i.e., after the floor opens at the first floor, the elevator moves to the third and then fifth floor after people press buttons on the floors, respectively. Therefore, as the elevator is travelling upward, if a person presses a button on a lower floor, the elevator will ignore the aforementioned instruction because its movement is not consistent with the instruction; it will only return to receive the downward instruction after it has completed the latest instruction in the elevator system. The number of people getting on the elevator can be viewed as the preset answer based on the number that can be accommodated by the elevator under the elevator size conditions and the size of the building that affects the elevator concerning which speed, acceleration and control systems are preferred. This can be seen as specifying the intended structure as a single instruction or groups of instructions that influence the number of upward and downward movements of elevators, which depend on the number of instructions from inside the elevator, similar to solution search cycles for which the number of cycles have to be specified. Meanwhile, external elevator instructions can be seen as random answers under the condition of ignoring instructions that are not consistent with direction. Subsequently, the ability to set which floor the elevator should park at a given time is the most optimised status of the elevator or the optimal solution. Simple elevator movements can be divided into the following three types of a complete elevator movement, the elevator movement in which it cannot achieve maximum speed and the elevator movement in which it has not yet reached the point of speed transfer [3,4]. There are six EKO steps which
Minimise total production costs:
MIN Z1
is the best possible solution
423
International Journal of Mechanical Engineering and Robotics Research Vol. 7, No. 4, July 2018
consist of an initialization of elevator parameters, preparation of the elevator memory, improvement of a new floor from the elevator memory, an update of the elevator memory, randomization of external command and the determination of stopping criterion. These steps are described in the next subsections. Step 1: Initialise Elevator Parameters. The EKO algorithm parameters that are required to solve the optimisation problem are determined in this step: the elevator memory size (number of solutions or elevator sizes in elevator memory, (EM), velocity (v) and acceleration (a) are designed parameters of the elevator machine. Travel height interval (THI) is a fine turning distance for the design variable. The probability of selecting a floor (PSF) is the interval probability of each type of motion. The probability for a reject command (PRC) is the chance to reject the command for the opposite direction of current movement and stopping criterion are maximum number of replications and search iterations. Parameters of PRC and PSF are used to improve the solution quality. Both are defined in Step 3. Step 2: Prepare the Elevator Memory EM. In Step 2, each elevator or solution in the EM shown in Eq. (10), is randomly generated in search space and is sorted by the objective function values; 𝐸𝑀 = [𝑥1 , 𝑥2 , 𝑥3 , … , 𝑥𝐸𝑀 ]𝑇
is given by the equations below. The range of the global best (𝑋𝑔 ) and the best solutions (𝑋𝑏 ) is the constant velocity of elevator movement, where Rand (-1,1) is a continuous uniform random variable over (-1, 1) and 𝑇𝐻𝐼 is an arbitrary distance height for fine turning the continuous variable. 𝑇𝐻𝐼 is used to protects the excessive distant across the optimal point and approaches the infeasible region. This parameter also intends to increase accuracy for a neighbor search. 𝑇𝐻𝐼 has a value between 1 to 50 depending on the objective function. 𝑆1 =
2𝑎
2∗
(14)
𝑇𝐻𝐼
𝑉12 2𝑎
≤𝑑 ≤ 2∗
2 𝑉𝑀𝑎𝑥
(15)
2𝑎
A type 2 motion or a motion reaching a transitional acceleration is the movement in which an elevator does not reach an ending point of the transitional acceleration. Constant 𝑑 is calculated from the maximum distance of the type 2 motion at 𝑉𝑚𝑎𝑥 or from the maximum point of a transitional acceleration before changing the status to a constant velocity shown in (15). The interval of 𝑑 is shown above. A new position of the new solution or 𝑋𝑖+1 is given by the equation below, where 𝑋𝑔 is the global best solution, 𝑋𝑏 is the best solution at the current position and 𝑆𝑇 is a response interval of an objective function can be calculated from (16,17).
(10)
1
3 𝑉𝑚𝑎𝑥
3𝑎
𝑉1
𝑆2 = ( ) (
− 𝑉12 ) + 𝑆1
𝑁𝑒𝑤 𝑋𝑖 = 𝑋𝑖 + 𝑅𝑎𝑛𝑑(−1,1) ×
(16) 𝑆2
(17)
𝑇𝐻𝐼
The condition C for type 3 motion 𝑑 ≥ 2∗
2 𝑉𝑀𝑎𝑥
(18)
2𝑎
A type 3 motion occurs when there is a circumstance having more than one command to an elevator. There are various types of motion for an actual elevator. The type 3 reaches a full speed and the minimum constant 𝑑 is then calculated from the maximum distance at 𝑉𝑀 and corresponding distance can be represented by (18). The long run movement will be calculated and the new position of 𝑋𝑖+1 can be calculated in (20,21). 𝑆1 =
(12)
𝑉12
(19)
2𝑎 1
3 𝑉𝑚𝑎𝑥
3𝑎
𝑉1
𝑆2 = ( ) (
For a type 1 motion or a motion not reaching a transitional acceleration, 𝑆1 is the travel distance during a constant acceleration, which can be applied to an evolutionary process of the EM group. Constant 𝑑 is calculated from the maximum distance of type 1 at 𝑉1 from a start to a stop of the total movement. A new position based on this motion type of the new solution or © 2018 Int. J. Mech. Eng. Rob. Res
𝑆1
The condition B for type 2 motion
The calculated distance is used for choosing one among three motion conditions of A, B and C. The long distance applies condition A, while the shorter distance applies conditions B and C, respectively. The condition A for type 1 motion 𝑑 ≤ 2∗
(13)
2𝑎
𝑁𝑒𝑤 𝑋𝑖 = 𝑋𝑖 + 𝑅𝑎𝑛𝑑(−1,1) ×
The calculated distance is used for choosing one among three motion conditions of A, B and C. The long distance applies condition A, while the shorter distance applies conditions B and C, respectively. Step 3: Improve the status of new floor selection from the previous EM. The process starts from generating the probability of 𝑃1 which is a random number between 0 and 1. 𝑃𝑅𝐶, is the probability to make a decision to either accept or reject the command from inside and outside elevators. If 𝑃1 is larger than 𝑃𝑅𝐶, improvement processes will be applied. If 𝑃1 is smaller than 𝑃𝑅𝐶, a new position will be generated by random command process. The improvement process is calculated a distance (𝑑) in (11). The interval of 𝑑 can be calculated from the following equation. 𝑑 = 𝑎𝑏𝑠𝑜𝑙𝑢𝑡𝑒 (𝑀𝑎𝑥 𝑥𝐸𝑀𝑀𝑖𝑛 − 𝑀𝑖𝑛 𝑥𝐸𝑀𝑀𝑎𝑥 ) (11)
𝑉12
𝑉12
− 𝑉12 ) + 𝑆1
𝑁𝑒𝑤 𝑋𝑖 = 𝑋𝑖 + 𝑅𝑎𝑛𝑑(−1,1) ×
(20) 𝑆2 +(𝑋𝑏 −𝑋𝑔 ) 𝑇𝐻𝐼
(21)
Step 4: Update the EM. In Step 4, the EM is sorted by the objective function value. If the new elevator status value is better than the
424
International Journal of Mechanical Engineering and Robotics Research Vol. 7, No. 4, July 2018
with its current monthly production capacity levels. The summary of order from sale department shows that the demand is very uncertain which leads to inefficient manufacturing planning process. There is a serious aspect of the small or medium company in an attempt to develop a plan of production, trying to deal with the impact that fluctuations in demand due to seasonal changes. These current problems could affect the future order. Real data was used in the analysis with the following specifications: timeframe for analysis at six months; products composed of Product A (jumpsuit), Product B (smock) and Product C (hand cover, hood and shoes). The initial stock for each type of product is as follows: Product A had 200 units; Product B had 120 units and Product C had 100 units. The minimum product in stock for any given type for each product is 50 units. The employment capital for each employee is 3,000 baht. The cost of hiring employees to resign would be 6,000 baht per person, and the mean employee salary is 12,000 baht per month. The highest number of employees is 17 persons per shift, and the lowest number of employees is 13 persons per shift. At present, a total of 13 employees work three shifts per day (8 hours per shift). Preliminary information is composed of demand for goods, raw material costs, products in stock and production capacity for each product as shown in Table II.
worst status in the EM, the new solution is included in the EM. Step 5: Generate a random external command. In this step, the random external command occurs when the elevator accepts an additional command such as changing the destination or direction. In this situation, the process will randomly search for the new solution within the search space. The new random solution is then included in the EM and the existing worst solution is excluded from the EM. The EM is then sorted by the objective function value. Step 6: Check stopping criterion If the stopping criterion is satisfied, computation is terminated. Otherwise, steps 2, 3, 4 and 5 are repeated. These sequential procedures of the proposed EKO will be tested on the fuzzy MOLP. III. COMPUTATIONAL RESULTS AND ANALYSES Topline (Thailand) Co., Ltd. is a small and medium enterprise (SME) in Thailand. It is a manufacturer of suits wearing in a clean room in electronic and food industries in Thailand. A continuous production of the firm operates
TABLE II. DATA FROM COMPANY Product Period 1 2 3 4 5 6
A
B
C
d it
v it
cit
K it
d it
v it
cit
K it
d it
v it
cit
K it
0011 0711 0011 511 871 511
011 011 011 011 011 011
57 57 57 57 57 57
001 011 001 51 011 001
071 811 511 071 011 011
081 081 081 081 081 081
57 57 57 57 57 57
50 52 55 45 50 52
011 071 711 011 711 071
300 300 300 300 300 300
85 85 85 85 85 85
68 73 75 65 68 70
initial size of patches (ngh) = 0.1. The EKO parameters were set as: EM = 30, an acceleration (a) = 2, a maximal velocity (Vmax) = 2.5, THI = 20 and PRC =0.95. All three algorithms were executed with the 2000 iterative searches. In each problem, each algorithm was repeated 15 times. The performance of three algorithms was presented and compared. The objective of APP model is determined from all previous data. The comparisons are made for two levels of inventory (I) in the APP models between 150 and 250 tons. TABLE III shows the values of PIS and NIS for both inventory levels. The objective of fuzzy techniques to APP model is to minimise all two objectives over a 6month period. The EKO found better solutions based on Z1 and Z2. Summary of average λ is shown in TABLE IV, which indicates the high performance of all metaheuristics methods in finding optimal values. The results of the best value of objective functions on 150 inventory level are shown in TABLE IV. The minimal inventory cost of the EKO showed better solution compared to HHSA and HBA. The harmony search (HSA) and bee algorithms (BA) have been commonly used in various researches. However, some research found lower convergence and required more iterative moves to
The computational procedure described above a computer simulation program was implemented in a Visual C# computer program. A Laptop ASUS A45V Series was used for computational experiments. A comparison of the conventional procedures of EKO and its hybridisations of harmony search (HHSA) and bee (HBA) algorithms and results are presented in this section. The three algorithms were implemented on the computer simulation program of the fuzzy linear programming approach of the APP model. Each algorithm has its own influential parameters that affect its performance in terms of solution quality and computational time. To achieve the most preferable parameter choices that suit the tested manufacturing problems, a large number of experiments were conducted. In each algorithm, the parameter setting values were based on previous literatures. The HSA parameters [5,6] of HMS, probability of HMCR and probability of PAR are set at 30, 0.90 and 0.35, respectively. The BA parameters [7,8] were set as follows: the number of scout bees (n) = 50, the number of sites selected out of n visited sites (m) = 10, the number of best sites out of m selected sites (e) = 5, the number of bees recruited for best e sites (nep) = 5, the number of bees recruited for the other m-e selected site (nsp) = 10, the
© 2018 Int. J. Mech. Eng. Rob. Res
425
International Journal of Mechanical Engineering and Robotics Research Vol. 7, No. 4, July 2018
TABLE III. INITIAL RESULTS BY OPTIMISING EACH OBJECTIVE WITH THE INVENTORY LEVEL OF 150 AND 250
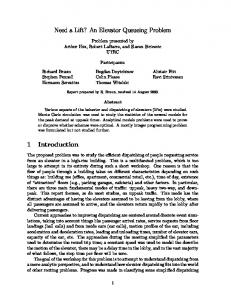
converge to the optimum. This paper hybridised the HSA and BA with the elevator kinematics optimisation as HHSA and HBA, respectively. It aimed to increase performance of the HSA and BA with two EKO concepts of maximising satisfaction of passengers and minimising travelling time via three types of elevator kinematic functions. When the EKO, HHSA and HBA were compared, the EKO and its hybridisations seem to be better in terms of speed of convergence when compared to the original ones as shown in Fig. 1. For HHSA and HBA can also produce new possible solution for process improvement.
Membership interval
Minimal total production cost
Minimal carrying cost
Maximise value (PIS)
7,000,000.00
1,100,000.00
Minimise value (NIS)
6,500,000.00
800,000.00
pk
500,000.00
300,000.00
TABLE IV. EXPERIMENTAL RESULTS ON THE AVERAGE OF ON THE λ INVENTORY OF 150 Algorithms
Z1
Z2
λ1
λ2
Mean of λ
EKO
6,722,340
816,955
0.97
0.98
0.97
HHSA
6,751,100
816,955
0.96
0.98
0.97
HBA
6,784,980
815,325
0.96
0.98
0.97
ACKNOWLEDGMENT The first and second authors wish to thank the Faculty of Industrial Technology, Phranakhon Rajabhat University and the Faculty of Engineering, Thammasat University, respectively, for the financial support. REFERENCES [1]
[2]
[3] Figure 1. Speed of Convergence for I = 250 and 150.
IV.
[4]
CONCLUSIONS
In this study, an application of a fuzzy function approach on two levels of inventory to the APP extended model of Masud and Hwang was proposed. Objectives attempts to minimise total production and work force costs and carrying inventory costs so that in the end the organisation gets the optimal production plan with the overall highest levels of decision making satisfaction. The EKO has been successfully applied to this benchmarking engineering optimisation problem. Numerical results reveal that the EKO can find slightly better solutions including the speed of convergence when compared to others and is a powerful search algorithm. The impacts of algorithm parameters characterise the variation of the objective function, and their values is crucially important in determining the speed of the convergence and how the algorithm behaves. For future researchers a strategy for tuning these parameters is needed to be investigated. © 2018 Int. J. Mech. Eng. Rob. Res
[5]
[6]
[7]
[8]
426
A. S. M. Masud and C. L. Hwang, “An aggregate production planning model and application of three multiple objective decision methods,” International Journal of Production Research, vol. 18, 1980, pp. 741–752. P. Aungkulanon, B. Phruksaphanrat, and P. Luangpaiboon, “Harmony search algorithm with various evolutionary elements for fuzzy aggregate production planning intelligent control and innovative computing,” The Series Lecture Notes in Electrical Engineering, vol. 110, 2011, pp 189-201. P. Aungkulanon and P. Luangpaiboon, “Vertical transportation systems embedded on shuffled frog leaping algorithm for manufacturing optimisation problems in industries,” SpringerPlus, 2016, 5, 831. B. Caporale, R. S. Caporale, and G. S. Strakosch, The Vertical Transportation Handbook, 4th ed., Hoboken John Wiley & Sons, Inc., 2010, pp 119-131. Z. W. Geem, J. H. Kim, and G. V. Loganathan, “A new heuristic optimisation algorithm: harmony search. Simulation,” vol. 76, no. 2, 2001. Z. W. Geem and H. Hwangbo, “Application of harmony search to multi-objective optimisation for satellite heat pipe design,” Paper presented at the Proceedings of US-Korea Conference on Science, Technology, & Entrepreneurship (UKC2006), Teaneck, NJ, USA. D. T. Pham and H. A. Darwish, “Using the bees algorithm with Kalman filtering to train an artificial neural network for pattern classification,” Journal of Systems and Control Engineering, vol. 224, no. 7, 2010, pp. 885-892. D. T. Pham, Z. Muhamad, M. Mahmuddin, A. Ghanbarzadeh, and E. S. O. Koc, “Using the bees algorithm to optimise a support vector machine for wood 107 defect classification,” Journal of Systems and Control Engineering, vol. 224, no. 7, pp. 885-892, 2010.
International Journal of Mechanical Engineering and Robotics Research Vol. 7, No. 4, July 2018
P. Luangpaiboon has been a lecturer, and Professor, in the Industrial Statistics and Operational Research Unit (ISO-RU), the department of Industrial Engineering at Thammasat University, THAILAND since 1995. He graduated his Bachelor (1989-1993) and Master Degrees (1993-1995) in Industrial Engineering from Kasetsart University, THAILAND and Ph. D. (1997-2000) in Engineering Mathematics from Newcastle upon Tyne, ENGLAND. His research interests consist of meta-heuristics, optimisation, industrial statistics, the design and analysis of experiments and response surface methodology. His email address is
[email protected].
Roberto Montemanni is professor of advanced algorithms at the University of Applied Sciences of Southern Switzerland. He is also active as senior researcher at the Dalle Molle Institute for Artificial Intelligence and as research advisor for PhD students at the University of Lugano, Switzerland. He obtained a Laurea degree in Computer Science from the University of Bologna, Italy in 1999 and a Ph.D. in Applied Mathematics from the University of Glamorgan, UK in 2002. He is leading basic and applied research projects both at national and international levels. His main research interests are in the fields of mathematical modeling and algorithms, with applications in transportations and logistics.
Pasura Aungkulanon received a bachelor degree in industrial engineering from Kasetsart University Thailand in 2003. Then, he continued higher education. He completed his Master and Ph.D. in industrial engineering from Thammasart University Thailand in 2010 and 2016 respectively. Currently, he works as a lecturer at the Faculty of Industrial Technology, Phranakorn Rajabhat University. His research areas include operational research, artificial intelligence, metaheuristic methods, logistics and supply chain system.
© 2018 Int. J. Mech. Eng. Rob. Res
427