Aug 2, 2016 - its development and present the actual experiment. ..... are important to the experiment, namely: (a) UML
An Empirical Evaluation of Visualisation in Software Design Modelling: the VCL vs UML+OCL experiment
Nuno Am´alio Birmingham City University School of Computing and Digital Technology Millennium Point, Cursor Street Birmingham B6 7XG, UK
Lionel Briand SnT Center University of Luxembourg 4, rue Alphonse Weicker L-2721 Luxembourg
Pierre Kelsen University of Luxembourg 6, rue R. Coudenhove-Kalergi L-1359 Luxembourg
TR-LASSY-13-05
ii
Abstract Popular notations of software and systems engineering, such as the standards UML and SysML, have an intrinsic visual nature, enabling them to tap into the cognitive benefits that visual representations are know to provide. However, these widespread notations fail to exploit the full cognitive potential of visual representations; despite their visual appeal, they fail to be cognitive effective. The Visual Contract Language (VCL) tries to improve the visual effectiveness and level of rigour of popular visual notations of software and systems design; it tries to fully exploit the cognitive potential of visual representations and increase the range of things that can be described visually. VCL embodies a diagrammatic modelling approach that does pictorially what is traditionally done textually. This report presents the work that was undertaken to rigorously evaluate VCL. It presents the design of a controlled experiment to evaluate the effectiveness of VCL together with the results of the experiment. The experiment compares VCL against UML supplemented with OCL, which are widely seen as industry standards.
ii
Contents Contents
iii
List of Figures
vii
List of Tables
xi
Acronyms
1
1 Introduction 1.1 Why VCL? . . . . . . . . . . . 1.2 The Visual Contract Language 1.3 Related Work . . . . . . . . . . 1.3.1 Data Modelling . . . . . 1.3.2 UML . . . . . . . . . . .
. . . . .
3 3 4 4 5 5
. . . . .
. . . . .
. . . . .
. . . . .
. . . . .
. . . . .
2 The Scrutiny and its Experiment 2.1 Scope, Objective and Effects . . . . . . . 2.1.1 What this experiment is not about 2.2 Research Questions . . . . . . . . . . . . . 2.2.1 RQ1: Model Construction . . . . . 2.2.2 RQ2: Problem Comprehension . . 2.2.3 RQ3: Model Usage . . . . . . . . . 2.2.4 RQ4, Usefulness and Ease of Use . 2.2.5 RQ5, Usability . . . . . . . . . . . 2.2.6 RQ6, Overall Perception . . . . . . 2.3 Variables and Hypotheses . . . . . . . . . 2.4 Recruitment and Experiment Venues . . .
. . . . .
. . . . . . . . . . .
3 Experimental Setup 3.1 Recruitment . . . . . . . . . . . . . . . . . . 3.2 Paired Comparison Design . . . . . . . . . . 3.3 Tasks . . . . . . . . . . . . . . . . . . . . . 3.4 Instrumentation . . . . . . . . . . . . . . . . 3.4.1 Requirements documents and sample iii
. . . . .
. . . . .
. . . . .
. . . . .
. . . . .
. . . . .
. . . . .
. . . . .
. . . . .
. . . . .
. . . . .
. . . . .
. . . . .
. . . . .
. . . . .
. . . . .
. . . . .
. . . . .
. . . . .
. . . . .
. . . . . . . . . . .
. . . . . . . . . . .
. . . . . . . . . . .
. . . . . . . . . . .
. . . . . . . . . . .
. . . . . . . . . . .
. . . . . . . . . . .
. . . . . . . . . . .
. . . . . . . . . . .
. . . . . . . . . . .
. . . . . . . . . . .
. . . . . . . . . . .
. . . . . . . . . . .
. . . . . . . . . . .
. . . . . . . . . . .
. . . . . . . . . . .
. . . . . . . . . . .
7 7 8 8 8 9 9 9 9 9 9 10
. . . . . . . . . . . . . . . . . . . . models
. . . . .
. . . . .
. . . . .
. . . . .
. . . . .
. . . . .
. . . . .
. . . . .
. . . . .
. . . . .
. . . . .
. . . . .
. . . . .
. . . . .
. . . . .
. . . . .
13 13 13 14 14 15
. . . . . . . . . . .
. . . . . . . . . . .
. . . . . . . . . . .
. . . . . . . . . . .
iv
CONTENTS
4 Experimental Results 4.1 Preliminaries . . . . . . . . . . . . . . . . 4.1.1 On the Statistical Analysis . . . . Means, Proportions and their CIs . Hypothesis Testing . . . . . . . . . Effect Sizes . . . . . . . . . . . . . 4.1.2 On Graphical representations . . . 4.2 Results: a Bird’s Eye View . . . . . . . . 4.3 Model Construction . . . . . . . . . . . . 4.3.1 Completeness . . . . . . . . . . . . State Space . . . . . . . . . . . . . Invariants . . . . . . . . . . . . . . Operations . . . . . . . . . . . . . 4.3.2 Accuracy . . . . . . . . . . . . . . State Space . . . . . . . . . . . . . Invariants . . . . . . . . . . . . . . Operations . . . . . . . . . . . . . 4.3.3 Perceived Performance . . . . . . . 4.3.4 Discussion . . . . . . . . . . . . . . 4.4 Comprehension and Model Usage . . . . . 4.4.1 Task Performance . . . . . . . . . 4.4.2 Perceived Performance . . . . . . . 4.4.3 Summary . . . . . . . . . . . . . . 4.5 Usefulness and Ease of Use . . . . . . . . 4.6 Usability . . . . . . . . . . . . . . . . . . . 4.7 Preferred Notation . . . . . . . . . . . . .
. . . . . . . . . . . . . . . . . . . . . . . . .
. . . . . . . . . . . . . . . . . . . . . . . . .
. . . . . . . . . . . . . . . . . . . . . . . . .
. . . . . . . . . . . . . . . . . . . . . . . . .
. . . . . . . . . . . . . . . . . . . . . . . . .
. . . . . . . . . . . . . . . . . . . . . . . . .
. . . . . . . . . . . . . . . . . . . . . . . . .
. . . . . . . . . . . . . . . . . . . . . . . . .
. . . . . . . . . . . . . . . . . . . . . . . . .
. . . . . . . . . . . . . . . . . . . . . . . . .
. . . . . . . . . . . . . . . . . . . . . . . . .
. . . . . . . . . . . . . . . . . . . . . . . . .
. . . . . . . . . . . . . . . . . . . . . . . . .
. . . . . . . . . . . . . . . . . . . . . . . . .
. . . . . . . . . . . . . . . . . . . . . . . . .
. . . . . . . . . . . . . . . . . . . . . . . . .
. . . . . . . . . . . . . . . . . . . . . . . . .
. . . . . . . . . . . . . . . . . . . . . . . . .
. . . . . . . . . . . . . . . . . . . . . . . . .
. . . . . . . . . . . . . . . . . . . . . . . . .
. . . . . . . . . . . . . . . . . . . . . . . . .
. . . . . . . . . . . . . . . . . . . . . . . . .
17 17 17 17 18 18 19 19 21 21 21 21 24 24 24 24 24 24 27 29 29 29 32 33 36 37
5 Threats to Validity
41
References
43
A VCL in Nutshell A.1 Visual Primitives . . . . . . A.2 VCL Diagram Types . . . . A.3 Package Diagrams . . . . . A.3.1 Structural Diagrams A.4 Behaviour Diagrams . . . . A.5 Assertion Diagrams . . . . . A.6 Contract Diagrams . . . . .
. . . . . . .
47 47 48 48 49 51 52 55
B Experiment Case Studies B.1 University Library . . . . . . . . . . . . . . . . . . . . . . . . . . . . . . . . . . . B.2 Flight Booking . . . . . . . . . . . . . . . . . . . . . . . . . . . . . . . . . . . . .
57 57 58
C University Library Materials C.1 Starting Models . . . . . . . C.2 Intermediate Models . . . . C.3 Defect detection Models . . C.4 Solution Models . . . . . . .
61 61 62 67 76
. . . . . . .
. . . .
. . . . . . .
. . . .
. . . . . . .
. . . .
. . . . . . .
. . . .
. . . . . . .
. . . .
. . . . . . .
. . . .
. . . . . . .
. . . .
. . . . . . .
. . . .
. . . . . . .
. . . .
. . . . . . .
. . . .
. . . . . . .
. . . .
. . . . . . .
. . . .
. . . . . . .
. . . .
. . . . . . .
. . . .
. . . . . . .
. . . .
. . . . . . .
. . . .
. . . . . . .
. . . .
. . . . . . .
. . . .
. . . . . . .
. . . .
. . . . . . .
. . . .
. . . . . . .
. . . .
. . . . . . .
. . . .
. . . . . . .
. . . .
. . . . . . .
. . . .
. . . . . . .
. . . .
. . . . . . .
. . . .
. . . . . . .
. . . .
. . . . . . .
. . . .
. . . . . . .
. . . .
. . . .
CONTENTS D Flight Booking Materials D.1 Starting Models . . . . . D.2 Intermediate Models . . D.3 Defect detection Models D.4 Solution Models . . . . .
v
. . . .
. . . .
. . . .
. . . .
. . . .
. . . .
. . . .
. . . .
. . . .
. . . .
. . . .
. . . .
. . . .
. . . .
. . . .
. . . .
. . . .
. . . .
. . . .
. . . .
. . . .
85 . 85 . 87 . 92 . 105
E Questionnaires E.1 Ability Assessment . . . . . . . . . . . . . . E.2 Problem Comprehension, University Library E.2.1 University Library . . . . . . . . . . E.2.2 Flight Booking . . . . . . . . . . . . E.3 Defect Detection, University Library . . . . E.3.1 University Library . . . . . . . . . . E.3.2 Flight Booking . . . . . . . . . . . . E.4 Model Comprehension . . . . . . . . . . . . E.4.1 University Library . . . . . . . . . . E.4.2 Flight Booking . . . . . . . . . . . . E.5 Debriefing . . . . . . . . . . . . . . . . . . .
. . . . . . . . . . .
. . . . . . . . . . .
. . . . . . . . . . .
. . . . . . . . . . .
. . . . . . . . . . .
. . . . . . . . . . .
. . . . . . . . . . .
. . . . . . . . . . .
. . . . . . . . . . .
. . . . . . . . . . .
. . . . . . . . . . .
. . . . . . . . . . .
. . . . . . . . . . .
. . . . . . . . . . .
. . . . . . . . . . .
. . . . . . . . . . .
. . . . . . . . . . .
. . . . . . . . . . .
. . . . . . . . . . .
. . . . . . . . . . .
. . . . . . . . . . .
. . . .
. . . .
. . . .
. . . .
. . . .
. . . .
. . . .
. . . .
. . . .
. . . .
117 117 127 127 134 143 143 148 153 153 160 167
vi
CONTENTS
List of Figures 4.1
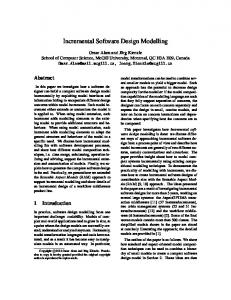
Model completeness for state space, invariants and operations. (CS UL = University Library case study (CS); CS FB = Flight Booking case study; FCUL, FCT/UNL, UL and UY are the different groups/institutions) . . . . . . . . . . .
23
Model accuracy for state space, invariants and operations. (CS UL = University Library case study (CS); CS FB = Flight Booking CS; FCUL, FCT/UNL, UL and UY are the different groups/institutions) . . . . . . . . . . . . . . . . . . . . . . .
26
Notation that users felt gave them a better performance in the model construction tasks as obtained from responses to debriefing questionnaire. (SS = State Space; Is = Invariants; Os = Operations; NP = No preferance) . . . . . . . . . . . . . .
27
Forest Plots of effect sizes and their CIs derived from actual and perceived performances in the model construction tasks. . . . . . . . . . . . . . . . . . . . . .
28
Model usage and comprehension tasks (CS UL = University Library case study (CS); CS FB = Flight Booking CS; FCUL, FCT/UNL, UL and UY are the different groups/institutions). . . . . . . . . . . . . . . . . . . . . . . . . . . . . . . . . . .
31
Notation that users felt gave them a better performance in the model usage and comprehension tasks: problem comprehension, defect detection and model comprehension according to responses to debriefing questionnaire (PC = Problem Comprehension; DD = Defect Detection; MC = Model Comprehension) . . . . .
32
Forest Plots of effect sizes of actual and perceived performances in the model usage and comprehension tasks. . . . . . . . . . . . . . . . . . . . . . . . . . . . . . . .
33
4.8
Distributions of usefulness and ease of use (indirect questions) . . . . . . . . . . .
34
4.9
Distributions of usefulness and ease of use in the direct questions (variables: DU and DEoU) . . . . . . . . . . . . . . . . . . . . . . . . . . . . . . . . . . . . . . .
35
4.10 Usability results derived from responses to the debriefing questionnaire. (NP= No preference. Criteria: R = Reading; N = Navigation; MOs = Maps and overviews; LEC = live error checking; LaF = Look and feel; C=Cohesion; L=Learnability; CS=Comfort Satisfaction. Significance: * corresponds to α = .05, ** to α = .01, and *** to α = .001. Effect magnitude of h: ø is null (| h |≤ .05), • is small (.0.5 AcO(UML)
Perceived Modelling Construction
H70 : PMS (VCL) = PMS (UML) H80 : PMI (VCL) = PMS (UML) H90 : PMO(VCL) = PMO(UML)
H7a : PMS (VCL) > PMS (UML) H8a : PMS (VCL) > PMS (UML) H9a : PMO(VCL) > PMO(UML)
Comprehension and Model Usage
0 H10 : PC (VCL) = PC (UML) 0 H11 : DD(VCL) = DD(UML) 0 H12 : MC (VCL) = MC (UML)
a H10 : PC (VCL) > PC (UML) a H11 : DD(VCL) > DD(UML) a H12 : MC (VCL) > MC (UML)
Perceived Comprehension and Usage
0 H13 : PPC (VCL) = PPC (UML) 0 H14 : PDD(VCL) = PDD(UML) 0 H15 : PMC (VCL) = PMC (UML)
a H13 : PPC (VCL) > PPC (UML) a H14 : PDD(VCL) > PDD(UML) a H15 : PMC (VCL) > PMC (UML)
Usefulnes and Ease of Use
0 H16 : U (VCL) = U (UML) 0 H17 : EoU (VCL) = EoU (UML)
a H16 : U (VCL) > U (UML) a H17 : EoU (VCL) > EoU (UML)
0 H18 : 0 H19 : 0 H20 : 0 H21 : 0 H22 : 0 H23 : 0 H24 : 0 H25 : 0 H26 : 0 H27 :
DU (VCL) = DU (UML) DEoU (VCL) = DEoU (UML) UsR(VCL) = UsR(UML) UsN (VCL) = UsN (UML) UsMOs(VCL) = UsMOs(UML) UsLEC (VCL) = UsLEC (UML) UsLF (VCL) = UsLF (UML) UsC (VCL) = UsC (UML) UsL(VCL) = UsL(UML) UsCS (VCL) = UsCS (UML)
a H18 : a H19 : a H20 : a H21 : a H22 : a H23 : a H24 : a H25 : a H26 : a H27 :
DU (VCL) > DU (UML) DEoU (VCL) > DEoU (UML) UsR(VCL) > UsR(UML) UsN (VCL) > UsN (UML) UsMOs(VCL) > UsMOs(UML) UsLEC (VCL) > UsLEC (UML) UsLF (VCL) > UsLF (UML) UsC (VCL) > UsC (UML) UsL(VCL) > UsL(UML) UsCS (VCL) > UsCS (UML)
Preferred Notation
0 H28 : 0 H29 : 0 H30 : 0 H31 : 0 H32 :
PNS (VCL) = PNS (UML) PNI (VCL) = PNI (UML) PNO(VCL) = PNO(UML) PN (VCL) = PN (UML) FN (VCL) = FN (UML)
a H28 : a H29 : a H30 : a H31 : a H32 :
PNS (VCL) > PNS (UML) PNI (VCL) > PNI (UML) PNO(VCL) > PNO(UML) PN (VCL) > PN (UML) FN (VCL) > FN (UML)
Appraisal
0 H33 : Appr (VCL) = Appr (UML)
Usability
a H33 : Appr (VCL) > Appr (UML)
Chapter 3
Experimental Setup This chapter presents the design choices that underlie the experiment presented here.
3.1
Recruitment
The experiment was executed in four different venues: (a) Faculty of Sciences of the University of Lisbon, Portugal (FCUL); (b) Faculty of Science and Technology of the New University of Lisbon, Portugal (FCT/UNL); (c) University of Luxembourg (UL); and (d) University of York, UK (UY). Software engineering and computer science students were recruited from student mailing lists of these universities; university lecturers advertised the experiment in relevant classes. Students were rewarded with A C50 vouchers for taking part in the experiment. The goal was to involve computer scientists and software engineers. Subjects were required to have completed or be in the process of completing a course on object-oriented modelling using UML. The experiment’s training amounted to 4 to 6 hours: two hours for each notation was mandatory and one extra hour for each notation was optional; it intended to complement the existing education of the participants to provide them with the means to carry out the tasks of the experiment competently. The training had a practical nature to prepare them for the challenging tasks of model construction in the experiment; it consisted of modelling a given system from a requirements description using the notations under study, VCL and UML+OCL, and the supporting tools, Visual Contract Builder (VCB) [AG15, AGK11]1 and Papyrus/UML2 .
3.2
Paired Comparison Design
This experiment involves one factor whose effect is of interest to us: the design modelling notation. This factor has two treatments: VCL and UML+OCL. The experiment is to use a paired comparison (crossover, or within-subjects) design [WRH+ 12]. This means that subjects will have to work on both systems. The rationale for doing this is as follows: (a) maximise the number of data points (observations) to increase statistical power and (b) ensure that the differences in complexity for the systems used in the tasks do not bias the results. Our design is based on a randomised block design to account for the subjects’ ability during data analysis. Subjects were therefore grouped into two blocks: High Ability and Medium Ability. This was done based on a questionnaire that assesses the ability of subjects in several aspects 1 http://vcl.gforge.uni.lu/ 2 http://www.eclipse.org/papyrus/
13
14
CHAPTER 3. EXPERIMENTAL SETUP
that are important to the experiment, namely: (a) UML or object-oriented modelling ability, (b) OCL ability, (c) VCL ability, (d) ability in discrete mathematics and formal modelling. Based on these factors subjects were assessed on an ordinal scale from 1 to 5. Subjects with a score above 3.5 are placed in the High Ability block.
3.3
Tasks
The tasks of the experiment are designed to feed our dependent variables (table 2.1) to enable the statistical testing of our hypothesis. In total, subjects had to complete all the tasks in a session of two hours. The tasks are follows: • Model construction, state space and invariants. This task feeds the dependent variables associated with completeness and accuracy of state space and invariants, namely, CoS , CoI , AcS and AcI . Subjects were given a requirements documents of a system to be modelled and a partial starting structural model that they were asked to complete; they were given 30 minutes to execute this task. • Model construction, operations. This task, which followed the task on the model construction of state space and invariants, is associated with the dependent variables of completeness and accuracy of operations, namely, CoO and AcO. Subjects are given a complete structural model and they are are asked to fully specify two operations of the system. They were given 35 minutes to execute this task. • Problem comprehension. Feeding the problem comprehension dependent variable (PC ), this task is executed right after the model construction tasks to measure how well the subjects comprehended the problem and if there was any effect from the notations under study on comprehension. Subjects were asked to answer a questionnaire on problem comprehension within 15 minutes. • Defect Detection. In this task, associated with the defect detection (DD) dependent variable, subjects were given a model of the case study with seeded defects and they were asked to identify as much defects as they could. The models contained 38 seeded defects and subjects were given 25 minutes to complete the task. • Model Comprehension. In this task, associated with the model comprehension (MC ) dependent variable, subjects were given a correct model of the case study and they were asked questions about it. Subjects were given 15 minutes to complete the task.
3.4
Instrumentation
Instrumentation deals with the means to perform and monitor a controlled experiment in order to derive quantitative results to be subject to a rigorous analysis. The materials used in the experiment presented here comprise: • requirements documents and sample models, • questionnaires to assess problem and model comprehension, • de-briefing survey. These are detailed in the sections that follow.
3.4. INSTRUMENTATION
3.4.1
15
Requirements documents and sample models
The tasks of the experiment were designed around the following two case studies, which are described in detail in appendix B: • University Library. This is a system of a typical university Library. It enables users to borrow copies of books. There are three kinds of users: students, research students and academic staff. Each kind of user has different borrowing entitlements. • Flight Booking. This a simple system to manage flight reservations. Subjects were given out the descriptions of the case studies in appendix B to model at the start of each session.
16
CHAPTER 3. EXPERIMENTAL SETUP
Chapter 4
Experimental Results VCL’s goal is to facilitate software design modelling through the use of visualisation. The controlled experiment presented here investigates the effectiveness of VCL as a visual notation by comparing it with the standard modelling notations UML and OCL. This chapter presents and discusses the results of the controlled experiment.
4.1 4.1.1
Preliminaries On the Statistical Analysis
The experiment is designed to enable Null Hypothesis Significance Testing (NHST). Following guidelines advocated by methodologists, influential journals and leading figures in social science research, we supplement our NHST-based analysis with effect sizes (ESs) and confidence intervals. ESs are quantitative estimates of the magnitude of some effect of interest; often, they quantify the size of a difference between two groups. Confidence intervals (CIs) indicate the precision of a point estimate or measurement, providing a range of plausible values within which we can have a degree of confidence that the estimate is not due to chance. The statistical analysis presented in the sequel has been carried out using the R statistical software [R C15]. R was used to perform statistical calculations and generate graphs describing data. Means, Proportions and their CIs Our analysis emphasises measures of central tendency. For continuous variables, we rely on the mean (or average) taken from samples of a population and constituting point estimates. To enhance the precision of such estimates, we calculate the 95% CI interval of a mean, in terms of its lower and upper bounds; this is calculated using the classical formula [Cum12]: 95%CI = M ± 1.96 × SE
SE =
SD √ N
Above: M is the sample mean, SE stands for standard error, SD is the standard deviation, and N is the size of the sample. The value of 1.96 corresponds to the Z score representing the 95% range in the normal distribution. Categorical variables are scrutinised based on proportions, a measurement akin to the mean. A proportion is the fraction of a number of discrete things that have a property of interest [Cum12] – if x is the number of such things, and N is the total number of things, the proportion is 17
18
CHAPTER 4. EXPERIMENTAL RESULTS
P = x /N . We derive proportions from frequency distributions. Like means, proportions are point estimates that can be made precise by providing a CI. To calculate CIs for proportions, we use the more robust methods of Newcombe et al [New98, NA00], as recommended by [Cum12], which provide good approximations even when N is small and P is close or equal to 0 or 1. This is described by the following formula1 : √ A = 2 × x + 1.962 B = 1.96 × 1.962 + 4 × x × (1 − P ) C = 2 × (N + 1.962 ) 95%CI = [(A − B )/C , (A + B )/C ] Where P is the estimated proportion, x is the observed frequency for the property of interest, and N is the total number of things – P = x /N . Hypothesis Testing The experiment’s dependent variables are given in table 2.1 (chapter 2); the corresponding hypothesis are formulated in table 2.2. For a dependent variable V , the null and alternative hypothesis are formulated as: Hi0 : V (VCL) = V (UML + OCL)
Hia : V (VCL) > V (UML + OCL)
Hypothesis are tested by estimating probabilities, known as p-values. Given data D, and some null hypothesis H0 , a p-value is an estimate for the conditional probability P (D | H0 ) [Coh94] – the likelihood of the given observations assuming that the null hypothesis is true —; hence, when we reject H0 , we are saying that it is unlikely because our observations deems P (D | H0 ) as unlikely – in this case, we accept the alternative hypothesis. We consider three levels of statistical significance to enable the rejection of the null hypothesis and the acceptance of a statistically significant difference; depending on whether the p-value is below α = 0.05 (*), α = 0.01 (**) or α = 0.001 (***). For continuous variables, we use the non-parametric Wilcoxon tests (we give the p-values estimated from the t-test in the text also); categorical variables are hypothesis tested with Z tests. Effect Sizes An ES measurement used in our analysis is the raw (or unstandardised) mean difference. Given the experiment’s within-subjects design, we need to consider that the variables are dependent and are often the result of repeated measures and distinguish this more complicated case with the simpler between-subjects design, where the variables are independent, and the calculation is, as a result, rather more straightforward [GK05, PJ13, FL12]. We work with paired differences; the formulas are as follows [GK05, PJ13, FL12, Cum12]2 : PD = VVCL − VUML
SEPD =
SD √ PD N
95%CI = MPD ± 1.96 × SEPD
Above, we have that MPD = MVCL −MUML ; SDPD is standard deviation of the paired differences. Raw mean differences provide an intuitive measurement of an effect, but they lack uniformity, making it difficult to compare effects when the scales differ. To provide a more uniform measurement, we use the ES Cohen’s d [Coh88], which is appropriate for continuous variables √ P×(1−P) traditional formula to calculate SEs for CIs of such proportions is SE = N 2 We make a slight adjustment to the formulas used by these authors; we use the coefficient with value 1.96 derived from the normal distribution; these authors use the t distribution and the value tN −1 (.975), corresponding to the 95% range. 1 The
4.2. RESULTS: A BIRD’S EYE VIEW
19
with an underlying analysis centred on means. To estimate this, we use the standard deviation average (or pooled standard deviation) as the standardiser (denominator) [Cum12]: √ 2 2 SDVCL +SDUML −MUML d = MVCLSD SD = av 2 av There are slightly different ways of calculating the Cohen’s d, which vary depending on the formula used for the denominator. The formula above, based on the standard deviation average, fits the paired design being followed [Cum12]. CIs for this ES are calculated using approaches based on non-central t distributions [CF01, Kel07]; in particular we use the R package MBESS [Kel07] for this effect. For categorical data, we use the ES measurement Cohen’s h [Coh88], based on the arcsine transformation, which is appropriate for differences between proportions. The formula for h and the SE to calculate CIs (from [Coh88]) is3 : h = 2 × arcsin
4.1.2
√
PVCL − 2 × arcsin
√
√
PUML
SE =
1 N
On Graphical representations
The results of this chapter are represented using various kinds of graphs. These are as follows: • Box plots (example in Fig. 4.1a) present the upper and lower quartiles of the data by the top and bottom of the rectangle, and the median by the horizontal line within the rectangle; the lines extending vertically from the boxes (whiskers) indicate variability outside the upper and lower quartiles. The symbol o represents outliers and * indicates the mean. These plots display the different samples in the abscissa (x-axis) and the units of the analysed data in the ordinate (y-axis) — Fig. 4.1a uses score rates in the ordinate. • Plot of point estimates and confidence intervals (example in Fig. 4.1b) portrays point estimates (e.g. means) as dots and 95% confidence intervals (CIs) as error bars. They display the different samples in the abscissa and the units of the analysed data in the ordinate (Fig. 4.1b uses score rates). • Forest plots (example in Fig. 4.7a) display point estimates and their corresponding 95% CIs. The point estimate is represented as a circles and the CI as error bars; the abcissa contains the scale corresponding to the presented result. • Histograms (example in Fig. 4.6), a variant of bar chart, uses the area of bars to represent the proportion of a phenomena accounted by the corresponding category. Histograms are typically used to depict frequency distributions.
4.2
Results: a Bird’s Eye View
The outcomes of hypothesis testing are summarised in table 4.1. The rows indicate the confirmed hypothesis: either the null hypothesis (no difference in the approaches) or the alternative hypothesis (a significant difference in favour of VCL enabled the rejection of the null hypothesis). The confirmed alternative hypothesis are highlighted in green. The µ columns present the means of the scores underlying the corresponding hypothesis. The p-value column reports on the statistical significance of the differences between the examined approaches. The ES column indicates the effect size, a quantitative measure of the strength of the presented results. 3 Cohen
[Coh88] defines the variance for our experimental setting as 1/N .
20
CHAPTER 4. EXPERIMENTAL RESULTS
Table 4.1 Results of Hypothesis testing. (Cell colours: confirmed alternative hypothesis in shaded (green in colour version), and null hypothesis in white. Statistical significance: * significant with α = .05, ** α = .01, *** α = .001, ns = not significant. Effect magnitude: ø is null, • is small, •• is medium, ••• is large, • + is small to medium, •• + is medium to large.) Hypothesis
VCLM /P
UMLM /P
VCL - UML
p-value
ES(d/h)
Model construction (objective) •
H10 : CoS
.64M [.6, .69]
.67M [.63, .71]
−.03[−.07, .01]
.89ns
−.13d [−.35, .08]
H20 : CoI
.1M [.07, .13]
.13M [.09, .18]
−.03[−.08, .01]
.84ns
−.18d [−.38, .05]
H3a : CoO
.16M [.13, .19]
.11M [.09, .13]
.05[.03, .08]
2 × 10⁻⁶ ∗∗∗
.45d [.26, .71]
H40 H50 H6a
: AcS
.38M [.33, .43]
.38M [.34, .43]
−.001[−.05, .05]
.59ns
−.01ød [−.22, .21]
: AcI
.2M [.16, .24]
.2M [.15, .24]
.01[−.04, .05]
.37ns
.03ød [−.19, .24]
: AcO
.11M [.08, .14]
.09M [.06, .11]
.02[−.003, .04]
.035∗
.17d [−.03, .4]
•
••
•
Perceived model construction (subjective) •+
H70 : PMS
.51P [.37, .65]
.35P [.22, .5]
.16[−.11, .41]
.064ns
.33h [.03, .63]
H8a H9a
: PMI
.53P [.39, .67]
.26P [.15, .4]
.28[.02, .5]
.0041∗∗
.58h [.28, .88]
: PMO
.6P [.46, .74]
.28P [.17, .43]
.33[.05, .55]
.0012∗∗
.67h [.37, .97]
••
••+
Comprehension and model usage (objective) 0 H10 : PC
.65M [.61, .69]
.64M [.6, .68]
.01[−.04, .05]
.33ns
.03ød [−.18, .24]
a H11 : DD
.27M [.24, .3]
.19M [.17, .21]
.08[.05, .1]
2 × 10⁻⁷ ∗∗∗
.67d [.41, .87]
.67M [.64, .71]
.61M [.58, .64]
.06[.02, .1]
.0012∗∗
.37d [.09, .52]
.00018∗∗∗
.81h [.51, 1.1]
a H12
: MC
••+ •+
Perceived comprehension and model usage (subjective) a H13 : PPC a H14 a H15
.47P [.33, .61]
.12P [.05, .24]
.35[.13, .53]
•••
: PDD
.56P [.41, .7]
.23P [.13, .38]
.33[.06, .54]
.001∗∗
: PMC
.44P [.3, .59]
.14P [.07, .27]
.3[.08, .49]
.001∗∗
••+ .68h [.38, .98] ••+ .69h [.39, .99]
Usefulness and ease of use (subjective) •
0 H16 :U
.75M [.71, .78]
.72M [.69, .76]
.02[−.03, .07]
.095ns
.18d [−.18, .42]
a H17 : EoU
.66M [.63, .69]
.6M [.56, .63]
.07[.03, .11]
.0026∗∗
.64d [.16, .79]
: DU
.28P [.17, .43]
.21P [.11, .35]
.07[−.14, .27]
.23ns
.16h [−.14, .46]
DEoU
.58P [.43, .72]
.23P [.13, .38]
.35[.08, .56]
.0005∗∗∗
.73h [.43, 1.03]
0 H18 a H19 :
••+ •
••+
Usability (subjective) ••
a H20 : UsR
.53P [.39, .67]
.33P [.2, .47]
.21[−.07, .45]
.025∗
.43h [.13, .73]
a H21 : UsN
.69P [.54, .81]
.14P [.07, .28]
.55[.29, .72]
2 × 10⁻⁷ ∗∗∗
1.19h [.88, 1.49]
.55[.29, .72]
× 10−7 ∗∗∗ 10−5 ∗∗∗ × 10−7 ∗∗∗
1.19h [.88, 1.49]
a H22 : UsMOs a H23 : UsLEC a H24 : UsLF 0 H25 : UsC 0 H26 : UsL a H27 : UsCS
.69P [.54, .81]
.14P [.07, .28]
2
••• •••
.51P [.37, .65]
.09P [.04, .22]
.42[.2, .59]
.7P [.55, .81]
.16P [.08, .3]
.53[.27, .72]
.37P [.24, .52]
.27P [.16, .42]
.1[−.14, .32]
.46P [.3, .64]
.32P [.18, .51]
.14[−.18, .43]
.14ns
.54P [.36, .7]
.25P [.13, .43]
.29[−.04, .55]
.014∗
••• .97h [.68, 1.27] ••• 1.15h [.85, 1.45] •+ .21h [−.1, .52] •+ .29h [−.08, .66] •• .6h [.22, .97]
.44P [.3, .59]
−.02[−.29, .24]
.59ns
−.05øh [−.35, .25]
3
.17ns
Preferred notation (subjective) 0 H28 : PNS a H29 : PNI a H30 : PNO a H31 : PN 0 H32 : FN a H33 : Appr
.42P [.28, .57]
•••
10−6 ∗∗∗
.99h [.69, 1.28]
.65P [.5, .78]
.19P [.1, .33]
.47[.2, .66]
6×
.58P [.43, .72]
.21P [.11, .35]
.37[.11, .58]
.00021∗∗∗
.78h [.49, 1.08]
.49P [.35, .63]
.28P [.17, .43]
.21[−.05, .44]
.023∗
.43h [.14, .73]
.33P [.2, .47]
.33P [.2, .47]
0[−.23, .23]
.5ns
0øh [−.3, .3]
.56P [.51, .61]
.31P [.27, .36]
.24[.15, .33]
4×
10−12 ∗∗∗
••+
••
••
.5h [.4, .6]
4.3. MODEL CONSTRUCTION
21
The controlled experiment presented here adopted a crossover design. This means that subjects had two attempts at executing the different tasks based on two different case studies: the university library case study (UL) and the flight booking case study (FB). Table 4.1 documents the results at each case study and the collective results of both case studies. The table results that do not give values for the individual case studies are based on the debriefing questionnaire. The presentation of the results is organised around: model construction, comprehension and model usage, usefulness and ease of use, usability and preferred notations.
4.3
Model Construction
The performance of subjects in performing model construction tasks is evaluated objectively based on two different criteria: • Completeness, which measures how much has been modelled; • and accuracy, which assesses the quality and meaning of the produced models. We conduct a subject investigation on how subjects perceived their model construction performances. We present the data for each evaluation criterium and model facet using the following graphical representations: one box plot and two plots of point estimates and CIs, one focussed on means and the other on mean differences (e.g. Fig. 4.1). These graphs present the results in total, for each case study – university library or flight booking –, and for each group or institution.
4.3.1
Completeness
The completeness results of the three modelling facets – state space, invariants and operations –, corresponding to hypothesis H1..3 of table 4.1, are summarised in table 4.2 and portrayed in Fig. 4.1. State Space Figures 4.1a, 4.1b and 4.1c portray the results of completeness of state space, summarised in table 4.4a. We can see that there are variations of performance across the different samples, but the differences remain nearly the same, highlighting a quasi-equality that confirms the null hypothesis: CoS (VCL) = CoS (UML + OCL). The mean of VCL’s performance rate is .64 (95% CI [.6, .69], sd = .22) and that of UML+OCL is slightly higher .67 (CI [.63, .71], sd=.19), with a mean of differences of −.03 (CI [−.07, .01]). Cohen’s d ES measurement of −.13 (CI [−.35, .08], •) indicates a small effect. Invariants The results portrayed in Figs. 4.1d, 4.1e and 4.1f highlight essentially similar performances, confirming the null hypothesis: CoI (VCL) = CoI (UML + OCL). It is interesting to observe that in the sample FCT/UNL UML+OCL obtains a higher result, which is not confirmed by the remaining samples. The mean of VCLs performance rate was .1 (CI[.07, .13], sd = .14) and that of UML+OCL was slightly higher .13 (CI[.09, .18], sd = .22) with a mean of differences of −.03 (CI[−.08, .01]). Cohen’s d ES measurement of −.18 (CI[−.38, .05], •) denotes a small effect.
CHAPTER 4. EXPERIMENTAL RESULTS 22
(1) (2) (3) (3) (4)
(1) (2) (3) (4) (5)
(1) (2) (3) (4) (5)
N VCL M .53[.43, .63] .75[.61, .88] .57[.46, .68] .69[.6, .78] .62[.55, .68]
16 10 9 7 42
N VCL M .05[.01, .08] .16[.02, .29] .1[.04, .15] .17[.05, .28] .1[.06, .15]
16 10 9 7 42
N VCL M .15[.1, .2] .26[.14, .39] .13[.05, .21] .2[.04, .36] .18[.13, .23]
16 11 9 7 43
S .23 .16 .23 .13 .2
N VCL M .54[.42, .66] .85[.81, .9] .66[.5, .81] .72[.56, .87] .67[.6, .74]
16 11 9 7 43
S .24 .08 .24 .21 .23
Flight Booking UML M S .58[.47, .68] .22 .79[.71, .87] .13 .64[.5, .79] .22 .76[.7, .83] .09 .68[.62, .74] .2
S .08 .16 .15 .16 .13
Flight Booking UML M S .07[.04, .1] .06 .15[.09, .21] .1 .06[.04, .09] .03 .09[.05, .12] .05 .09[.07, .11] .07
PD M −.04[−.12, .05] .06[−.01, .13] .01[−.16, .18] −.05[−.19, .09] −.003[−.06, .05]
N VCL M .53[.46, .61] .8[.73, .87] .61[.52, .71] .7[.62, .79] .64[.6, .69] 32 21 18 14 85
Total UML M .57[.5, .64] .79[.74, .85] .66[.58, .74] .74[.69, .8] .67[.63, .71]
PD M −.03[−.1, .04] .01[−.05, .07] −.04[−.16, .07] −.04[−.12, .04] −.03[−.07, .01]
S .07 .15 .09 .15 .11
S .09 .3 .23 .19 .2
S .2 .15 .25 .16 .19
PD M −.01[−.04, .02] −.1[−.23, .03] −.02[−.12, .09] −.01[−.11, .09] −.03[−.08, .01]
PD M .06[.04, .09] .06[0, .12] .05[.01, .09] .03[−.05, .1] .05[.03, .08]
S .14 .28 .22 .25 .23
S .2 .13 .17 .11 .19
S .05 .11 .05 .15 .1
Total UML M .05[.01, .1] .25[.13, .37] .12[.01, .22] .17[.04, .3] .13[.09, .18]
Total UML M .07[.05, .09] .16[.12, .21] .08[.05, .1] .15[.08, .23] .11[.09, .13]
S .08 .18 .12 .15 .14
S .22 .17 .21 .16 .22
S .09 .17 .11 .16 .14
N VCL M .05[.02, .07] .15[.07, .23] .1[.04, .15] .16[.08, .24] .1[.07, .13] 32 21 18 14 85
N VCL M .13[.1, .16] .22[.15, .29] .13[.08, .18] .18[.1, .27] .16[.13, .19] 32 22 18 14 86
S .11 .29 .25 .18 .21
S .18 .12 .26 .19 .19
S .04 .08 .07 .08 .07
PD M −.03[−.08, .03] −.13[−.3, .04] −.02[−.19, .14] −.03[−.16, .1] −.05[−.11, .01]
PD M .04[.02, .06] .03[−.02, .08] .06[.02, .11] .08[.02, .13] .05[.03, .07]
Flight Booking UML M S .08[−.01, .17] .18 .27[.1, .43] .28 .12[−.02, .27] .23 .18[−.02, .38] .27 .15[.08, .22] .24
(a) State Space (variable CoS ) N VCL M .05[.01, .09] .14[.04, .24] .1[.003, .2] .15[.03, .27] .1[.06, .14] 16 11 9 7 43
S .08 .12 .09 .1 .1
(b) Invariants (variable CoI ) N VCL M .11[.07, .15] .18[.11, .25] .13[.07, .19] .16[.09, .24] .14[.11, .17] 16 11 9 7 43
S .05 .32 .22 .21 .2
S .09 .19 .11 .18 .14
University Library UML PD M S M .03[−.01, .07] .08 .01[−.01, .04] .23[.05, .41] .29 −.07[−.27, .13] .11[−.04, .25] .23 −.01[−.15, .13] .16[−.02, .35] .25 .004[−.15, .16] .12[.05, .18] .21 −.01[−.07, .05]
University Library UML PD M S M .56[.46, .65] .19 −.03[−.14, .08] .8[.72, .88] .13 −.05[−.15, .05] .67[.6, .74] .11 −.1[−.25, .05] .72[.63, .81] .13 −.03[−.13, .06] .67[.61, .72] .18 −.05[−.11, .01]
S .2 .22 .17 .12 .2
S .08 .21 .08 .16 .14
University Library UML PD M S M .07[.04, .09] .05 .09[.04, .13] .17[.1, .25] .13 .09[−.02, .2] .09[.05, .13] .06 .04[−.03, .11] .22[.09, .36] .18 −.03[−.16, .11] .12[.09, .16] .12 .06[.02, .1]
S .1 .21 .13 .21 .16
(c) Operations (variable CoO)
Table 4.2: Experimental data on completeness. ((1) = FCUL; (2) = FCT/UNL; (3) = U. Luxembourg; (4) = U. York; (5) = Total)
4.3. MODEL CONSTRUCTION
23
VCL UML+OCL VCL UML+OCL
1
Mean ± CI
.6 .4
Mean PD ± CI
.8
.8 Score Rate
.1
.9
.7 .6 .5
.2
Total
CS UL
Total
CS FB
(a) Box plots of state space
CS UL
CS FB
FCT/UNL FCUL UL
●
●
−.1
Total
CS FB FCT/UNL UY CS UL FCUL UL Paired Difference, PD = VCL−UML
(b) Means and CIs of state space
(c) Paired differences and CIs of state space .1
VCL UML+OCL
.3 Mean ± CI
.8 .6 .4
Mean PD ± CI
.4
1
Score Rate
● ●
UY
VCL UML+OCL
.2
0
●
●
●
●
● ●
−.1
●
−.2
.1
.2
−.3 0
0 Total
CS UL
Total Total
CS FB
(d) Box plots of invariants
CS UL
CS FB
FCT/UNL FCUL UL
CS FB FCT/UNL UY CS UL FCUL UL Paired Difference, PD = VCL−UML
UY
(e) Means and CIs of invariants
(f) Paired differences and CIs of invariants
VCL UML+OCL
.2
.3
1
Mean ± CI
.6 .4
Mean PD ± CI
VCL UML+OCL
.8 Score Rate
●
● ●
−.2
.4
0
0
.2
.1
.2
Total
CS UL
CS FB
(g) Box plots of operations
●
●
● ●
●
● ●
0
−.1
0
0
.1
Total
CS UL
CS FB
FCT/UNL FCUL UL
(h) Means and CIs of operations
UY
Total
CS FB FCT/UNL UY CS UL FCUL UL Paired Difference, PD = VCL−UML
(i) Paired differences and CIs of operations
Figure 4.1: Model completeness for state space, invariants and operations. (CS UL = University Library case study (CS); CS FB = Flight Booking case study; FCUL, FCT/UNL, UL and UY are the different groups/institutions)
24
CHAPTER 4. EXPERIMENTAL RESULTS
Operations Figures 4.1g, 4.1h and 4.1i highlight a clear advantage in favour of VCL, which, despite variations, is consistent across the four samples. The mean of VCL’s performance rate is .16 (sd = .14, CI [.13, .19]) and that of UML + OCL is .11 (sd = .1, CI [.09, .13]) with a mean difference of .05 (CI [.03, .08]). This difference is significant – Wilcoxon test p-value is 10−6 < 0.001 (***) (t-test p-value = 10−5 ) – to confirm the alternative hypothesis: CoO(VCL) > CoO(UML + OCL). The ES measurement Cohen’s d of .45 (CI [.26, .71], ••) indicates a medium effect.
4.3.2
Accuracy
The accuracy results, corresponding to the hypothesis H4..6 of table 4.1, are summarised in table 4.3 and portrayed in Fig. 4.2; they are discussed in detail in the sequel. State Space Figures 4.2a, 4.2b and 4.2c highlights performances that are quasi-equal, which confirms the null-hypothesis: AcS (VCL) = AcS (UML + OCL). VCL’s mean performance rate lies at .38 (sd = .23, CI [.33, .43]) and that of UML at .38 (sd = .22, CI [.34, .43]) with a mean difference of 0 (CI [−.05, .05]). The effect size measurement Cohen’s d of −.01 (CI [−.22, .21], ø) signals a null effect and endorses the quasi-equality of the results. Invariants The same quasi-equality effect, portrayed in Figs. 4.2d, 4.2e and 4.2f, is confirmed by the nullhypothesis: AcI (VCL) = AcI (UML + OCL). VCL has a mean performance rate of .2 (sd = .18, CI [.16, .24]), the same as UML + OCL’s (sd = .21, CI [.15, .24]) with a minor difference of .01 (CI [−.04, .05]). Cohen’s d ES measurement of .03 (CI [−.19, .24], ø) stipulates a null effect. Operations Figures 4.2g, 4.2h and 4.2f highlight a difference in favour of VCL, which is statistically significant: AcO(VCL) > AcO(UML + OCL). VCL’s mean rate is .11 (sd = .13, CI [.08, .14]) and that of UML is .09 (sd = .11, CI [.06, .11]) with a mean difference of .02 (CI [0, .04]). The p-value of .035, obtained from Wilcoxon test (t-test p-value = .047), signals a statistically significant difference at the lowest level of significance (p < .05, *). Cohen’s d ES measurement of .17 (CI [−.03, .4], ••) signals a small effect.
4.3.3
Perceived Performance
The debriefing questionnaire (appendix E, section E.5) asked subjects whether they felt that any of the languages under scrutiny, VCL or UML+OCL, gave them any advantage in the model constructions tasks. The actual questions can be found in the section The modelling tasks in the questionnaire of section E.5. The results of this subjective assessment, corresponding to hypothesis H7..9 , are given Fig. 4.3, which contains a table of frequencies (Fig. 4.3a), a bar chart (Fig. 4.3b) and plot of proportions and their CIs (Fig. 4.3c). The results are as follows: • In state-space modelling, most subjects felt that they performed better using VCL (22 out 43= .51, CI [.39, .67]), followed by UML + OCL (15/43 = .35, CI [.15, .4]); 6 subjects felt that they performed equally using both approaches (no preference option). The difference of proportions between VCL and UML+OCL is .16 (CI [−.11, .41]). This was deemed
(1) (2) (3) (4) (5)
(1) (2) (3) (4) (5)
(1) (2) (3) (4) (5)
VCL M .09[.04, .14] .16[.06, .26] .06[0, .11] .2[.04, .36] .12[.08, .16]
VCL M .19[.09, .29] .34[.2, .49] .21[.06, .36] .17[.05, .28] .23[.16, .29]
VCL M .34[.24, .44] .6[.47, .73] .42[.26, .59] .69[.6, .78] .48[.4, .55]
University Library UML PD S M S M .09 .03[0, .07] .06 .06[.02, .1] .17 .15[.06, .24] .15 .01[−.11, .14] .09 .04[.01, .08] .06 .01[−.06, .08] .21 .22[.09, .36] .18 −.03[−.16, .11] .14 .1[.06, .14] .13 .02[−.02, .07] S .08 .21 .11 .18 .15
VCL M .2[.12, .28] .39[.26, .51] .3[.22, .38] .34[.22, .46] .29[.24, .35]
N
16 11 9 7 43
VCL M .09[.02, .16] .26[.19, .34] .16[.1, .23] .27[.18, .37] .18[.14, .23] S .14 .13 .1 .13 .15
Flight Booking UML PD N S M S M S .09 .04[.01, .08] .07 .03[0, .06] .06 32 .14 .13[.06, .21] .12 .02[−.03, .08] .09 22 .08 .06[.01, .1] .07 .01[−.03, .05] .06 18 .08 .1[.04, .16] .08 0[−.05, .05] .07 14 .11 .08[.05, .11] .09 .02[0, .04] .07 86
(c) Operations (variable AcO)
VCL M .07[.03, .12] .16[.07, .24] .06[.01, .12] .1[.04, .16] .1[.07, .13]
VCL M .08[.05, .11] .16[.1, .22] .06[.02, .1] .15[.06, .23] .11[.08, .14]
32 21 18 14 85
S .09 .15 .08 .16 .13
Total UML M .04[.02, .06] .14[.09, .2] .05[.02, .08] .16[.08, .24] .09[.06, .11]
PD S M S .07 .04[.02, .07] .07 .13 .02[−.05, .09] .16 .06 .01[−.03, .05] .09 .15 −.01[−.08, .06] .13 .11 .02[0, .04] .11
S .18 .22 .29 .21 .22
S .18 .25 .3 .13 .22
PD M .03[−.03, .09] −.04[−.13, .06] .04[−.1, .17] −.02[−.13, .08] .01[−.04, .05]
PD M .02[−.04, .08] −.04[−.15, .07] .02[−.11, .16] −.03[−.09, .04] 0[−.05, .05]
S .15 .23 .17 .24 .21
S .18 .18 .16 .24 .22
Total UML M .11[.06, .16] .34[.24, .44] .15[.07, .23] .24[.12, .37] .2[.15, .24]
Total UML M .25[.19, .31] .53[.45, .6] .34[.27, .41] .54[.42, .66] .38[.34, .43]
S .18 .19 .17 .15 .18
S .2 .24 .2 .23 .23
VCL M .14[.08, .2] .3[.22, .38] .19[.11, .27] .22[.14, .3] .2[.16, .24]
VCL M .27[.2, .34] .49[.39, .59] .36[.27, .46] .51[.39, .63] .38[.33, .43]
N
32 21 18 14 85
N
S .16 .18 .15 .22 .17
S .17 .28 .2 .14 .2
PD M 0[−.07, .08] −.05[−.15, .06] −.04[−.14, .06] −.05[−.21, .11] −.03[−.08, .02]
PD M 0[−.08, .08] −.11[−.27, .06] −.01[−.14, .13] −.02[−.13, .08] −.03[−.09, .03]
Flight Booking UML M S .09[.03, .16] .13 .31[.19, .43] .2 .2[.13, .28] .11 .32[.17, .48] .21 .21[.15, .27] .19
(b) Invariants (variable AcI )
16 11 9 7 43
N
S .16 .21 .12 .16 .18
Flight Booking UML M S .2[.13, .27] .15 .49[.38, .61] .19 .31[.2, .42] .16 .36[.23, .49] .17 .32[.26, .38] .2
(a) State Space (variable AcS )
16 11 9 7 43
N
S .19 .26 .38 .21 .26
S .2 .21 .38 .13 .24
University Library UML PD S M S M .21 .13[.04, .22] .18 .06[−.04, .15] .23 .37[.2, .53] .26 −.02[−.18, .14] .23 .1[−.04, .24] .21 .11[−.14, .36] .16 .16[−.02, .35] .25 0[−.15, .16] .21 .19[.12, .26] .23 .04[−.04, .12]
University Library UML PD S M S M .21 .3[.2, .4] .19 .04[−.06, .14] .22 .56[.47, .66] .16 .04[−.1, .17] .25 .37[.27, .47] .15 .05[−.19, .3] .12 .72[.63, .81] .13 −.03[−.13, .06] .25 .45[.38, .52] .23 .03[−.04, .1]
Table 4.3: Experimental data on accuracy. ((1) = FCUL; (2) = FCT/UNL; (3) = U. Luxembourg; (4) = U. York; (5) = Total)
16 11 9 7 43
N
16 10 9 7 42
N
16 10 9 7 42
N
4.3. MODEL CONSTRUCTION 25
26
CHAPTER 4. EXPERIMENTAL RESULTS
.7
VCL UML+OCL
.6 Mean ± CI
.6 .4
.4 .3 .2
.2
CS UL
Total
CS FB
(a) Box plots of state space
.5
.6 .4
●
0
●
●
● ●
●
●
−.1
Total
CS FB FCT/UNL UY CS UL FCUL UL Paired Difference, PD = VCL−UML
UY
(c) Paired differences and CIs of state space
VCL UML+OCL .2
.4 Mean ± CI
.8
FCT/UNL FCUL UL
(b) Means and CIs of state space
VCL UML+OCL
1
CS UL
CS FB
Mean PD ± CI
Total
.1
−.2
.1
0
Score Rate
.5
.3 .2
.1 ●
0
●
●
● ●
●
●
−.1
.1
.2
−.2
0
0 Total
CS UL
Total
CS FB
(d) Box plots of invariants 1
.3
Mean ± CI
.6 .4
CS FB
FCT/UNL FCUL UL
.1
VCL UML+OCL
.2
CS UL
CS FB
(g) Box plots of operations
● ●
●
●
● ●
0
●
.1 −.1
0 Total
CS FB FCT/UNL UY CS UL FCUL UL Paired Difference, PD = VCL−UML
(f) Paired differences and CIs of invariants
.2 0
Total
UY
(e) Means and CIs of invariants
VCL UML+OCL
.8
CS UL
Mean PD ± CI
Score Rate
.8
Score Rate
.2
Mean PD ± CI
1
VCL UML+OCL
Total
CS UL
CS FB
FCT/UNL FCUL UL
(h) Means and CIs of operations
UY
Total
CS FB FCT/UNL UY CS UL FCUL UL Paired Difference, PD = VCL−UML
(i) Paired differences and CIs of operations
Figure 4.2: Model accuracy for state space, invariants and operations. (CS UL = University Library case study (CS); CS FB = Flight Booking CS; FCUL, FCT/UNL, UL and UY are the different groups/institutions)
4.3. MODEL CONSTRUCTION
27
VCL UML NP
22 15 6
23 11 9
26 12 5
Total
43
43
43
(a) Frequencies
Proportion Difference ± CI
Os
.8 Proportion ± CI
Is
Number of people
SS
VCL UML+OCL
VCL UML NP
25
VCL UML+OCL
20 15 10
.7 .6 .5 .4 .3 .2
5
.1
0 SS
Is
Os
.6 .5 .4 .3 .2 .1
0
-.1 -.2 SS
SS
Is
Os
Is
Os
VCL-UML
(b) Frequency distribu- (c) Proportions and CIs (d) Proportion tion ence and CIs
Differ-
Figure 4.3: Notation that users felt gave them a better performance in the model construction tasks as obtained from responses to debriefing questionnaire. (SS = State Space; Is = Invariants; Os = Operations; NP = No preferance)
not significant to reject the null hypothesis (Z-test p-value = .064); Cohen’s h effect-size measure yields .33 (CI [.28, .38], • +), signals a small to medium effect size. • In modelling the invariants, most subjects felt that they performed better using VCL (23/43 = .53, CI [.39, .67]), followed by UML + OCL (11/43 = .26, CI[.15, .4]) and the no preference option (9). The difference of the proportions between VCL and UML+OCL is .28 (CI [.02, .5]). The Z-test analysis rejected the null hypothesis (p-value = .004 < .01, **), hence we accept the alternative hypothesis: PMI (VCL) > PMI (UML+OCL). Cohen’s h effect-size measure of .58 (CI [.53, .63], ••) indicates a medium effect. • In operation contracts, most subjects felt that they performed better using VCL (26/43 = .6, CI[.46, .74]), which outperformed UML + OCL (12/43 = .28, CI[.17, .43]) and the no preference option (5). The difference between proportions is: .33 (CI [.05, .55]), which is sufficiently significant to reject the null hypothesis (Z-test p-value = .001 < .01, **), hence: PMO(VCL) > PMO(UML + OCL). Cohen’s h effect-size measure of .67 (CI[.62, .71], •• +) signals a medium to large effect.
4.3.4
Discussion
UML+OCL’s slight advantage in completeness of state space (variable CoS ) could be due to the fact that UML class diagrams are widely known and many participants already knew this notation. However, although subjects modelled more with UML class diagrams, this advantage was cancelled out when it came to accuracy, which measures quality. There is no difference in accuracy between the two approaches. This greater familiarity with the UML for modelling the state space can also be observed in the amplitude of the box plots for both completeness and accuracy. UML box plots are more compact; the higher amplitude of the VCL box plots seems to suggest that some users excelled with it, but others were perhaps perplexed with the new notation and had lower performances. Completeness of modelling invariants is slightly higher for UML+OCL. This can be attributed to the fact that it is easier to write complex properties textually than graphically, as was observed in our published results on tool evaluation [AG15]. It is interesting that both completeness and
28
CHAPTER 4. EXPERIMENTAL RESULTS CoS CoI
PMS
CoO AcS
PMI
AcI
PMO
AcO −0.5
−0.25
0 0.25 Effect Size (d)
0.5
0.75
(a) Actual modelling performances (effect size d)
0
0.25
0.5 Effect Size (h)
0.75
(b) Perceived modelling performances (effect size h)
Figure 4.4: Forest Plots of effect sizes and their CIs derived from actual and perceived performances in the model construction tasks.
accuracy were higher for the FCT/UNL group, which could be due to prior exposure of many members of this group to OCL. Like in state space, there is a slight advantage to UML+OCL with completeness, which is cancelled out when it comes to accuracy. VCL was superior in the modelling of operations. This is, however, more clear with completeness – subjects could model more behaviour with VCL –, which is nearly cancelled out when it comes to accuracy. The difference between the two approaches, as measured by the p-values, goes from highly significant for completeness to just marginally significant for accuracy; the effect size, as measured by the Cohen’s d index, goes from medium to low significance. A striking aspect of the results presented above is the significant gap that exists between subjects’ actual and perceived performances. This effect happens for both completeness (sect. 4.3.1) and accuracy (sect. 4.3.2), which are both at odds with what subjects perceived (sect 4.3.3). Overall, most subjects felt that they performed better using VCL at modelling the state space, invariants and contracts, and better using UML + OCL in the definition of operation signatures. However, their actual performances do not reflect this perceived image. In terms of state spaces and invariants, the performances using UML + OCL outperformed VCL, albeit with no significant difference in neither completeness nor accuracy. In the modelling of operations, it was using VCL that subjects performed better, but only with a high significant difference on completeness – much less significant for accuracy. It is in the modelling of invariants that the gap between actual and perceived performances is particularly evident. In the questionnaire, subjects perceived their performances with VCL as being significantly better than UML+OCL; however, it wasn’t so when it came to the actual performances. This reflects, on the one hand, the emotional nature of more subjective opinions – as it will become evident later, subjects favoured VCL –, but on the other hand it suggests the inadequacy of the experiment at measuring the performances of subjects at modelling invariants. Modelling of invariants was done in the same task as modelling the state space with 1/2 hour to do both. The results of both completeness and accuracy highlighted a striking difference in the performances of modelling the state space when compared to the modelling of invariants and operations. This reflects the difference in complexity of the tasks: state space modelling is easier than the more advanced modelling of invariants and operations. Students and learners of software modelling, first master state space modelling and only then they move to the more advanced topics of modelling invariants and operations. The outliers in the modelling of state space in Fig. 4.1a signal subjects that were not prepared for the complex modelling tasks of the experiment, whereas
1
4.4. COMPREHENSION AND MODEL USAGE
29
the outliers in the modelling of invariants and operations (Figs. 4.1d and 4.1g) signal talented and competent individuals performing well above the average. As commented above, the results for completeness tend to be higher than those of accuracy. It is much easier to get points for completeness (how much has been modelled) than for accuracy, which has to do with the meaning of what has been modelled.
4.4
Comprehension and Model Usage
The comprehension and model usage tasks comprised problem comprehension, defect detection and model comprehension. We have measured both actual and perceived performance of subjects in these tasks.
4.4.1
Task Performance
The results of the actual performance of subjects in comprehension and model usage tasks are summarised in table 4.4 and portrayed in Fig. 4.5; they correspond to hypothesis H10..12 . The results are as follows: • Figures 4.5a, 4.5b and 4.5c, which depict the problem comprehension results, show that the performances of subjects using both approaches is very similar. There is an advantage in favour of VCL for the university library case study, which is cancelled out in the flight booking case study. The results confirm the null hypothesis PC (VCL) = PC (UML+OCL) (Wilcoxon test p-value = .33; t-test p-value =.38). The mean of VCL’s performances was .65 (sd= .19, CI [.61, .69]) and that of UML+OCL was .64 (sd= .2, CI [.6, .68]) with a mean difference of about .01 (CI[−.04, .05]). This quasi-equality is endorsed by Cohen’s d ES measurement of .03 (CI[−.18, .24], ø), which signals a null effect. • The results of defect detection, depicted in Figs. 4.5d, 4.5e and 4.5f, highlight a significant difference in favour of VCL – conspicuous in the university library case study. The difference is highly significant, confirming the alternative hypothesis DD(VCL) > DD(UML) (Wilcoxon test p-value = 2 × 10⁻⁷ < 0.001 (***); t-test p-value =3 × 10⁻⁸ ). The means are as follows: VCL was .27 (sd= .13, CI [.24, .3]), UML+OCL was .19 (sd = .1, CI [.17, .21]) and the difference was .08 (CI [.05, .1]). Cohen’s d ES measurement of .67 (CI [.41, .87], •• +) signals a medium to large effect. • In model comprehension, whose results are portrayed in Figs. 4.5g, 4.5h and 4.5h, there is a significant difference in favour of VCL (Wilcoxon test p-value =0.001 < 0.01 (**); t-test p-value =.003). VCL had a mean score rate of .67 (sd = .16, CI[.64, .71]) and UML+OCL of .61 (sd = .16, CI[.58, .64]) with a mean difference of .06 (CI [.02, .1]). Cohen’s d ES measurement of .37 (CI [.09, .52], • +) signals a small to medium effect.
4.4.2
Perceived Performance
The debriefing questionnaire enquired subjects on their performances in the model usage and comprehension tasks. The results of this subjective assessment of user performances, corresponding to hypothesis H13..15 , are described in Fig. 4.6, which contains a table of frequencies (Fig. 4.6a), a bar chart depicting the frequency distributions (Fig. 4.6), a plot of proportions and CIs (Fig. 4.6c) and a plot of differences between proportions with CIs (Fig. 4.6d). The results are as follows:
CHAPTER 4. EXPERIMENTAL RESULTS 30
(1) (2) (3) (4) (5)
(1) (2) (3) (4) (5)
(1) (2) (3) (4) (5)
N VCL M .71[.6, .81] .7[.58, .83] .77[.67, .87] .7[.6, .81] .72[.66, .78]
16 11 9 7 43
N VCL M .29[.21, .36] .38[.28, .47] .27[.19, .36] .3[.23, .37] .31[.27, .35]
16 11 9 7 43
N VCL M .67[.6, .75] .36[.28, .45] .45[.29, .62] .64[.52, .77] .64[.58, .7]
16 11 9 7 43
PD M .15[.08, .21] .13[.04, .22] .15[.08, .21] .12[.04, .2] .14[.1, .17]
N VCL M .49[.41, .57] .55[.47, .62] .64[.55, .74] .73[.64, .82] .58[.53, .63]
16 11 9 7 43
S .17 .13 .15 .12 .17
S .12 .11 .08 .03 .1
N VCL M .69[.64, .75] .22[.16, .28] .69[.64, .75] .73[.61, .86] .7[.67, .74] 16 11 9 7 43
Flight Booking UML M S .55[.46, .64] .18 .63[.46, .79] .28 .61[.45, .76] .23 .67[.54, .8] .18 .6[.54, .67] .22
PD M −.06[−.13, .01] −.08[−.25, .08] .04[−.06, .13] .07[−.11, .24] −.03[−.09, .04]
S .14 .28 .15 .24 .2
S .22 .19 .16 .13 .19
Total UML M .61[.55, .68] .66[.57, .76] .59[.49, .69] .73[.65, .82] .64[.6, .68]
S .18 .23 .22 .17 .2
PD M −.02[−.08, .05] −.04[−.13, .06] .11[.04, .19] −.01[−.12, .09] .01[−.04, .05]
S .19 .22 .16 .21 .2
PD S M S .18 .06[−.004, .12] .18 .17 .11[.04, .19] .17 .15 .01[−.11, .12] .25 .14 .05[−.06, .15] .19 .16 .06[.02, .1] .2
PD S M S .1 .1[.06, .14] .12 .12 .04[−.02, .11] .16 .09 .1[.05, .14] .1 .06 .07[.01, .13] .11 .1 .08[.05, .1] .12
Total UML M .62[.56, .69] .61[.54, .68] .57[.5, .63] .64[.57, .71] .61[.58, .64]
Total UML M .17[.13, .2] .26[.22, .31] .15[.11, .19] .18[.15, .21] .19[.17, .21]
S .13 .13 .22 .17 .16
S .14 .15 .11 .08 .13
N VCL M .6[.52, .68] .62[.55, .7] .71[.63, .78] .72[.65, .79] .65[.61, .69] 32 22 18 14 86
Flight Booking UML PD N M S M S .67[.6, .74] .14 .02[−.06, .1] .17 32 .27[.19, .35] .14 −.04[−.1, .02] .1 22 .56[.45, .66] .17 .14[.05, .23] .14 18 .62[.53, .71] .12 .11[−.05, .27] .21 14 .62[.58, .67] .15 .08[.03, .13] .16 86
VCL M .68[.64, .73] .72[.67, .77] .57[.47, .68] .69[.6, .78] .67[.64, .71]
Flight Booking UML PD N VCL M S M S M .19[.15, .24] .1 .05[.01, .09] .08 32 .26[.21, .31] .28[.19, .37] .14 −.05[−.11, .02] .1 22 .3[.24, .37] .17[.11, .23] .09 .05[.01, .1] .07 18 .25[.2, .3] .18[.14, .23] .06 .03[−.04, .09] .09 14 .25[.21, .3] .21[.17, .24] .11 .02[−.01, .05] .09 86 .27[.24, .3]
S .11 .1 .08 .17 .12
(b) Defect detection (variable DD)
N VCL M .24[.18, .3] .23[.17, .3] .22[.17, .27] .21[.18, .23] .23[.2, .26]
S .2 .15 .27 .16 .23
16 11 9 7 43
(a) Problem comprehension (variable PC )
S .22 .14 .13 .15 .19
S .12 .15 .1 .11 .12
University Library UML PD M S M .68[.6, .75] .16 .03[−.08, .14] .69[.59, .8] .18 .01[−.07, .09] .58[.44, .71] .21 .19[.11, .28] .8[.7, .9] .13 −.1[−.21, .01] .68[.63, .73] .18 .04[−.02, .1]
S .21 .22 .15 .14 .19
University Library UML M S .14[.1, .19] .09 .25[.2, .29] .08 .13[.07, .18] .08 .18[.13, .23] .06 .17[.14, .2] .09
S .16 .16 .13 .09 .14
University Library UML PD M S M .58[.48, .67] .2 .1[.001, .19] .24[.19, .29] .09 .12[.04, .21] .58[.49, .66] .13 −.13[−.31, .05] .66[.55, .78] .16 −.02[−.14, .1] .6[.55, .65] .17 .04[−.03, .11]
S .15 .15 .26 .17 .2
(c) Model comprehension (variable MC )
Table 4.4: Experimental data on comprehension and model usage. ((1) = FCUL; (2) = FCT/UNL; (3) = U. Luxembourg; (4) = U. York; (5) = Total)
4.4. COMPREHENSION AND MODEL USAGE
●
VCL UML+OCL
VCL UML+OCL
.2
.8 Mean ± CI
.8 .6 .4 .2
● ●
●
.7
●
●
● ●
.6
● ●
Mean PD ± CI
.9
1
Score Rate
31
●
● ●
●
● ●
−.1 −.2
.4 CS UL
●
0
.5
0 Total
●
.1
Total
CS FB
CS UL
CS FB
FCT/UNL FCUL UL
Total
CS FB FCT/UNL UY CS UL FCUL UL Paired Difference, PD = VCL−UML
UY
(a) Box plots of problem (b) Means and CIs for problem compre- (c) Paired differences and CIs of probcomprehension hension lem comprehension ●
VCL UML+OCL
.2
.4 VCL UML+OCL ●
● ● ●
.4
●
.3
●
●
●
● ●
●
●
.2
Mean PD ± CI
.6
● ● ●
●
Mean ± CI
Score Rate
.8
.2 0 Total
CS UL
Total
CS FB
●
● ●
● ● ●
0
−.1
.1
●
.1
CS UL
CS FB
FCT/UNL FCUL UL
Total
CS FB FCT/UNL UY CS UL FCUL UL Paired Difference, PD = VCL−UML
UY
(d) Box plots of defect de- (e) Means and CIs for defect detection (f) Paired differences and CIs of detection fect detection ●
VCL UML+OCL
Mean ± CI
Score Rate
.2 0
● ●
●
●
● ●
.6
●
.5 ● ●
●
Total
CS UL
●
.1
● ●
●
●
●
0
●
−.1 −.2
.4 CS FB
Mean PD ± CI
.7
.8
.4
.2
.8
1
.6
VCL UML+OCL
Total
CS UL
CS FB
FCT/UNL FCUL UL
UY
Total
CS FB FCT/UNL UY CS UL FCUL UL Paired Difference, PD = VCL−UML
(g) Box plots of model (h) Means and CIs for model compre- (i) Paired differences and CIs of comprehension hension model comprehension
Figure 4.5: Model usage and comprehension tasks (CS UL = University Library case study (CS); CS FB = Flight Booking CS; FCUL, FCT/UNL, UL and UY are the different groups/institutions).
CHAPTER 4. EXPERIMENTAL RESULTS
●
.7
19 6 18
Total
43
43
43
(a) Frequencies
20
Proportion ± CI
24 10 9
15
24 5 18
.5
● ●
.3 .2 .1 0 PC
PC
DD
●
.4
10
VCL UML Equal
.6
5
DD MC
0
PC
Number of people
25
VCL UML+OCL Equal
VCL UML+OCL
DD
MC
(b) Histogram of frequency (c) Proportions distributions CIs
MC
Proportion Difference ± CI
32
.6 .5 .4 ●
.3
●
●
.2 .1 0 PC
DD
MC
VCL−UML
and (d) Proportion differences and CIs
Figure 4.6: Notation that users felt gave them a better performance in the model usage and comprehension tasks: problem comprehension, defect detection and model comprehension according to responses to debriefing questionnaire (PC = Problem Comprehension; DD = Defect Detection; MC = Model Comprehension) • In problem comprehension (PC), a proportion of .47 (CI[.33, .61]) of subjects felt that they performed better using VCL, against .12 (CI [.05, .24]) of UML+OCL, yielding a difference .35 (CI [.13, .53]). As can be inferred from Figs. 4.6c, this difference is notably significant (Z-test p-value=.0002 < .001, ***), hence, we reject the null hypothesis and accept the alternative hypothesis: PPC (VCL) > PPC (UML + OCL). Cohen’s h effect-size measure of .8 (CI [.51, 1.1], •••) signals a large effect. • In defect detection (DD), a considerable proportion of subjects, .56 (CI [.41, .7]) felt they performed better using VCL against UML+OCL’s .23 (CI [.13, .38]) – the difference is .33 (CI [.06, .54]). Figures 4.6c and 4.6d highlight a significant difference in favour of VCL confirmed by our Z-test p-value of .001 < .01 (**), which rejects the null and accepts the alternative hypothesis: PDD(VCL) > PDD(UML + OCL). Cohen’s h effect-size measure of .68 (CI [.38, .98], •• +) signals a medium to large effect. • In model comprehension (MC), a considerable proportion of subjects, .44 (CI [.3, .59]), felt they performed better using VCL against UML+OCL’s .14 (CI [.07, .27]) – the difference is .3 (CI [.08, .49]). Figures 4.6c and 4.6d highlight a significant difference in favour of VCL confirmed by our Z-test p-value of .001 < .01 (**), entailing the acceptance of the alternative hypothesis: PMC (VCL) > PMC (UML + OCL). Cohen’s h effect-size measure of .69 (CI [.39, .99], •• +) indicates a medium to large effect.
4.4.3
Summary
Figure 4.7 presents a forest plot describing actual and perceived performances in the model usage and comprehension tasks. It depicts the standardised difference in means effect size (Cohen’s d) for each relevant hypothesis together with the CIs. There is an interesting contrast between actual and perceived performances. We can see that for defect detection and model comprehension, actual and perceived are not that far apart; the corresponding null hypothesis were
4.5. USEFULNESS AND EASE OF USE
33
PC
PPC
DD
PDD
MC
PMC
−0.25
0
0.25 0.5 Effect Size (d)
0.75
1
(a) Actual performances (effect size d)
0
0.25
0.5 0.75 Effect Size (h)
1
1.25
(b) Perceived performances (effect size h)
Figure 4.7: Forest Plots of effect sizes of actual and perceived performances in the model usage and comprehension tasks. Table 4.5 Experimental data on Usefulness and ease of use. ((1) = FCUL; (2) = FCT/UNL; (3) = U. Luxembourg; (4) = U. York; (5) = Total) N (1) (2) (3) (4) (5)
16 11 9 7 43
VCL M .78[.72, .85] .72[.65, .79] .73[.65, .81] .72[.64, .81] .75[.71, .78]
S .13 .12 .12 .11 .12
Usefulness (U) UML M S .71[.66, .76] .1 .72[.66, .78] .1 .75[.66, .84] .14 .72[.62, .82] .14 .72[.69, .76] .11
PD M .07[−.01, .16] −.01[−.12, .1] −.02[−.13, .09] 0[−.14, .14] .02[−.03, .07]
N S .17 .18 .16 .19 .17
16 11 9 7 43
VCL M .68[.62, .73] .66[.61, .72] .66[.59, .73] .65[.58, .72] .66[.63, .69]
Ease of Use (EoU) UML PD S M S M .11 .6[.55, .65] .1 .08[.02, .14] .09 .59[.51, .66] .12 .08[−.01, .16] .11 .62[.54, .71] .13 .03[−.08, .15] .09 .57[.48, .67] .13 .08[−.06, .22] .1 .6[.56, .63] .11 .07[.03, .11]
S .12 .14 .17 .19 .14
rejected. There is, however, a significant discrepancy in the the way subjects perceive problem comprehension and their actual performance in the problem comprehension questionnaires. Subject’s VCL perceived performance in problem comprehension was significantly better than the UML + OCL one with a very strong effect size, however there is a close to null difference in the actual performance. This suggests a possible weakness of the experiment, which way not have been effective in evaluating problem comprehension to the point that it could not identify a difference in terms of performance, although the subjects felt that there was a difference; however, it can also be that the perceived difference is illusional.
4.5
Usefulness and Ease of Use
The experiment’s debriefing questionnaire contained sections devoted to perceived usefulness (PU) and perceived ease of use (PEoU) [Dav89]. Perceived usefulness is the degree to which a person believes that using a particular system would enhance his or her job performance. Perceived ease of use, on the other hand, is the degree to which a person believes that using a particular system or technology would be free of effort. Both perceived usefulness and perceived ease of use are seen as important determinants for user acceptance of a technology [Dav89]. To evaluate PU and PEoU, the questionnaire contained indirect and direct questions. The indirect parts of the questionnaire are based on questions formulated on a Likert scale from 1 (strongly agree) to 5 (strongly disagree), corresponding to variables U and EoU and the hypothesis H16,17 . The results, summarised in table 4.5, are portrayed in the plots of Fig. 4.8, which contains a box-plot describing the distributions of U and EoU (Fig. 4.8a), a plot of mean and CIs of U (Fig. 4.8b), a plot of mean differences and their CIs for U (Fig. 4.8c), a plot of mean and CIs of EoU (Fig. 4.8d), a plot of mean differences and their CIs for EoU (Fig. 4.8e) and a
34
CHAPTER 4. EXPERIMENTAL RESULTS
VCL UML+OCL ●
.2
.8 .7 .6 .5
.8
● ● ● ●
.7
●
Mean PD ± CI
.9
●
.4 .3
.6 EoU
(a) Box plots (U and EoU) ●
.8 .7 ●
●
●
●
●
.6 .5
● ●
−.1
Total
FCT/UNL U. York FCUL U. Luxembourg Paired Difference, PD = VCL−UML
(c) Paired mean differences and CIs (U)
.2 .1 ●
●
●
● ●
0
U EoU
−.1 FCT/UNL U. York FCUL U. Luxembourg
(d) Means and CIs (EoU)
●
.3
.4 Total
● ●
0
FCT/UNL U. York FCUL U. Luxembourg
(b) Means and CIs (U)
VCL UML+OCL
.1
−.2 Total
Mean PD ± CI
U
Mean +/− CI
VCL UML+OCL
.9
●
Mean +/− CI
Questionnaire Score Rate
1
●
Total
FCT/UNL U. York FCUL U. Luxembourg Paired Difference, PD = VCL−UML
−0.25
(e) Means and CIs of paired differences and CIs (EoU)
0
0.25 0.5 Effect Size (d)
0.75
1
(f) Forest plot of effect sizes (d)
Figure 4.8: Distributions of usefulness and ease of use (indirect questions) forest-plot of effect sizes (Fig. 4.8f). The results are as follows: • The usefulness results give a slight advantage to VCL, which is not statistically significant (Wilcoxon test p-value =.095; t-test p-value=.22) to confirm the null hypothesis. The mean of VCL’s usefulness survey is .75 (sd=.12, CI [.71, .78]) and that of UML+OCL is .72 (sd=.11, CI [.69, .76]) with a mean of differences of .02 (sd=.17, CI [−0.03, 0.07]). Cohen’s d effect size measurement of .18 (sd=.14, CI [−.18, .42], •) signals a small effect. • In ease of use, on the other hand, there was a significant advantage in favour of VCL — the Wilcoxon test p-value is .003 < .01 (**) (t-test p-value = .002). The mean of VCL’s PEoU survey is .66 (sd=.1, CI [.63, .69]), and that of UML+OCL is .6 (sd=.11, CI [.56, .63]) with a mean of differences of .07 (sd=.14, CI [.03, .11]). Cohen’s d effect size measurement of .64 (CI [.16, .79], •• +) signals a medium to large effect. The results to the direct questions on PU and PEoU, corresponding to hypothesis H18,19 , are
35 ●
• VCL 12 UML 9 Equal 22 Total 43
DEoU *** •• + 25 10 8
VCL UML Equal
20 15 10 5
VCL UML+OCL
.8 Proportion +/− CI
DU
Number of people
25
.7 .6
●
.5 .4 .3
●
.2
43
DU
DEoU
(a) Frequencies, signifi- (b) Bar chart of frequency discances and effects tributions
.6 .5 .4
●
.3 .2 .1
●
0 −.1 −.2 DU
.1
0
Proportion Difference ± CI
4.6. USABILITY
DU
DEoU
(c) Means and CIs
DEoU
VCL−UML
(d) Proportions and CIs of paired differences
DU DEoU −0.25
0
0.25 0.5 0.75 Effect Size (h)
1
1.25
(e) Forest plot of effect sizes (d)
Figure 4.9: Distributions of usefulness and ease of use in the direct questions (variables: DU and DEoU)
described in Fig. 4.9, which contains a table of frequencies (table 4.11a), a bar chart depicting the frequency distributions (Fig. 4.9b), a plot of proportions and CIs (Fig. 4.9c), a plot of proportion differences and CIs (Fig. 4.9d) and a forest plot of effect sizes (Fig. 4.9e). The results are as follows:
• The usefulness frequencies show that most users selected the neutral option of the questionnaire (22 out of 43), followed by VCL (12) and UML + OCL (9). This gives a proportion of .28 (CI [.17, .43]) to VCL and a proportion of .21 (CI[.11, .35]) to UML + OCL with a difference in proportions of .07 (CI [−.14, .27]). This difference is not statistically significant (Z-test p-value=.23) and confirms the null hypothesis. Cohen’s h effect-size measure of .16 (CI [−.14, .46], •) signals a small effect.
• The ease of use results show that most users selected VCL as the language that is more easy to use (25 out of 43), followed by UML + OCL (10) and the neutral option (8). This gives a proportion of .58 (CI [.43, .72]) to VCL against the .23 (CI [.13, .38]) of UML+OCL, yielding a difference of .35 (CI [.08, .56]). This difference was deemed statistically significant; the Z-test p-value of .0005 (< .001, ***) confirms the alternative hypothesis: DEoU (VCL) > DEoU (UML + OCL). Cohen’s h effect-size measure of .73 (CI [.43, 1.03], •• +) signals a medium to large effect.
36
CHAPTER 4. EXPERIMENTAL RESULTS N *** •••
MOs LEC LaF C *** *** *** •• ••• ••• • + +
L
C/S * ••
VCL 23 UML 14 NP 6
29 6 7
24 9 10
22 4 17
30 7 6
15 11 15
13 9 6
15 7 6
Total 43
42
43
43
43
41
28
28
• +
30 Number of people
R * ••
VCL UML+OCL No preference
25 20 15 10 5 0 R
Proportion +/− CI
.8 .7 .6 .5
●
● ●
●
●
● ●
.4
●
.3
.6
●
.5
0
.4
●
.3 .2
● ● ●
.1
●
0
R R
N
MOs
LaF
LEC C Usability Criteria
(c) Proportions and CIs
L
C/S
L
CS
● ●
−.2
.1
C
(b) Frequency distributions
−.1
.2
LaF
.7
VCL UML+OCL Mean PD ± CI
●
MOs LEC
Usability Criteria
(a) Frequencies, significances and effects .9
N
N
MOs
LaF LEC C VCL−UML
L
C/S
R N MOs LEC LaF C L CS −0.25 0
0.25 0.5 0.75 1 Effect Size (h)
1.25 1.5
(d) Proportion differences and (e) Forest plot of effect sizes (h) CIs
Figure 4.10: Usability results derived from responses to the debriefing questionnaire. (NP= No preference. Criteria: R = Reading; N = Navigation; MOs = Maps and overviews; LEC = live error checking; LaF = Look and feel; C=Cohesion; L=Learnability; CS=Comfort Satisfaction. Significance: * corresponds to α = .05, ** to α = .01, and *** to α = .001. Effect magnitude of h: ø is null (| h |≤ .05), • is small (.0.5 union ( Set { c } )
(a) OCL operation Member :: borrows() context Member : : r e c a l l ( c : Copy ) post : r e c a l l s = r e c a l l s @ p r e ()−> union ( Set { c } )
(b) OCL operation Member :: becall () context Member : : c o l l e c t ( c : Copy ) pre : r e c a l l s −>i n c l u d e s (m) post : r e c a l l s = r e c a l l s @ p r e ( ) − Set { c } and b o r r o w i n g s = b o r r o w i n g s @ p r e ()−> union ( Set { c } )
(c) OCL operation Member :: collect() context Book : : noBorrowableBookCopies ( ) : Boolean post : r e s u l t = c o p i e s −>f o r A l l ( s t a t u s CopyStatus : : onLoan or c a t e g o r y = LoanCategory : : r e s t r i c t e d )
(d) OCL operation Book :: noBorrowableBookCopies()
Figure C.18: OCL operations of classes Member and Book in the model with seeded errors of the university library case study
C.3. DEFECT DETECTION MODELS
75
context Copy : : borr ows ( now : U n l i m i t e d N a t u r a l , m : Member ) pre : s t a t u s = CopyStatus : : s h e l v e d or s t a t u s = CopyStatus : : t o C o l l e c t post : s t a t u s = CopyStatus : : onLoan and b o r r o w e r = m and dueDate = calcDueDate ( now )
(a) OCL operation Copy :: Borrow () context Copy : : r e t u r n (m : Member ) pre : b o r r o w e r = m and dueDate>= now and ( s t a t u s=CopyStatus : : onLoan or s t a t u s=CopyStatus : : r e c a l l e d ) post : r e n e w a l s = 0 and dueDate−>isEmpty ( ) and borrower−>isEmpty ( ) and s t a t u s @ p r e ( ) = onLoan implies s t a t u s = CopyStatus : : s h e l v e d and s t a t u s @ p r e ( ) = r e c a l l e d implies s t a t u s = CopyStatus : : t o C o l l e c t
(b) OCL operation Copy :: Return() context Copy : : r e c a l l (m : Member , now : U n l i m i t e d N a t u r a l ) pre : s t a t u s = CopyStatus : : onLoan post : s t a t u s = CopyStatus : : onLoan and calcDueDate ( now ) < dueDate@pre ( ) implies dueDate = calcDueDate ( now ) and r e c a l l e r = m
(c) OCL operation Copy :: Recall () context Copy : : c o l l e c t (m : Member , now : U n l i m i t e d N a t u r a l ) pre : s t a t u s = CopyStatus : : t o C o l l e c t and r e c a l l e r = m post : s t a t u s = CopyStatus : : r e c a l l e d and r e c a l l e r −>isEmpty ( ) and b o r r o w e r = m and dueDate = calcDueDate ( now )
(d) OCL operation Copy :: Collect() context Copy : : calcDueDate ( now : UnlimitedNatural ) : UnlimitedNatural pre : c a t e g o r y LoanCategory : : r e s t r i c t e d post : c a t e g o r y @ p r e ( ) = LoanCategory : : oneWeek implies r e s u l t = now + 30 and c a t e g o r y @ p r e ( ) = LoanCategory : : oneMonth implies r e s u l t = now + 7
(e) OCL operation Copy :: calcDueDate() context Copy : : getBook ( ) : Book post : r e s u l t = book
(f) OCL operation Copy :: getBook ()
Figure C.19: OCL operations of class Copy in the model with seeded errors of the university library case study
76
APPENDIX C. UNIVERSITY LIBRARY MATERIALS
C.4
Solution Models
The solution models were given to subjects as part of the model comprehension task. They are as follows: • The VCL solution model consists of the state space model presented in Figs. C.3 to C.4b and the behavioural model is presented in Fig. C.20 to C.24. • The UML+OCL class diagram is given in Fig. C.25, the invariants are given in Fig. C.9, and the operations (behaviour) are given in Figs. C.26 to C.28.
(a) Behavioural diagram
(c) Contract of operation Return (b) Contract of operation Borrow
(d) AD of operation GetMemberGivenLibraryNo
(e) AD of operation GetCopyGivenCopyNo
Figure C.20: Global Behavioural VCL model
C.4. SOLUTION MODELS
77
(a) Contract of operation AddToBorrows
(b) Contract of operation BorrowsDelGivenCopy
(c) Contract of operation Renew (d) Contract of operation Recall
Figure C.21: Global Behavioural VCL model
78
APPENDIX C. UNIVERSITY LIBRARY MATERIALS
(a) Contract of operation AddToHasRecalled
(b) Contract of operation Collect (c) AD of operation GetBorrowedCopies
(d) Contract of operation HasRecallsDelGivenCopy
Figure C.22: Global Behavioural VCL model
C.4. SOLUTION MODELS
(a) AD of operation GetActiveRecalls
79
(b) AD of operation GetWaitingCollection
(c) AD of operation GetBooksOfAuthor (d) AD of operation GetRecalledBooks
Figure C.23: Global Behavioural VCL model
80
APPENDIX C. UNIVERSITY LIBRARY MATERIALS
(a) CD of Copy.Borrow
(b) CD of Copy.Return
(c) CD of Copy.ReturnToShelved
(d) CD of Copy.ReturnRecalled
(f) CD of Copy.Collect
(e) CD of Copy.Renew
(g) AD of Copy.Recall
Figure C.24: Local behaviour of set Copy in the VCL model
C.4. SOLUTION MODELS
Figure C.25: Class diagram of the university library case study
81
82
APPENDIX C. UNIVERSITY LIBRARY MATERIALS
context L i b r a r y : : findMember ( mLibNo : L i b r a r y ) : Member post : r e s u l t = members@pre−>any ( l i b N o = mLibNo )
(a) OCL operation Library :: findMember () context L i b r a r y : : findCopy ( cNo : CopyNo ) : Copy post : r e s u l t = c o p i e s @ p r e −>any ( copyNo=cNo )
(b) OCL operation Library :: findCopy() context L i b r a r y : : hasMember ( mLibNo : L i b r a r y ) : Boolean post : r e s u l t = members−>e x i s t s (m | m. l i b N o = mLibNo )
(c) OCL operation Library :: hasMember () context L i b r a r y : : hasCopy ( cNo : CopyNo ) : Boolean post : r e s u l t = c o p i e s −>e x i s t s ( c | c . copyNo = cNo )
(d) OCL operation Library :: hasCopy() context L i b r a r y : : bo rr ows ( cNo : CopyNo , mLibNo : LibraryNo , now : U n l i m i t e d N a t u r a l ) pre : hasCopy ( cNo ) and hasMember ( mLibNo ) post : l e t c : Copy = findCopy ( cNo ) , m : Member = findMember ( mLibNo ) i n c . bo rrows ( now , m) and m. b or row s ( c )
(e) OCL operation Library :: borrows() context L i b r a r y : : r e t u r n ( cNo : CopyNo , mLibNo : LibraryNo , now : U n l i m i t e d N a t u r a l ) pre : hasCopy ( cNo ) and hasMember ( mLibNo ) post : l e t c : Copy = findCopy ( cNo ) , m : Member = findMember ( mLibNo ) i n c . r e t u r n ( now ) and m. r e t u r n ( c )
(f) OCL operation Library :: return() context L i b r a r y : : renew ( cNo : CopyNo , mLibNo : LibraryNo , now : U n l i m i t e d N a t u r a l ) pre : hasCopy ( cNo ) and hasMember ( mLibNo ) post : l e t c : Copy = findCopy ( cNo ) , m : Member = findMember ( mLibNo ) i n c . renew (m, now )
(g) OCL operation Library :: renew () context L i b r a r y : : r e c a l l ( cNo : CopyNo , mLibNo : LibraryNo , now : U n l i m i t e d N a t u r a l ) pre : hasCopy ( cNo ) and hasMember ( mLibNo ) and c . getBook()−> noBorrowableBookCopies ( ) post : l e t c : Copy = findCopy ( cNo ) , m : Member = findMember ( mLibNo ) i n c . r e c a l l (m, now ) and m. c o l l e c t ( c )
(h) OCL operation Library :: recall () context L i b r a r y : : c o l l e c t ( cNo : CopyNo , mLibNo : LibraryNo , now : U n l i m i t e d N a t u r a l ) pre : hasCopy ( cNo ) and hasMember ( mLibNo ) post : l e t c : Copy = findCopy ( cNo ) , m : Member = findMember ( mLibNo ) i n c . c o l l e c t (m, now ) and m. c o l l e c t ( c )
(i) OCL operation Library :: collect()
Figure C.26: OCL operations of class Library in solution model of university library
C.4. SOLUTION MODELS
83
context Member : : bo rr ows ( c : Copy ) post : b o r r o w i n g s = b o r r o w i n g s @ p r e ()−> union ( Set { c } )
(a) OCL operation Member :: borrows() context Member : : r e t u r n ( c : Copy ) pre : b o r r o w i n g s −>i n c l u d e s ( c ) post : b o r r o w i n g s = b o r r o w i n g s @ p r e () − Set { c }
(b) OCL operation Member :: return() context Member : : r e c a l l ( c : Copy ) post : r e c a l l s = r e c a l l s @ p r e ()−> union ( Set { c } )
(c) OCL operation Member :: recall () context Member : : c o l l e c t ( c : Copy ) pre : r e c a l l s −>i n c l u d e s ( c ) post : r e c a l l s = r e c a l l s @ p r e ( ) − Set { c } and b o r r o w i n g s = b o r r o w i n g s @ p r e ()−> union ( Set { c } )
(d) OCL operation Member :: collect() context Book : : noBorrowableBookCopies ( ) : Boolean post : r e s u l t = c o p i e s −>f o r A l l ( s t a t u s CopyStatus : : s h e l v e d or c a t e g o r y = LoanCategory : : r e s t r i c t e d )
(e) OCL operation Book :: noBorrowableBookCopies()
Figure C.27: OCL operations of classes Member and Book in the model with seeded errors of the university library case study
84
APPENDIX C. UNIVERSITY LIBRARY MATERIALS
context Copy : : bo rr ows ( now : U n l i m i t e d N a t u r a l , m : Member ) pre : s t a t u s = CopyStatus : : s h e l v e d post : s t a t u s = CopyStatus : : onLoan and b o r r o w e r = m and dueDate = calcDueDate ( now )
(a) OCL operation Copy :: borrow () context Copy : : r e t u r n ( now : U n l i m i t e d N a t u r a l ) pre : not borrower−>notEmpty ( ) and dueDate>= now and ( s t a t u s=CopyStatus : : onLoan or s t a t u s=CopyStatus : : r e c a l l e d ) post : r e n e w a l s = 0 and dueDate−>isEmpty ( ) and borrower−>isEmpty ( ) and s t a t u s @ p r e = onLoan implies s t a t u s = CopyStatus : : s h e l v e d and s t a t u s @ p r e = r e c a l l e d implies s t a t u s = CopyStatus : : t o C o l l e c t
(b) OCL operation Copy :: return() context Copy : : renew ( now : U n l i m i t e d N a t u r a l , m : Member ) pre : s t a t u s = CopyStatus : : onLoan and b o r r o w e r = m and dueDate isEmpty ( ) and b o r r o w e r = m and dueDate = calcDueDate ( now )
(e) OCL operation Copy :: collect() context Copy : : getBook ( ) : Book post : r e s u l t = book
(f) OCL operation Copy :: getBook ()
Figure C.28: OCL operations of class Copy in the solution model of university library
Appendix D
Flight Booking Materials This chapter presents all the experiment materials that are related with the flight booking case study.
D.1
Starting Models
For the task on model construction of the state space, subjects were given partial models with some structures and invariants. The supplied models are as follows: • The starting VCL model comprises an incomplete SD (Fig. D.1) and ADs of four invariants (Fig. D.2). • The starting UML+OCL models comprises an incomplete class diagram and two OCL invariants (Fig. D.3)
Figure D.1: The starting VCL model of flight booking
85
86
APPENDIX D. FLIGHT BOOKING MATERIALS
(a) AD of invariant OriginDiffersFromDestination
(b) AD of invariant AirportCodesDistinct
(c) AD of invariant FlightNosDistinct
(d) AD of invariant AirlineCodesDistinct
Figure D.2: VCL ADs of invariants of flight booking
D.2. INTERMEDIATE MODELS
87
(a) Class diagram context Time inv : s e l f . hour i n c l u d e s A l l ( Set { F a r e C l a s s : : s u p e r S a v e r , F a r e C l a s s : : s a v e r } ) implies c l a s s = S e a t C l a s s : : economy and f a r e s −>i n c l u d e s ( F a r e C l a s s : : r e l a x P l u s ) implies c l a s s = S e a t C l a s s : : b u s i n e s s or c l a s s = S e a t C l a s s : : f i r s t
(b) OCL invariant Seat :: FaresAndClassRestrictions context Date inv : day >= 1 and day =1 and month i n c l u d e s ( F a r e C l a s s : : r e l a x P l u s ) implies c l a s s S e a t C l a s s : : b u s i n e s s and c l a s s S e a t C l a s s : : f i r s t
(d) OCL invariant Seat :: FaresAndClassRestrictions context Date inv : day >= 1 and day < 31 and month >=1 and month s e l e c t ( f | f . f l i g h t S p e c . f l i g h t N o = f l N o and f . d a t e = d)−>any ( t r u e )
(a) OCL operation FlightBooking :: getFlightFrNoAndDate() context F l i g h t B o o k i n g r e s e r v e ( now : Date , f l N o : FlightNo , f l D a t e : Date , c l a s s : SeatClass , f l F a r e : FareClass , f a r e : UnlimitedNatural ) pre : now . i s B e f o r e ( f l D a t e ) post : l e t f = getFlightFrNoAndDate ( f l No , f l D a t e ) , s = f . g e t F r e e S e a t ( c l a s s , f l F a r e ) i n R e s e r v a t i o n : : c r e a t e ( now , f l F a r e , f a r e , s )
(b) OCL operation FlightBooking :: reserve() context F l i g h t B o o k i n g h a s R e s e r v a t i o n ( rNo : R e s e r v a t i o n N o ) : Boolean post : r e s e r v a t i o n s −>e x i s t s ( r | r . r e s e r v a t i o n N o = rNo )
(c) OCL operation FlightBooking :: hasReservation() context F l i g h t B o o k i n g f i n d R e s e r v a t i o n ( rNo : R e s e r v a t i o n N o ) : R e s e r v a t i o n pre : h a s R e s e r v a t i o n ( rNo ) post : r e s u l t = r e s e r v a t i o n s −>any ( r e s e r v a t i o n N o = rNo )
(d) OCL operation FlightBooking :: findReservation() context F l i g h t B o o k i n g a i r l i n e C o n f i r m B o o k i n g ( rNo : R e s e r v a t i o n N o ) pre : h a s R e s e r v a t i o n ( rNo ) post : l e t r = f i n d R e s e r v a t i o n ( rNo ) i n r . confirmPayment ( )
(e) OCL operation FlightBooking :: airlineConfirmBooking() context F l i g h t B o o k i n g a i r l i n e C o n f i r m P a y m e n t ( rNo : R e s e r v a t i o n N o ) pre : h a s R e s e r v a t i o n ( rNo ) post : l e t r = f i n d R e s e r v a t i o n i n r . confirmPayment ( )
(f) OCL operation FlightBooking :: airlineConfirmPayment() context F l i g h t B o o k i n g c a n c e l R e s e r v a t i o n ( rNo : R e s e r v a t i o n N o ) pre : h a s R e s e r v a t i o n ( rNo ) post : l e t r = f i n d R e s e r v a t i o n ( rNo ) i n r . c a n c e l ( ) and r e s e r v a t i o n s −>e x c l u d e s ( r )
(g) OCL operation FlightBooking :: cancelReservation() context F l i g h t B o o k i n g c h a n g e R e s e r v a t i o n D a t e ( rNo : ReservationNo , now : Date , f l D a t e : Date , f a r e : U n l i m i t e d N a t u r a l ) pre : h a s R e s e r v a t i o n ( rNo ) and now . i s B e f o r e ( f l D a t e ) post : l e t r = f i n d R e s e r v a t i o n ( rNo ) , f = getFlightFrNoAndDate ( r . g e t F l i g h t N o ( ) , f l D a t e ) , s = f . getFreeSeat ( r . getClassSeat () , r . getFareClass ( ) ) in r . changeReservation ( fare , s )
(h) OCL operation FlightBooking :: changeReservationDate()
Figure D.21: OCL operations of flight booking in model with seeded errors
104
APPENDIX D. FLIGHT BOOKING MATERIALS
context F l i g h t g e t F r e e S e a t ( f l C l : S e a t C l a s s , f l F a r e : F a r e C l a s s ) : S e a t post : r e s u l t = s e l f . s e a t s −>s e l e c t ( s | s . c l a s s = f l C l and s . f a r e s −>i n c l u d e s ( f l F a r e ))−>any ( t r u e )
(a) OCL operation Flight :: getFreeSeat() context R e s e r v a t i o n c r e a t e ( now : Date , f l F a r e : F a r e C l a s s , f a r e : UnlimtedNatural , s : S e a t ) : R e s e r v a t i o n post : s e l f . r e s e r v a t i o n N o = R e s e r v a t i o n N o . a l l I n s t a n c e s −>any ( t r u e ) and s e l f . f a r e C l a s s = f l F a r e and s e l f . r e s e r v a t i o n D a t e = now and s e l f . c u r r e n c y = c u r r e n c y and s e l f . f a r e = f a r e and s e a t = s and s t a t u s = R e s e r v a t i o n S t a t u s : : h o l d and r e s u l t = s e l f
(b) OCL operation Reservation :: create() context R e s e r v a t i o n c o n f i r m B o o k i n g ( ) pre : s e l f . s t a t u s = R e s e r v a t i o n S t a t u s : : h o l d post : s e l f . s t a t u s = R e s e r v a t i o n S t a t u s : : p e n d i n g
(c) OCL operation Reservation :: confirmBooking() context R e s e r v a t i o n confirmPayment ( ) pre : s e l f . s t a t u s = R e s e r v a t i o n S t a t u s : : p e n d i n g post : s e l f . s t a t u s = R e s e r v a t i o n S t a t u s : : c o n f i r m e d
(d) OCL operation Reservation :: confirmPayment() context R e s e r v a t i o n c h a n g e R e s e r v a t i o n ( ) pre : ( f a r e C l a s s = F a r e C l a s s : : f l e x or f a r e C l a s s or f a r e C l a s s = F a r e C l a s s : : r e l a x P l u s ) and s t a t u s c o n f i r m e d post : s e l f . f a r e f a r e and s e a t −>isEmpty ( )
= FareClass : : relax
(e) OCL operation Reservation :: changeReservation() context R e s e r v a t i o n g e t F l i g h t N o ( ) : F l i g h t N o post : r e s u l t = s e l f . s e a t . f l i g h t . f l i g h t S p e c . f l i g h t N o
(f) OCL operation Reservation :: getFlightNo() context R e s e r v a t i o n g e t F a r e C l a s s ( ) : F a r e C l a s s post : r e s u l t = s e a t . f a r e s −>any ( t r u e )
(g) OCL operation Reservation :: getFareClass() context R e s e r v a t i o n g e t S e a t C l a s s ( ) : S e a t C l a s s post : r e s u l t = s e l f . s e a t . c l a s s
(h) OCL operation Reservation :: getSeatClass()
Figure D.22: OCL operations of flight booking in model with seeded errors
D.4. SOLUTION MODELS
D.4
105
Solution Models
The solution models were given to subjects as part of the model comprehension task. They are as follows: • The VCL solution model consists of the state space model presented in Figs. D.4, D.2 and D.5, and the behavioural model of Figs. D.23 to D.30 • The UML+OCL solution model is presented in Figs. D.31 to D.34.
Figure D.23: VCL BD of flight booking
106
APPENDIX D. FLIGHT BOOKING MATERIALS
(a) CD of operation Reserve
(c) AD of operation GetFlightFrNoAndDate
(b) CD of operation AirlineConfirmBooking
(d) AD of operation GetReservationFromNo
Figure D.24: VCL CDs and ADs of the behavioural model of flight booking
D.4. SOLUTION MODELS
107
(a) AD of operation GetFreeSeatForFlightClassAndFare (b) CD of operation AirlineConfirmPayment
(c) CD of operation AddReservationForSeat
(d) CD of operation CancelReservation
Figure D.25: VCL CDs and ADs of the behavioural model of flight booking
108
APPENDIX D. FLIGHT BOOKING MATERIALS
(a) CD of operation DelHasReservationGivenReservation
(b) CD of operation ChangeReservationDate
(c) CD of operation ChangeHasReservationForSeat
Figure D.26: VCL CDs and ADs of the behavioural model of flight booking
D.4. SOLUTION MODELS
109
(b) AD of operation (a) CD of operation ChangeReservationFlightAndDate FlightOfClass
GetFreeSeatsFor-
Figure D.27: VCL CDs and ADs of the behavioural model of flight booking
(a) CD of operation Seat.Book
(b) CD of operation Seat.UnBook
Figure D.28: VCL CDs and ADs of the behavioural model of flight booking
110
APPENDIX D. FLIGHT BOOKING MATERIALS
(a) CD of operation Reservation.New
(b) CD of operation tion.AirlineConfirmBooking
Reserva-
(c) CD of operation tion.AirlineConfirmPayment
Reserva-
(d) CD of operation Reservation.Cancel
Figure D.29: VCL CDs and ADs of the behavioural model of flight booking
D.4. SOLUTION MODELS
(a) CD of operation Reservation.ChangeReservationDate
(b) CD of operation Reservation.ChangeReservationFlightAndDate
Figure D.30: VCL CDs and ADs of the behavioural model of flight booking
111
112
APPENDIX D. FLIGHT BOOKING MATERIALS
Figure D.31: UML Class diagram of flight booking
D.4. SOLUTION MODELS
113
context F l i g h t B o o k i n g getFlightFrNoAndDate ( f l N o : FlightNo , d : Date ) : F l i g h t post : r e s u l t = s e l f . f l i g h t s −>s e l e c t ( f | f . f l i g h t S p e c . f l i g h t N o = f l N o and f . d a t e = d)−>any ( t r u e )
(a) OCL operation FlightBooking :: getFlightFrNoAndDate() context F l i g h t B o o k i n g r e s e r v e ( pname : String , now : Date , f l N o : FlightNo , f l D t : Date , c l : S e a t C l a s s , f c l : F a r e C l a s s , f : U n l i m i t e d N a t u r a l , p : U n l i m i t e d N a t u r a l , c : Currency ) pre : now . i s B e f o r e ( f l D t ) post : l e t f = getFlightFrNoAndDate ( f l N o , f l D t ) , s = f . getFreeSeat ( cl , f c l ) , r = R e s e r v a t i o n : : c r e a t e ( pname , now , f c l , f , c , p , s ) in s . book ( f c l , c l , r ) and s e l f . r e s e r v a t i o n s = s e l f . r e s e r v a t i o n s @ p r e −>union ( Set { r } )
(b) OCL operation FlightBooking :: reserve() context F l i g h t B o o k i n g h a s R e s e r v a t i o n ( rNo : R e s e r v a t i o n N o ) : Boolean post : r e s u l t = r e s e r v a t i o n s −>e x i s t s ( r | r . r e s e r v a t i o n N o = rNo )
(c) OCL operation FlightBooking :: hasReservation() context F l i g h t B o o k i n g f i n d R e s e r v a t i o n ( rNo : R e s e r v a t i o n N o ) : R e s e r v a t i o n pre : h a s R e s e r v a t i o n ( rNo ) post : r e s u l t = r e s e r v a t i o n s −>any ( r e s e r v a t i o n N o = rNo )
(d) OCL operation FlightBooking :: findReservation() context F l i g h t B o o k i n g a i r l i n e C o n f i r m B o o k i n g ( rNo : R e s e r v a t i o n N o ) pre : h a s R e s e r v a t i o n ( rNo ) post : l e t r = f i n d R e s e r v a t i o n ( rNo ) in r . confirmBooking ( )
(e) OCL operation FlightBooking :: airlineConfirmBooking() context F l i g h t B o o k i n g a i r l i n e C o n f i r m P a y m e n t ( rNo : R e s e r v a t i o n N o ) pre : h a s R e s e r v a t i o n ( rNo ) post : l e t r = f i n d R e s e r v a t i o n ( rNo ) i n r . confirmPayment ( )
(f) OCL operation FlightBooking :: airlineConfirmPayment() context F l i g h t B o o k i n g c a n c e l R e s e r v a t i o n ( rNo : R e s e r v a t i o n N o ) pre : h a s R e s e r v a t i o n ( rNo ) post : l e t r = f i n d R e s e r v a t i o n ( rNo ) in r . cancel ()
(g) OCL operation FlightBooking :: cancelReservation() context F l i g h t B o o k i n g c h a n g e R e s e r v a t i o n D a t e ( rNo : ReservationNo , now : Date , f l D a t e : Date , f a r e : U n l i m i t e d N a t u r a l ) pre : h a s R e s e r v a t i o n ( rNo ) and now . i s B e f o r e ( f l D a t e ) post : l e t r = f i n d R e s e r v a t i o n ( rNo ) , f = getFlightFrNoAndDate ( r . g e t F l i g h t N o ( ) , f l D a t e ) , s = f . getFreeSeat ( r . getClassSeat () , r . getFareClass ( ) ) in r . changeReservationDate ( fare , s )
(h) OCL operation FlightBooking :: changeReservationDate()
Figure D.32: OCL operations of flight booking
114
APPENDIX D. FLIGHT BOOKING MATERIALS
context F l i g h t B o o k i n g c h a n g e R e s e r v a t i o n F l i g h t A n d D a t e ( rNo : ReservationNo , now : Date , f l D a t e : Date , f a r e : U n l i m i t e d N a t u r a l ) pre : h a s R e s e r v a t i o n ( rNo ) and now . i s B e f o r e ( f l D a t e ) post : l e t r = f i n d R e s e r v a t i o n ( rNo ) , f = getFlightFrNoAndDate ( r . g e t F l i g h t N o ( ) , f l D a t e ) , s = f . getFreeSeat ( r . getSeatClass () , r . getFareClass ( ) ) in r . changeReservationFlightAndDate ( fare , s )
(a) OCL operation FlightBooking :: changeReservationFlightAndDate() context F l i g h t B o o k i n g g e t F r e e S e a t s F o r F l i g h t O f C l a s s ( f l N o : FlightNo , d : Date , c l : S e a t C l a s s ) : S e a t post : l e t f = getFlightFrNoAndDate ( fl No , d ) i n r e s u l t = f . s e a t s −>s e l e c t ( s | s . s t a t u s = S e a t S t a t u s : : f r e e and s . c l a s s = c l )
(b) OCL operation FlightBooking :: getFreeSeatsForFlightOfClass() context F l i g h t B o o k i n g g e t F r e e S e a t ( c l : S e a t C l a s s , f c l : F a r e C l a s s ) : Set S e a t post : r e s u l t = s e l f . s e a t s −>s e l e c t ( s | s . c l a s s = c l and s . f a r e s −>i n c l u d e s ( f c l ) and s . s t a t u s = S e a t S t a t u s : : f r e e )−>any ( t r u e )
(c) OCL operation Flight :: getFreeSeat() context S e a t book ( f c l : F a r e C l a s s , c l : S e a t C l a s s , r : R e s e r v a t i o n ) pre : s t a t u s = S e a t S t a t u s : : f r e e and c l a s s = c l and f a r e s −>i n c l u d e s ( f c l ) post : s t a t u s = S e a t S t a t u s : : booked and r e s e r v a t i o n = r
(d) OCL operation Seat :: book () context S e a t unbook ( f c l : F a r e C l a s s , c l : S e a t C l a s s , r : R e s e r v a t i o n ) pre : s t a t u s = S e a t S t a t u s : : booked post : s t a t u s=S e a t S t a t u s : : f r e e and r e s e r v a t i o n −>isEmpty ( )
(e) OCL operation Seat :: unbook ()
Figure D.33: OCL operations of flight booking
D.4. SOLUTION MODELS
115
context R e s e r v a t i o n c r e a t e (nm : String , now : Date , f c l : F a r e C l a s s , f : UnlimtedNatural , c : Currency , p : UnlimtedNatural , s : S e a t ) : R e s e r v a t i o n post : s e l f . r e s e r v a t i o n N o = R e s e r v a t i o n N o . a l l I n s t a n c e s −>any ( t r u e ) and s e l f . p a s s e n g e r = nm and s e l f . f a r e C l a s s = f c l and s e l f . r e s e r v a t i o n D a t e = now and s e l f . c u r r e n c y = c and s e l f . f a r e = f and s e l f . p e n a l t y = p and s e a t = s and s t a t u s = R e s e r v a t i o n S t a t u s : : p e n di n g and r e s u l t = s e l f
(a) OCL operation Reservation :: create() context R e s e r v a t i o n c o n f i r m B o o k i n g ( ) pre : s e l f . s t a t u s = R e s e r v a t i o n S t a t u s : : p e n d i n g post : s e l f . s t a t u s = R e s e r v a t i o n S t a t u s : : h o l d
(b) OCL operation Reservation :: confirmBooking() context R e s e r v a t i o n confirmPayment ( ) pre : s e l f . s t a t u s = R e s e r v a t i o n S t a t u s : : h o l d post : s e l f . s t a t u s = R e s e r v a t i o n S t a t u s : : c o n f i r m e d
(c) OCL operation Reservation :: confirmPayment() context R e s e r v a t i o n c a n c e l ( ) pre : s e l f . s t a t u s R e s e r v a t i o n S t a t u s : : v o i d post : s e a t . unbook ( ) and s t a t u s = R e s e r v a t i o n S t a t u s : : v o i d
(d) OCL operation Reservation :: cancel () context R e s e r v a t i o n c h a n g e R e s e r v a t i o n D a t e ( f a r e : U n l i m i t e d N a t u r a l , s : S e a t ) pre : ( f a r e C l a s s = F a r e C l a s s : : f l e x or f a r e C l a s s = F a r e C l a s s : : r e l a x or f a r e C l a s s = F a r e C l a s s : : r e l a x P l u s ) and s t a t u s = R e s e r v a t i o n S t a t u s : : c o n f i r m e d post : s e l f . f a r e = f a r e and s e a t @ p r e . unbook ( ) and s e a t = s
(e) OCL operation Reservation :: changeReservationDate() context R e s e r v a t i o n c h a n g e R e s e r v a t i o n F l i g h t A n d D a t e ( f a r e : U n l i m i t e d N a t u r a l , s : S e a t ) pre : s t a t u s R e s e r v a t i o n S t a t u s : : f l e x post : c h a n g e R e s e r v a t i o n D a t e ( f a r e , s )
(f) OCL operation Reservation :: changeReservationFlightAndDate() context R e s e r v a t i o n g e t F l i g h t N o ( ) : F l i g h t N o post : r e s u l t = s e l f . s e a t . f l i g h t . f l i g h t S p e c . f l i g h t N o
(g) OCL operation Reservation :: getFlightNo() context R e s e r v a t i o n g e t F a r e C l a s s ( ) : F a r e C l a s s post : r e s u l t = f a r e C l a s s
(h) OCL operation Reservation :: getFareClass() context R e s e r v a t i o n g e t S e a t C l a s s ( ) : S e a t C l a s s post : r e s u l t = s e l f . s e a t . c l a s s
(i) OCL operation Reservation :: getSeatClass()
Figure D.34: OCL operations of flight booking
116
APPENDIX D. FLIGHT BOOKING MATERIALS
Appendix E
Questionnaires This appendix presents the questionnaires that have been designed to support the experiment presented here. They are as follows: • The problem comprehension questionnaires (section E.2) try to evaluate how well the subjects comprehended the system (or problem) that they modelled. • The model comprehension questionnaires (section E.4) try to evaluate how well the subjects comprehended the given solution models of the experiment case studies. • The debriefing questionnaire (section E.5) gathers the impressions of subjects concerning the languages under study following their experiment experience.
E.1
Ability Assessment
117
118
APPENDIX E. QUESTIONNAIRES
Edit this form
Participant Questionnaire for the VCL vs UML+OCL Experiment This is the questionnaire for the participants of a software design modelling experiment. This experiment will compare the Visual Contract Language (VCL) against UML and OCL. Please complete this form. It will enable us to categorise you as user, which will help us assessing the amount of training that you need and to obtain accurate results from our study. The contents of this form are absolutely conIdential. They are to be used for scientiIc purposes only. Information identifying the respondent will not be disclosed under any circumstances. Thank you for your cooperation! *Required
Your Name: *
Your Email: *
What is your gender? * Male Female
What is your occupation? * Bachelor's student Master's student PhD Student Researcher Software Developer Other:
What is the highest level of formal education that you have completed? * High-school Bachelor
E.1. ABILITY ASSESSMENT
Master Doctorate
Have you completed or are in the process of completing a formal degree in Computer Science? * Yes No
If you have completed a formal degree in computer science, what degree levels have you completed? Bachelor's Master's PhD
Please provide further comments on your computer science knowledge and education. If you are currently undertaking a computer science degree, please state the year of your studies.
How many assessed computer programming courses did you complete so far? * None 1 2 3+
How much computer programming experience do you have in producing "real-world" software that actually has to be used in some context? * None