An Empirical Study of Fault Localization for End-User Programmers Joseph R. Ruthruff
∗
Margaret Burnett
Gregg Rothermel
∗
Department of Computer Science and Engineering University of Nebraska-Lincoln Lincoln, Nebraska 68588-0115
School of Electrical Engineering and Computer Science Oregon State University Corvallis, Oregon 97331-3202
Department of Computer Science and Engineering University of Nebraska-Lincoln Lincoln, Nebraska 68588-0115
[email protected]
[email protected]
[email protected]
ABSTRACT
mers. Today, however, end users write far more software than professional programmers: it is estimated that, in 2005 in the United States alone, 55 million end users, compared to only 2.75 million professional programmers [8], will be creating software such as multimedia simulations, dynamic web pages, e-mail filtering rules, and spreadsheets. Do these programmers have adequate support? Evidence suggests that they do not. Boehm and Basili observe that 40–50% of the software created by end users contains non-trivial faults [9]. These faults can be serious, in some cases costing millions of dollars [14, 20, 24]. A problem for the software engineering community, then, is to provide end users with better support for their software development activities. For example, end users, like professional programmers, need strategies for improving the dependability of their software, such as testing and anomaly detection methodologies to help them detect failures, and fault localization techniques to help them find the causes of failures. The latter is our focus in this paper. Software engineering researchers have invested considerable effort into bringing fault localization techniques to professional programmers (e.g., [2, 10, 13, 15, 17, 23, 31]), and similar efforts, directed at the needs of end users, could be worthwhile. However, significant differences exist between professional and enduser software development, and these differences have ramifications for any such efforts. First, end users rarely have knowledge of software engineering methodologies, and are unlikely to take the time to acquire it. Traditional fault localization techniques often assume that their users have at least some knowledge of software engineering in order to properly employ the technique or understand its feedback. (As research [7, 12] explains, understanding is critical to trust, which in turn is critical to users actually believing a system’s output and acting upon it.) Such techniques may be unsuitable for end users. Second, end-user programming environments are usually modeless and interactive: users incrementally experiment with their software and see how the results work out after each change. Fault localization techniques that rely on batch processing (e.g., [2]) are inconsistent or even incompatible with these types of environments. Third, end users do not usually possess organized test suites, so large amounts of testing-derived data are rarely available for use in end-user environments. Complicating the situation is the interactive nature of end-user debugging: when end users observe a failure they often begin debugging immediately — not after running several tests — at which time the system may have little information with which to provide feedback. Thus, a fault localization tech-
End users develop more software than any other group of programmers, using software authoring devices such as e-mail filtering editors, by-demonstration macro builders, and spreadsheet environments. Despite this, there has been little research on finding ways to help these programmers with the dependability of their software. We have been addressing this problem in several ways, one of which includes supporting end-user debugging activities through fault localization techniques. This paper presents the results of an empirical study conducted in an end-user programming environment to examine the impact of two separate factors in fault localization techniques that affect technique effectiveness. Our results shed new insights into fault localization techniques for end-user programmers and the factors that affect them, with significant implications for the evaluation of those techniques.
Categories and Subject Descriptors D.2.5 [Software Engineering]: Testing and Debugging—debugging aids, testing tools; D.2.6 [Software Engineering]: Programming Environments—interactive environments; H.4.1 [Information Systems Applications]: Office Automation—spreadsheets
General Terms Experimentation, Verification
Keywords fault localization, debugging, end-user software engineering, enduser programming
1. INTRODUCTION A quiet paradigm shift is occurring in the world of software. Not long ago, most software was developed by “professional” program∗Work performed at Oregon State University, Corvallis, OR, USA.
Permission to make digital or hard copies of all or part of this work for personal or classroom use is granted without fee provided that copies are not made or distributed for profit or commercial advantage and that copies bear this notice and the full citation on the first page. To copy otherwise, to republish, to post on servers or to redistribute to lists, requires prior specific permission and/or a fee. ICSE’05, May 15–21, 2005, St. Louis, Missouri, USA. Copyright 2005 ACM 1-58113-963-2/05/0005 ...$5.00.
352
2.
nique that requires large amounts of data (e.g., [15]) may be inappropriate for end users. Fourth, evidence shows that end users often make mistakes when performing interactive testing and debugging tasks [27]. (Professional programmers err too, of course, but their understanding of testing processes may render them less error-prone than end users.) Unfortunately, many fault localization techniques (e.g., [17]) cannot operate effectively with such unreliable information. We have been working to bring fault localization support to end users in ways that accommodate the foregoing considerations. Our previous work [26, 27] shows that this support can help end users find faults by leading them to employ more effective debugging strategies. However, our results also show that, at times, some fault localization techniques are not effective. Analysis of the cases in which the techniques are not effective suggests that there are actually two distinct factors involved in technique design that could be impacting their performance. The first factor — information base — refers to the type of information maintained by a technique and is commonly the subject of the research literature on fault localization. The second factor — mapping — refers to the way in which a technique maps the information into feedback, including both the calculation of this feedback using the information provided by the information base, and displaying the feedback in a manner that is compatible with the surrounding environment. Surprisingly, compared to the information base factor, this mapping factor has received scant attention in the research literature. Further, in our search of the literature we can find no previous work that has separated the impact of these two factors on a fault localization technique’s effectiveness. This work makes four contributions. First, we empirically investigate the impact of both information base and mapping on the effectiveness of fault localization techniques. Our results indicate that each factor significantly impacts effectiveness; thus, both must be considered when developing fault localization techniques. Second, we add to the end-user software engineering literature by providing empirical data on three information bases and three mappings that can be used in techniques for end-user programmers. Third, we provide insights into the way in which interactive fault localization effectiveness should be measured — insights that have implications for future empirical evaluations of end-user fault localization techniques. Fourth, we add to the growing body of evidence that end users make mistakes when performing interactive testing and debugging tasks, which has implications for the types of techniques that may be suitable for end-user programmers.
BACKGROUND: WYSIWYT
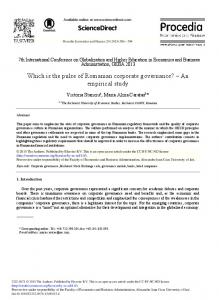
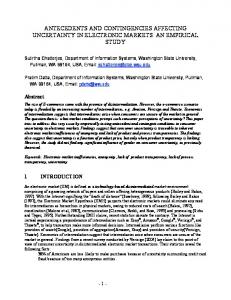
Our fault localization techniques are prototyped in the spreadsheet paradigm in conjunction with our “What You See Is What You Test” (WYSIWYT) testing methodology [25], which we briefly describe here. Figure 1 presents an example of WYSIWYT in Forms/3 [11], a spreadsheet language utilizing “free-floating” cells in addition to traditional spreadsheet grids. WYSIWYT’s underlying assumption is that, as a user incrementally develops a spreadsheet, he or she is also testing incrementally. Because the intended audience is end users, all communication is performed through visual devices. In WYSIWYT, untested cells that have non-constant formulas are given a red border (light gray in this paper). (Cells whose formulas are simply constants do not participate in WYSIWYT devices, since the assumption is that they do not need to be tested.) The borders of such cells remain red until they become more “tested”. For cells to become more tested, tests must occur. These tests can occur at any time — intermingled with formula edits, formula additions, and so on. The process is as follows. Whenever √ a user notices a correct value, he or she can place a checkmark ( ) in the decision box at the corner of the cell observed to be correct: this testing decision completes a successful “test”. Checkmarks can increase the “testedness” of cells, which is reflected by adding more blue to cell borders (more black in this paper). Further, because a correct value in a cell c depends on the correctness of the cells contributing to c, these contributing cells participate in c’s test. WYSIWYT testedness colors reflect the use of a dataflow test adequacy criterion that measures the interrelationships in the source code that have been covered by the user’s tests. In addition to the cell level, WYSIWYT provides user feedback about testedness at two other granularities. A “percent testedness” indicator provides testedness feedback at the spreadsheet granularity. Testedness feedback is also available at a finer granularity through the colors of dataflow arrows, which can be shown at the cell level or at the subexpression level. The system also provides testedness feedback through an intelligent explanation system [33], implemented via “on-demand” tooltips that display the testedness of any specified cell or dataflow relationship.
3.
ADDING FAULT LOCALIZATION FOR END USERS
Most fault localization support attempts to help programmers locate the causes of failures in two ways: (1) by indicating the ar-
Figure 1: An example of WYSIWYT in Forms/3.
353
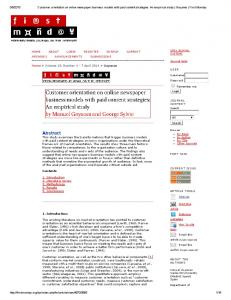
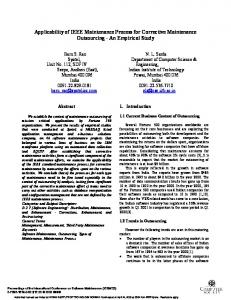
Figure 2: An example of fault localization in the Forms/3 spreadsheet environment. eas that should be searched for faults, thereby reducing the search space; and (2) by indicating the areas most likely to contain faults, thereby prioritizing the sequence of the search through this space. In our prototype, WYSIWYT serves as a springboard for fault localization: instead of noticing that a cell’s value is correct and placing a checkmark, a user might notice that a cell’s value is incorrect (a failure) and place an “X-mark”. In Figure 2, the user notices an incorrect value in Exam Avg — the value is too high — and places an X-mark in the cell’s decision box. X-marks trigger a fault likelihood calculation for each cell (with a non-constant formula) that might have contributed to the failure. Fault likelihood, updated for each appropriate cell after any testing decision or formula edit, is represented by coloring the interior of suspect cells in shades of red (gray in this paper). This serves our first goal of reducing the user’s search space. As the fault likelihood of a cell increases, the suspect cell is colored in increasingly darker shades of red (gray). The darkest cells are estimated to be the most likely to contain the fault, and are the best candidates for the user to consider in debugging; this serves our second goal of helping end users prioritize their search. (This approach is generalizable to paradigms other than spreadsheets [27].) We have previously developed three techniques for realizing this support [26], which we briefly summarize here.
dataflow from c to the cell in which the t2 testing decision was made goes through the cell in which the t1 testing decision was made.) This is accomplished by maintaining, for each cell c, (1) information on the tests to which that cell contributes, and (2) dataflow information to determine which of those tests are blocked and unblocked from the cell. Unlike in the Test Count Technique, only the failed tests that are not blocked from c increase c’s fault likelihood, while only the passed tests that are not blocked from c decrease c’s fault likelihood. As with Test Count, there are many possible schemes to control the impact of failed and passed tests on fault likelihood feedback. The Blocking Technique in this paper uses the scheme from our previous work [26] that required two passed tests to counteract the effects of one failed test. Program dicing [17] uses an approach that is similar to our Blocking Technique. • Nearest Consumers. We designed the “Nearest Consumers Technique” to be a low-cost alternative to the other two techniques, whose maintenance of all testing history for each spreadsheet cell may come at too great a cost as spreadsheet size increases. Nearest Consumers is a greedy technique that considers only the direct consumers of a cell c (i.e., those cells connected with c directly by a dataflow edge). The fault likelihood of c is first estimated by computing the average fault likelihood of c’s direct consumers (if any). This average fault likelihood is then adjusted based on the current testing decisions for c and c’s direct consumers. The possible adjustments are described in detail in previous work [26]. To summarize these adjustments, the fault likelihood of c increases if c or c’s direct consumers contain sufficiently more failed tests than passed tests using a set of defined thresholds [26] — the motivation being that areas in the spreadsheet showing many failures (failed tests) are more likely to contain faults. Similarly, the fault likelihood of c decreases if c or c’s direct consumers contain sufficiently more passed tests than failed tests using a set of defined thresholds — the motivation being that areas in the spreadsheet showing many successes (passed tests) are less likely to contain faults. This “discount” technique is more modest than most other fault localization techniques described in the literature.
• Test Count. The technique we term “Test Count” maintains, for each cell c, the number of failed tests (i.e., X-marks) and passed tests (i.e., checkmarks) in which c has participated. These failed tests increase c’s fault likelihood, while the passed tests decrease c’s fault likelihood. Of course, there are varying schemes that such a technique could use to decide the degree to which failed and passed tests impact fault likelihood feedback; in this paper, the Test Count Technique uses the scheme from our previous work [26] in which two passed tests were necessary to counteract the effects of one failed test. TARANTULA [15], a fault localization technique for traditional programming languages, uses an approach that is similar to our Test Count Technique. • Blocking. The “Blocking Technique” includes not only failed and passed tests, but also whether tests are blocked from a cell c by one or more other tests. (A test t1 can “block” another test t2 from affecting the fault likelihood of c if all
354
Our previous empirical work [26, 27] shows that these three fault localization techniques can provide feedback that is useful to end users. However, the work also suggests that two separate factors, one of whose impact on fault localization has not been studied before, might impact technique effectiveness. This paper investigates this possibility.
the advantage of eliciting test suites from real end users, but it has two drawbacks. First, for proper statistical comparison, it would require an inordinately large number of subjects. Second, since each technique would be given different testing actions, it would be very difficult to control for the fact that differences in test suites might cause differences in results. The second methodology involves following a classic test suite generation approach: generate hypothetical test suites according to some criterion, and select (randomly or according to other criteria) tests from these test suites to simulate end users’ testing actions. A drawback of this approach is that the test suites thus created could not be tied to our ultimate users, and may not be representative of real end-user testing actions. The third methodology involves obtaining testing actions from real end users, and then uniformly applying these actions across all information base and mapping combinations. This third methodology avoids the drawback of requiring an inordinate number of subjects. It also has the advantages of using testing actions representative of those performed by real end users, and of measuring each technique’s ability to provide feedback given the same testing actions. This latter advantage avoids confounding differing techniques with differing test suites. We thus chose the third methodology. We obtained the required testing actions from 20 end-user participants: 18 undergraduate students and two graduate students from Oregon State University without personal or professional programming experience. The test suites, as defined by the testing actions that the end users performed, were thus the “subjects” of our experiment.
4. EXPERIMENT Any fault localization approach that includes some form of reporting or feedback to a human involves two factors: • Information Base: To support the behavior of a fault localization technique, information must be stored and maintained either by the technique or by the surrounding environment. To abstract away implementation or algorithmic details such as data structures, we use this term to refer only to the type of information used and the circumstances under which it is maintained. • Mapping: Mappings transform information bases into fault localization feedback. This transformation involves both calculating a cell’s fault likelihood using the information provided by the information base, and then transforming that calculation into appropriate feedback for the user in a manner that is consistent with the goals of the technique and compatible with the surrounding environment. For example, TARANTULA [15] uses a set of failed and passed tests, and coverage information indicating the program points contributing to each test, as its information base. Its mapping uses this information to calculate (1) a color representing each statement’s participation in testing, and (2) the technique’s confidence in the correctness of each color. (TARANTULA colors statements because these types of visualizations are compatible with the technique’s surrounding environment.) To gain insight into the importance of each factor, we investigate the following research questions for end-user fault localization:
4.2
Materials
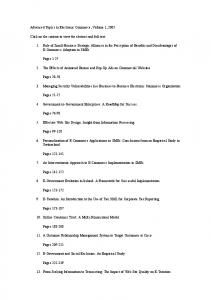
The experiment utilized two spreadsheet tasks, Gradebook and Payroll (shown in Figures 2 and 3, respectively). To make our spreadsheets representative of real end-user spreadsheets, Gradebook was derived from an Excel spreadsheet of an (end-user) instructor, which we ported into an equivalent Forms/3 spreadsheet. Payroll was a spreadsheet designed by two Forms/3 researchers from a payroll description from a real company. These spreadsheets were seeded with five faults created by real end users. To obtain these faults, we provided three separate end users with (1) a “template” spreadsheet for each task with cells and cell names, but no cell formulas; and (2) a description of how each spreadsheet should work, which included sample values and correct results for some cells. Each person was given as much time as he or she needed to design the spreadsheet using these materials. From the collection of faults left by the end users, we chose five that provided coverage of the categories in Panko’s classification system [21], which is based on Allwood’s classification system [4]. Under Panko’s system, mechanical faults include simple typographical errors or wrong cell references. Logical faults are mistakes in reasoning and are more difficult to detect and correct than mechanical faults. An omission fault is information that has never been entered into a cell formula, and is the most difficult to detect [21]. We seeded Gradebook with three mechanical faults, one logical fault, and one omission fault, and Payroll with two mechanical faults, two logical faults, and one omission fault. Payroll was intended to be the more difficult spreadsheet due to its larger size, greater level of dataflow and intertwined dataflow relationships, and more difficult faults.
RQ1: Do differences in information bases impact effectiveness? RQ2: Do differences in mappings impact effectiveness? RQ3: Does inaccurate information impact information bases and effectiveness? One reason to investigate RQ1 is that fault localization research often focuses on information bases. If this factor affects techniques’ effectiveness in interactive programming environments, then end users may benefit from research that focuses on professional programmers. Previous fault localization research often evaluates techniques as a whole, without considering the specific factors that contribute to observed results. We devised RQ2 because we suspect that mapping alone could be an important factor in determining a technique’s effectiveness. Our third research question was inspired by the unreliability in interactive end-user testing that we have seen in previous empirical work [27]. This question focuses on information bases because it is specifically the information base that is corrupted by such mistakes.
4.1 Design In formulating our experiment, we considered three methodologies for gathering sources of data. The first methodology involves following the classic human-subjects approach: gather participants for the nine possible mapping and information base combinations and compare effectiveness across groups. This methodology has
4.3
Dependent Variable and Measures
As a dependent variable, we require a measure of a fault localization technique’s effectiveness. Many such measures are possible. In this experiment, our goal is to study the ability of techniques to
355
Figure 3: The Payroll task. point out faults by applying identical test suites uniformly. Thus, we define effectiveness as a technique’s ability to correctly and visually differentiate the correct cells in a spreadsheet from those cells that actually contain faults. Using this notion, we chose to measure effectiveness in terms of the visual separation between the faulty cells and the correct cells of each spreadsheet. Our previous work [27] indicated that users usually restrict their attention during debugging only to the cells indicated in the fault localization feedback (i.e., the colored cells). Given this finding, in this experiment, we decided to focus our measure only on the cells colored by the technique. Let FaultyCells(AvgFL) be the average fault likelihood of colored faulty cells. Let CorrectCells(AvgFL) be the average fault likelihood of colored correct cells. The formula to calculate effectiveness according to this measure is then:
when no other session is already in progress.) This point marks the first opportunity for techniques to provide feedback. • Second X-mark. The second X-mark’s computations are based on more information than the first X-mark, so measuring at this point helps us gauge effectiveness trends over time. (In principle, third X-marks, fourth X-marks, and so on could also be used, but the participants in our experiment kept their debugging incremental, with almost all debugging sessions involving two or fewer X-marks.) • Last Test. When users find the cause of a failure (a fault), they often immediately try to fix it. This point includes at least one X-mark and any number of checkmarks, and denotes the end of a debugging session. As such, it is the point at which techniques have the most information available to them. Once a user edits the “source code” (formula), downstream fault localization information becomes obsolete, and is discarded.
Ef f = F aultyCells(AvgF L) − CorrectCells(AvgF L)
Subtraction is used instead of calculating a ratio because the color choices form an ordinal, not a ratio, scale. Positive effectiveness is preferable, and a greater effectiveness implies a better distinction between faulty and non-faulty cells.
We emphasize that the need to evaluate effectiveness at multiple points is not specific to our particular experiment. Rather, we recommend that any interactive fault localization technique be evaluated on the basis of multiple feedback points because otherwise important data reported by the technique may be overlooked.
4.4 Points of Evaluation At what point should we measure effectiveness? Many traditional techniques report feedback only at the end of a batch processing of information. This point of maximal system reasoning potential — when the system has its best (and only) chance of producing correct feedback — is therefore the appropriate point at which to measure the effectiveness of these techniques. Given the interactive nature of end-user environments, however, debugging, and therefore fault localization use, occur not just at the end of testing, but throughout the testing process. Measuring effectiveness only at the end of testing would thus ignore most of the reporting being done by the interactive technique. In principle, we could measure effectiveness at each point at which a user receives feedback. However, it is not statistically viable to utilize every such point, because many will not be reached by numbers of users sufficient to support comparisons. Therefore, we elected to measure effectiveness at just the following feedback points:
4.5
Information Bases and Mappings
The information base and mapping factors in fault localization techniques have not been previously isolated. To learn whether each factor significantly impacts technique effectiveness, while also providing data on techniques in the literature, we used the information bases and mappings of the three techniques described in Section 3. As described earlier, the information base factor of a fault localization technique is responsible solely for storing and maintaining the information required by the technique in order to provide fault localization feedback. We now describe the three information bases of our own techniques. • Test Count (I-TC). This technique’s information base maintains, for each cell c, the set of failed and passed tests that dynamically execute c. The size of I-TC grows with respect to both spreadsheet and test suite size.
• First X-mark. When a failure is first reported by users (in our environment, signaled by an X-mark), they immediately receive fault localization feedback. We term this the beginning of a debugging session. (X-marks initiate such sessions only
• Blocking (I-BL). There are two aspects to this information base. Like I-TC, I-BL maintains a list of all failed and
356
passed tests for each cell. However, to achieve the “blocking” behavior described in Section 3, I-BL also tracks the dataflow relationships between each cell, using this information to allow tests, under certain circumstances, to “block” other tests from reaching certain cells. Note that unlike program dicing [17], “blocking” does not completely remove cells from a program slice, as would dicing, because evidence [27] indicates that users occasionally make erroneous testing decisions, and such decisions could cause the removal of a cell that actually contains a fault. (Rather than being removed from the program slice, such cells are later assigned a “minimal fault likelihood”.) Because of the overhead necessary to track dataflow and blocking information, I-BL is more computationally expensive than I-TC.
current testing decision for each cell to adjust this calculated mean if c and c’s direct consumers contain sufficiently more passed tests than failed tests, or sufficiently more failed tests than passed tests [26]. It also supports five fault likelihood values, and begins by assigning c the third fault likelihood value so as to make it viable to both increase and decrease fault likelihood values as c’s direct consumers’ fault likelihood values increase and decrease. Each of these three mappings expects a certain type of information, and has attributes developed specifically to handle that information. For example, the M-NC mapping expects the current fault likelihood of cells in order to compute the average fault likelihood of each cell c’s direct consumers. Such attributes must be characteristic of any mapping that is leveraging the I-NC information base. Therefore, without considering the attributes that “bind” a mapping to an information base, the essence of the differences among our three mappings are two shared characteristics: (1) the number of possible fault likelihood values, and (2) an “initial” value used to start assigning fault likelihood feedback. As such, when we refer to applying a mapping to an information base, we refer to applying only these two characteristics of one mapping to another to create an entirely new mapping for that technique. We do not attempt to tease apart the influences of these two characteristics, but simply consider them together to learn whether changing the mapping factor of a technique can significantly impact that technique’s effectiveness. Since the testing actions to be uniformly applied across techniques had to include fault localization use, some technique had to be incorporated into the environment for participant use. Because of their successes in earlier empirical work [26, 27], we chose to incorporate the I-TC information base with the M-BL mapping into the environment.
• Nearest Consumers (I-NC). Rather than maintaining a history of all previous testing decisions, as do the previous two information bases, the I-NC information base tracks only (1) the fault likelihood of each cell in the spreadsheet prior to a new testing decision, and (2) the current testing decision for each cell affected by the current test case (i.e., the current set of input values), including that current test case. Since each of these components requires only constant space for each cell in the spreadsheet, the information base grows with respect to spreadsheet size only, and is therefore the least expensive of the three. Because the context of our experiment is interactive fault localization, each of these information bases is immediately updated whenever any action is taken by a user that affects the contents of the base, potentially interfering with the environment’s interactivity. One reason to compare these information bases, then, is to learn whether a modest information base such as I-NC can compete in effectiveness with the other two more expensive information bases. The mapping factor uses the information stored by the information base to calculate and display fault localization feedback. We now describe the three mappings of our own three techniques.
4.6
Procedure
After completing a background questionnaire, participants were given a tutorial to familiarize them with the environment. The tutorial taught the use of WYSIWYT (checkmarks and associated feedback), but did not include debugging or testing strategy content. We also did not teach the use of fault localization; rather, participants were introduced to the mechanics of placing X-marks and given time to explore any aspects of the feedback that they found interesting. After the tutorial, participants were given the two tasks with instructions to test the spreadsheets and correct any errors found, supported by I-TC and M-BL. The experiment was counterbalanced with respect to task order so as to distribute learning effects evenly. The tasks necessarily involved time limits — set at 20 minutes for Gradebook and 30 minutes for Payroll — to ensure participants worked on both tasks, and to remove possible peer influence of some participants leaving early. To obtain the participants’ testing actions, the actions by each participant were recorded into electronic transcripts.
• Test Count (M-TC). This technique’s mapping increases a cell c’s fault likelihood for each failed test that c contributed to, and decreases c’s fault likelihood for passed tests in a manner such that two passed tests counteract the effects of one failed test. The mapping uses the set of failed and passed tests for each cell to increase the fault likelihood of cells contributing to many failed tests, and decrease the fault likelihood of cells contributing to many passed tests, as described in Section 3. It has the characteristic of mapping information bases to four possible fault likelihood values, and begins by assigning c the lowest fault likelihood if it contributes to a single failure (X-mark), thereby allowing fault likelihood to build with further failures. • Blocking (M-BL). This mapping is similar to M-TC, except that it considers only the failed and passed tests that are not blocked, as those are the only tests provided to the mapping by the I-BL information base. It also supports five, rather than four, fault likelihood values, and begins by assigning c the second lowest fault likelihood value so as to be able to build a cell’s fault likelihood value as the number of failed tests increases, and also reduce fault likelihood as the number of passed tests or blocked failed tests increases.
4.7
Threats to Validity
Any controlled experiment is subject to threats to validity, and these must be considered in order to assess the meaning and impact of results. (Wohlin et al. [34] provide a general discussion of validity evaluation and a threats classification.) Threats to internal validity are other factors that may be responsible for our results. The specific faults seeded in a spreadsheet can affect fault localization results. To reduce this threat, we selected faults according to Panko’s classification scheme [21] to ensure that
• Nearest Consumers (M-NC). This mapping uses the information regarding the fault likelihood of each cell to compute the average fault likelihood of c’s direct consumers. It uses the
357
different types of faults were included. Also, as mentioned in Section 4.5, to apply the same test suites uniformly across all techniques, we had to obtain suites using a single information base and mapping. It is possible that the test suites created by participants would have varied in response to fault localization feedback had a different information base or mapping been chosen. However, had we chosen a design that allowed for varying testing actions, we would have risked confounding the independent variable — information base or mapping selection — with a second variable of varying suites. Threats to construct validity question whether the results of an experiment are based on appropriate information. Our effectiveness metric considers only the cells colored by a technique. This ignores search space size (i.e., the number of colored cells) because cells that are not visually colored are not considered by the metric. To consider an alternative metric, we cross-checked our results with the metric used in our previous work [26] (which does consider search space size) and found the same trends and results. (We do not report these results due to space constraints.) Threats to external validity limit the extent to which results can be generalized. To increase the representativeness of our spreadsheets, we selected “real-world” spreadsheets from a real end-user instructor and a real payroll description. Our spreadsheets were also moderate in size in order to allow subjects to make progress in the task in the allotted time. In the future, case studies could be conducted with larger spreadsheets so that participants could work through larger tasks, and not be faced with the time constraints that were necessarily imposed on this experiment. Also, the ability to generalize our results may also be limited by our selection of faults. To limit this threat we attempted to seed realistic faults using the procedures outlined in Section 4.2. Finally, our experiment was conducted in the Forms/3 research language [11]; however, end users may debug differently in a different language. All of these external validity concerns can be addressed only through repeated studies, using different spreadsheets, faults, and languages.
mation bases’ effectiveness three times, once under each mapping. The comparisons were done at each feedback point described in Section 4.4. As a statistical vehicle for our analyses, we state the following (null) hypotheses: H1: There is no difference in effectiveness among the three information bases with the M-TC mapping. H2: There is no difference in effectiveness among the three information bases with the M-BL mapping. H3: There is no difference in effectiveness among the three information bases with the M-NC mapping. Tables 1(a)–1(c) show the results. We used the Friedman test [29] to statistically analyze the data. This test is an alternative to the repeated measures ANOVA when the assumption of normality or equality is not met. (We did not run Friedman tests on the Second X-mark data due to the small sample sizes.) Table 1(a) shows no significant differences in information base effectiveness at the 0.05 level under use of the M-TC mapping, so H1 cannot be rejected. However, Table 1(b) shows marginal significance (0.10) at the First X-mark for the Payroll task and 0.01 significance by the Last Test. Differences are even more pronounced in Table 1(c). Therefore, we reject H2 and H3.
5.2
H4: There is no difference in effectiveness among the three mappings with the I-TC information base. H5: There is no difference in effectiveness among the three mappings with the I-BL information base. H6: There is no difference in effectiveness among the three mappings with the I-NC information base.
5. RESULTS
As Tables 2(a)–2(c) show, there were significant differences in effectiveness among the different mappings. The differences were almost always significant at the 0.05 level, and often significant at the 0.01 level. Clearly, H4, H5, and H6 must all be rejected.
5.1 RQ1: Information Base To investigate the different information bases’ impact on effectiveness independent of the mapping factor, we compared the infor-
Gradebk (n = (p = 0.8948) Payroll (n = (p = 0.1211)
Gradebk (n = (p = n/a) Payroll (n = (p = n/a)
Gradebk (n = (p = 0.4389) Payroll (n = (p = 0.0608)
First X-mark I-TC 18) 0.39 (0.50) 13) 0.00 (0.00) Second X-mark I-TC 3) 0.00 (1.00) 5) 0.15 (0.46) Last Test I-TC 18) -0.06 (0.54) 13) 0.13 (0.28)
I-BL 0.26 (0.62) -0.17 (0.40)
I-NC 0.39 (0.50) 0.04 (0.08)
Gradebk (n = (p = 0.7165) Payroll (n = (p = 0.1000)
I-BL 0.16 (0.76) 0.01 (0.12)
I-NC 0.00 (1.00) 0.18 (0.49)
Gradebk (n = (p = n/a) Payroll (n = (p = n/a)
I-BL 0.00 (0.49) -0.12 (0.48)
I-NC -0.04 (0.51) 0.21 (0.50)
Gradebk (n = (p = 0.4464) Payroll (n = (p = 0.0128)
(a) Information bases with M-TC
RQ2: Mapping
How important is mapping alone to effectiveness? Table 1 is suggestive in this regard. To statistically consider whether this factor had a significant impact on effectiveness, we used the Friedman test to compare the mappings’ effectiveness under each information base. The hypotheses in this case were:
First X-mark I-TC 18) 0.83 (0.84) 13) 0.29 (0.42) Second X-mark I-TC 3) 0.33 (2.08) 5) 0.37 (0.95) Last Test I-TC 18) 0.26 (1.12) 13) 0.30 (0.60)
I-BL 0.86 (1.00) 0.35 (0.33)
I-NC 0.94 (0.92) 0.49 (0.40)
Gradebk (n = (p = 0.0923) Payroll (n = (p = 0.0695)
I-BL 0.50 (1.80) 0.36 (0.60)
I-NC 0.50 (1.80) 0.56 (0.83)
Gradebk (n = (p = n/a) Payroll (n = (p = n/a)
I-BL 0.33 (1.06) 0.60 (0.53)
I-NC 0.38 (1.03) 0.77 (0.66)
Gradebk (n = (p = 0.0022) Payroll (n = (p = 0.0199)
(b) Information bases with M-BL
First X-mark I-TC 18) 1.14 (1.32) 13) 0.69 (0.78) Second X-mark I-TC 3) 0.50 (2.78) 5) 0.69 (1.17) Last Test I-TC 18) 0.27 (1.52) 13) 0.65 (0.86)
I-BL 1.39 (1.37) 0.54 (0.65)
I-NC 1.50 (1.39) 0.93 (0.80)
I-BL 0.83 (2.57) 0.54 (1.05)
I-NC 1.00 (2.65) 0.94 (1.22)
I-BL 0.76 (1.48) 0.83 (0.88)
I-NC 0.79 (1.61) 1.27 (0.95)
(c) Information bases with M-NC
Table 1: Isolating the information base factor. The mean (standard deviation) effectiveness comparing the three information bases with the same mapping are shown. The information base with the greatest average effectiveness is shown in bold. The “p” denotes p-values of the Friedman tests, and “n” denotes the number of subjects measured at each point.
358
Gradebk (n = (p = 0.0031) Payroll (n = (p = 0.0060)
Gradebk (n = (p = n/a) Payroll (n = (p = n/a)
Gradebk (n = (p = 0.1180) Payroll (n = (p = 0.1220)
First X-mark M-TC 18) 0.39 (0.50) 13) 0.00 (0.00) Second X-mark M-TC 3) 0.00 (1.00) 5) 0.15 (0.46) Last Test M-TC 18) -0.06 (0.54) 13) 0.13 (0.28)
M-BL 0.83 (0.84) 0.29 (0.42)
M-NC 1.15 (1.32) 0.69 (0.78)
Gradebk (n = (p = 0.0004) Payroll (n = (p = 0.0016)
M-BL 0.33 (2.08) 0.37 (0.95)
M-NC 0.50 (2.78) 0.69 (1.17)
Gradebk (n = (p = n/a) Payroll (n = (p = n/a)
M-BL 0.26 (1.12) 0.30 (0.60)
M-NC 0.27 (1.52) 0.65 (0.86)
Gradebk (n = (p = 0.0424) Payroll (n = (p = 0.0001)
(a) Mappings with I-TC
First X-mark M-TC 18) 0.26 (0.62) 13) -0.17 (0.40) Second X-mark M-TC 3) 0.16 (0.76) 5) 0.01 (0.12) Last Test M-TC 18) 0.00 (0.49) 13) -0.12 (0.48)
M-BL 0.86 (1.00) 0.35 (0.33)
M-NC 1.39 (1.37) 0.54 (0.65)
Gradebk (n = (p = 0.0001) Payroll (n = (p = 0.0005)
M-BL 0.50 (1.80) 0.36 (0.60)
M-NC 0.83 (2.57) 0.54 (1.05)
Gradebk (n = (p = n/a) Payroll (n = (p = n/a)
M-BL 0.33 (1.06) 0.60 (0.53)
M-NC 0.76 (1.48) 0.83 (0.88)
Gradebk (n = (p = 0.0045) Payroll (n = (p = 0.0036)
(b) Mappings with I-BL
First X-mark M-TC 18) 0.39 (0.50) 13) 0.04 (0.08) Second X-mark M-TC 3) 0.00 (1.00) 5) 0.18 (0.49) Last Test M-TC 18) -0.04 (0.51) 13) 0.21 (0.50)
M-BL 0.94 (0.92) 0.49 (0.40)
M-NC 1.50 (1.39) 0.93 (0.80)
M-BL 0.50 (1.80) 0.56 (0.83)
M-NC 1.00 (2.65) 0.94 (1.22)
M-BL 0.38 (1.03) 0.77 (0.66)
M-NC 0.79 (1.61) 1.27 (0.95)
(c) Mappings with I-NC
Table 2: Isolating the mapping factor.
5.3 RQ3: Inaccurate Information
relate to the mistakes the users made in their testing, a point we will return to shortly. Recall that one goal of this study was to provide empirical data on three particular information bases and mappings. Although all of our information bases generally performed well, a surprise was the performance of I-NC. One reason this is surprising is that I-NC is the information base least like those employed in many traditional techniques, which tend to use counts of failed and passed tests (as does I-TC) or dicing-like approaches (as does I-BL). A second reason is that I-NC is the least computationally expensive of the information bases we compared. Turning to RQ2, the role of the mapping factor was quite pronounced. While we found two significant differences at the 0.05 level and one difference at the 0.01 level in RQ1, our investigation of RQ2 yielded one significant difference at the 0.05 level, and nine differences at the 0.01 level. These significant differences occurred despite only small distinctions among the three mappings (i.e., the number of fault likelihood values, and the “initial” value). This result has two implications. First, great care should be exercised in selecting mappings for fault localization techniques. To our knowledge, no previous work has provided empirical evidence to support this finding. Second, because both factors are important, evaluating each factor separately is important in order to obtain ac-
As our first step, to investigate the frequency of mistakes, we counted the number of incorrect testing decisions made in each end-user test suite. In the context of our environment, this is either √ a WYSIWYT checkmark ( ) signifying a correct value and placed in a cell that really has an incorrect value, or an X-mark signifying an incorrect value (a failure) and placed in a cell that really has a correct value. In the Gradebook task, 8.99% of the checkmarks and 5.95% of the X-marks were incorrect. This trend continued in Payroll, where 20.62% of the checkmarks and 3.33% of the X-marks were incorrect. Given that such mistakes corrupt information bases, how did these mistakes impact an information base’s effect on effectiveness? To investigate this, we measured effectiveness at each First X-mark, Second X-mark, and Last Test that was in the context of at least one incorrect testing decision. We isolated information bases using the same procedure as Section 5.1. The hypothesis in this case is: H7: There is no difference in effectiveness among the information bases when inaccurate information is present. Although we ran comparisons under all three mappings, due to space constraints, we show only measurements taken under the M-NC mapping, because M-NC was the superior mapping in Section 5.2. (The information bases under the other mappings show the same general trend.) As Table 3 shows, on the last test in debugging sessions, differences in each information base’s effectiveness were marginally significant for Payroll, and significant (at the 0.01 level) for Gradebook. Thus, we reject H7.
First X-mark I-TC Gradebk (n = 13) 1.10 (p = 0.1251) (1.27) Payroll (n = 10) 0.68 (p = 0.1095) (0.79) Second X-mark I-TC Gradebk (n = 3) 0.50 (p = n/a) (2.78) Payroll (n = 3) 1.28 (p = n/a) (1.00) Last Test I-TC Gradebk (n = 13) -0.11 (p = 0.0024) (1.36) Payroll (n = 10) 0.70 (p = 0.0665) (0.84)
6. DISCUSSION The results regarding RQ1 showed that information base often made a significant difference in effectiveness. This result is consistent with other fault localization research. We also found that the information bases’ differences in effectiveness were most pronounced at the end of debugging sessions, most likely due to the increased testing information available, allowing the techniques a greater opportunity to differentiate themselves from each other. That effectiveness, however, did not always improve as debugging sessions progressed — in the case of Gradebook, all nine combinations of information base and mapping became worse. This may
I-BL 1.42 (1.48) 0.45 (0.55)
I-NC 1.56 (1.38) 0.95 (0.80)
I-BL 0.83 (2.57) 0.85 (1.20)
I-NC 1.00 (2.65) 1.24 (1.52)
I-BL 0.58 (1.57) 0.67 (0.71)
I-NC 0.59 (1.65) 1.16 (0.94)
Table 3: Isolating the information bases with M-NC in the context of mistakes.
359
curate information regarding a technique. Otherwise, in attempting to improve a technique’s ability to pinpoint faults, researchers could actually weaken their technique’s effectiveness by manipulating a factor that was already working well and overlooking the real culprit. One result from RQ3 was that the end-user test suites contained many mistakes, corroborating previous findings [27]. The effects of these mistakes were far-reaching too — although they numbered just under 25% of the tests, they affected 74% of the debugging sessions. This result underlines the seriousness with which this issue should be regarded, especially since it runs contrary to a common assumption in prior research: that all testing has been reliable.
sues that arise in end-user software. We are working on ways to bring software engineering methodologies to bear upon this problem, focusing in this paper on fault localization for end-user programmers. In this paper we have considered two factors that make up fault localization techniques — information base and mapping — and investigated their impact on effectiveness. The work makes four primary contributions. First, we describe two factors that affect fault localization techniques, and provide empirical data indicating that each factor significantly impacts the effectiveness of techniques. Two immediate implications are the need to separately (1) design and (2) evaluate each factor. While it may make intuitive sense that each factor would play a role in technique effectiveness, to date, no studies have explicitly teased the two factors apart and empirically confirmed that each indeed does have a significant role in effectiveness. Second, we provide data on three particular information bases and three mappings for fault localization techniques, which serves to address the lack of empirical data concerning fault localization support for end users. In doing so, we found that the inexpensive, non-traditional I-NC information base performed particularly well. This surprising result makes I-NC especially advantageous in end-user programming given the importance of responsiveness in these highly interactive environments. Third, we show why traditional measures for fault localization effectiveness, which are taken at the points of maximal system reasoning potential, are unsuitable in evaluating effectiveness in interactive environments, and we present a set of measures that is instead taken at user feedback points. This type of measurement is critical when measuring interactive debugging devices, which are common in end-user programming environments, to ensure that important feedback is not omitted. Fourth, our results corroborate the growing body of evidence that end users make an alarming number of mistakes when performing interactive testing and debugging tasks; in our experiment, 74% of the debugging sessions were performed in the context of at least one incorrect testing decision. Such evidence suggests that some fault localization techniques, which assume that all testing information is correct, may not be suitable for end users. All four of the above findings run counter to much of the fault localization research aimed at professional programmers. In fact, our results indicate that a number of traditional assumptions in that prior work are not appropriate for fault localization in end-user software environments.
7. RELATED WORK Most fault localization research has been based on program slicing — a survey of which is provided by Tip [30] — and dicing [17] techniques. Our fault localization techniques draw from information gleaned via slicing, and make use of that information using heuristics inspired by dicing. There has been a great deal of work on fault localization strategies for professional programmers (e.g., [2, 10, 13, 15, 17, 23, 31]). For example, Agrawal et al. [2] present a technique, implemented as χslice, for locating faults using execution traces from tests. This technique is based on displaying dices of the program relative to one failing test and a set of passing tests. Jones et al. [15] describe a similar approach implemented as TARANTULA. Unlike χslice, TARANTULA uses information from all passing and failing tests, coloring statements based on the likelihood that each statement is faulty according to its ratio of failing to passing tests. Using a faulty “run” and a larger number of correct runs, Renieris and Reiss’s technique [23] compares the faulty run with the correct run that most resembles it, and reports “suspicious” areas of the program. Two ways in which our approach differs from these are that our methods (1) are targeted at end users, and (2) are interactive and incremental at the granularity of revising fault likelihood estimations in real time after each single program edit. Pan and Spafford [19] present a family of 20 fault localization heuristics based on program statements exercised by passing and failing tests, three of which directly relate to the mappings of our techniques. A little work aimed specifically at aiding end users with fault localization is emerging. For example, Ayalew and Mittermeir [6] present a method of “fault tracing” for spreadsheets that uses “interval testing” and slicing. Woodstein [32] is a web interface agent that assists e-commerce debugging. Ko and Myers [16] present a type of fault localization via the Whyline, an “interrogative debugging” technique. Our approach differs from the first strategy by allowing users to interactively improve feedback by providing the system with additional information, and from all these strategies through the incorporation of a robustness feature [26, 27]. There is other work that can help end users find faults. S2 [28] provides a visual auditing feature in Excel 7.0. Work is emerging to automatically detect certain kinds of errors, such as errors in spreadsheet units [1, 5] and types [3]. There has also been work to help end users detect failures, such as statistical outlier finding [18] and anomaly detection [22]. Finally, the assertions approach [33] in Forms/3 automatically detects failures in spreadsheet cells, and has been shown empirically to help end users.
9.
ACKNOWLEDGMENTS
We thank the participants of our experiment. This work was supported in part by the EUSES Consortium via NSF grant ITR0325273.
10.
REFERENCES
[1] R. Abraham and M. Erwig. Header and unit inference for spreadsheets through spatial analyses. In Proceedings of the IEEE International Symposium on Visual Languages and Human-Centric Computing, pages 165–172, Rome, Italy, September 2004. [2] H. Agrawal, J. Horgan, S. London, and W. Wong. Fault localization using execution slices and dataflow tests. In Proceedings of the Sixth IEEE International Symposium on Software Reliability Engineering, pages 143–151, Toulouse, France, October 1995.
8. CONCLUSIONS Despite the growing number of end-user programmers, to date, relatively little research has sought to address the dependability is-
360
[19] H. Pan and E. Spafford. Toward automatic localization of software faults. In Proceedings of the 10th Pacific Northwest Software Quality Conference, October 1992. [20] R. Panko. Finding spreadsheet errors: Most spreadsheet errors have design flaws that may lead to long-term miscalculation. Information Week, page 100, May 1995. [21] R. Panko. What we know about spreadsheet errors. Journal on End User Computing, pages 15–21, Spring 1998. [22] O. Raz, P. Koopman, and M. Shaw. Semantic anomaly detection on online data sources. In Proceedings of the 24th International Conference on Software Engineering, pages 302–312, Orlando, Florida, USA, May 2002. [23] M. Renieris and S. Reiss. Fault localization with nearest neighbor queries. In Proceedings of the 18th IEEE International Conference on Automated Software Engineering, pages 30–39, Montreal, Quebec, Canada, October 2003. [24] G. Robertson. Officials red-faced by $24m gaffe: Error in contract bid hits bottom line of TransAlta Corp. Ottawa Citizen, June 5, 2003. [25] G. Rothermel, M. Burnett, L. Li, C. Dupuis, and A. Sheretov. A methodology for testing spreadsheets. ACM Transactions on Software Engineering and Methodology, 10(1):110–147, January 2001. [26] J. Ruthruff, E. Creswick, M. Burnett, C. Cook, S. Prabhakararao, M. Fisher II, and M. Main. End-user software visualizations for fault localization. In Proceedings of the ACM Symposium on Software Visualization, pages 123–132, San Diego, California, USA, June 2003. [27] J. Ruthruff, S. Prabhakararao, J. Reichwein, C. Cook, E. Creswick, and M. Burnett. Interactive, visual fault localization support for end-user programmers. Journal of Visual Languages and Computing, 2005 (to appear). [28] J. Sajaniemi. Modeling spreadsheet audit: A rigorous approach to automatic visualization. Journal on Visual Languages and Computing, 11(1):49–82, February 2000. [29] S. Siegel and N. Castellan Jr. Non-parametric Statistics for the Behavioral Sciences. McGraw Hill, Boston, Massachusetts, USA, 1998. [30] F. Tip. A survey of program slicing techniques. Journal on Programming Languages, 3(3):121–189, 1995. [31] J. Voas. Software testability measurement for assertion placement and fault localization. In Proceedings of the International Workshop on Automated and Algorithmic Debugging, pages 133–144, 1995. [32] E. Wagner and H. Lieberman. Supporting user hypotheses in problem diagnosis on the web and elsewhere. In Proceedings of the International Conference on Intelligent User Interfaces, pages 30–37, Funchal, Madeira Island, January 2004. [33] A. Wilson, M. Burnett, L. Beckwith, O. Granatir, L. Casburn, C. Cook, M. Durham, and G. Rothermel. Harnessing curiosity to increase correctness in end-user programming. In Proceedings of the ACM Conference on Human Factors in Computing Systems, pages 305–312, Fort Lauderdale, Florida, USA, April 2003. [34] C. Wohlin, P. Runeson, M. Host, B. Regnell, and A. Wesslen. Experimentation in Software Engineering. Kluwer Academic Publishers, Boston, Massachusetts, USA, 2000.
[3] Y. Ahmad, T. Antoniu, S. Goldwater, and S. Krishnamurthi. A type system for statically detecting spreadsheet errors. In Proceedings of the 18th IEEE International Conference on Automated Software Engineering, pages 174–183, Montreal, Quebec, Canada, October 2003. [4] C. Allwood. Error detection processes in statistical problem solving. Cognitive Science, 8(4):413–437, 1984. [5] T. Antoniu, P. Steckler, S. Krishnamurthi, E. Neuwirth, and M. Felleisen. Validating the unit correctness of spreadsheet programs. In Proceedings of the 26th International Conference on Software Engineering, pages 439–448, Edinburgh, Scotland, May 2004. [6] Y. Ayalew and R. Mittermeir. Spreadsheet debugging. In Proceedings of the European Spreadsheet Risks Interest Group, Dublin, Ireland, July 2003. [7] N. Belkin. Helping people find what they don’t know. Communications of the ACM, 41(8):58–61, August 2000. [8] B. Boehm, C. Abts, A. Brown, and S. Chulani. Software Cost Estimation with COCOMO II. Prentice Hall PTR, Upper Saddle River, New Jersey, USA, 2000. [9] B. Boehm and V. Basili. Software defect reduction Top 10 list. Computer, 34(1):135–137, January 2001. [10] P. Bunus and P. Fritzson. Semi-automatic fault localization and behavior verification for physical system simulation models. In Proceedings of the 18th IEEE International Conference on Automated Software Engineering, pages 253–258, Montreal, Quebec, Canada, October 2003. [11] M. Burnett, J. Atwood, R. Djang, H. Gottfried, J. Reichwein, and S. Yang. Forms/3: A first-order visual language to explore the boundaries of the spreadsheet paradigm. Journal of Functional Programming, 11(2):155–206, March 2001. [12] C. Corritore, B. Kracher, and S. Wiedenbeck. Trust in the online environment. In HCI International, volume 1, pages 1548–1552, New Orleans, Louisiana, USA, August 2001. [13] R. DeMillo, H. Pan, and E. Spafford. Critical slicing for software fault localization. In Proceedings of the International Symposium on Software Testing and Analysis, pages 121–134, San Diego, California, USA, January 1996. [14] D. Hilzenrath. Finding errors a plus, Fannie says; mortgage giant tries to soften effect of $1 billion in mistakes. The Washington Post, October 31, 2003. [15] J. Jones, M. Harrold, and J. Stasko. Visualization of test information to assist fault localization. In Proceedings of the 24th International Conference on Software Engineering, pages 467–477, Orlando, Florida, USA, May 2002. [16] A. Ko and B. Myers. Designing the Whyline: A debugging interface for asking questions about program failures. In Proceedings of the ACM Conference on Human Factors in Computing Systems, pages 151–158, Vienna, Austria, April 2004. [17] J. Lyle and M. Weiser. Automatic program bug location by program slicing. In Proceedings of the 2nd International Conference on Computers and Applications, pages 877–883, 1987. [18] R. Miller and B. Myers. Outlier finding: Focusing user attention on possible errors. In Proceedings of the ACM Symposium on User Interface Software and Technology, pages 81–90, Orlando, Florida, USA, November 2001.
361