An Empirical Study on the Design Effort of Web Applications∗ Luciano Baresi∗ , Sandro Morasca+ , and Paolo Paolini∗ (∗ ) Dipartimento di Elettronica e Informazione - Politecnico di Milano piazza Leonardo da Vinci, 32 - 20133 Milano (Italy)
[email protected],
[email protected]
(+ ) Dipartimento di Scienze Chimiche, Fisiche e Matematiche - Universit`a degli Studi dell’Insubria via Valleggio, 11 - 22100 Como (Italy)
[email protected]
Abstract We study the effort needed for designing Web applications from an empirical point of view. The design phase takes an important part of the overall effort needed to develop a Web application, since the use of tools can help automate the implementation phase. We carried out an empirical study with the students of an advanced university class that used W2000 as a Web application design technique. Our first goal was to compare the relative importance of each design activity. Second, we tried to assess the accuracy of a priori design effort predictions and the influence of some factors on the effort needed for each design activity. Third, we also studied the quality of the designs obtained. Keywords: Web design, Web metrics, W2000, Empirical Software Engineering
1. Introduction In the last few years Web applications have been evolving from simple sites to fully distributed applications [2]. Sites were mainly aids to advertise products, institutions, and events. Nowadays applications let the user play an active role and are the key component to run the business of several companies. In addition to their evolution, which would be enough to motivate a different attitude towards developing these applications, the time-to-market is imposing even faster development processes. The ”code&fix” approach used by Web gurus in the early days is not good enough any longer. A more structured development process should be the base to ∗ This work has been partially supported by the ESERNET (IST-200028754) and UWA (IST-2000-25131) EC-IST Projects.
develop quality applications on an industrial scale. Among the different aspects that the process should cover, we must take into account the capability of predicting the complexity of the to-be-developed applications. This would help both shorten the development process and better allocate required resources. In this paper, we illustrate an experimental study on the effort for designing Web applications, mainly its underlying site. We involved the students of an advanced university class on modeling Web applications to help us evaluate the design effort and the relationships with the used notation, tools, and designers’ expertise. The subjects received the specifications of a pilot application and were asked to model it with W2000 [1], the modeling notation specific to Web applications developed at Politecnico di Milano. We also asked them to fill out a questionnaire before starting the design, to set their expertise and make them estimate the effort required during the various activities of the design phase. The subjects also filled out another questionnaire while completing the model to measure directly the actual effort. Our experimental study is an exploratory one, and has a number of goals. Our first goal was to compare the relative importance of each design activity. The idea is that the knowledge of the ranking in effort among the design activities may help (1) identify possible improvement points in the design process and (2) better plan the design phase. Second, we wanted to assess the usefulness of the subjects’ estimates in predicting the actual effort for the design phases. We also investigated factors that may influence the estimated and actual effort for each design activity. Third, we also studied the quality of the designs obtained and checked if there was any correlation between the subjects’ self-assessment and the grades given by the instructor.
Being an exploratory study, its main objective is to identify hypotheses that deserve further attention, and not to confirm a well-established theory. Despite the growing importance of Web applications, the state of the art of empirical studies in effort estimation of Web applications is still very preliminary, due to their relative novelty. For instance, papers [5, 6] illustrate two case studies on the evaluation of the development of 76 and 37 applications by using length and complexity metrics in Ordinary Least Square prediction models. The rest of this paper is organized as follows. Section 2 briefly introduces W2000 to let readers understand the modeling features supplied to students. Section 3 describes the experimental setting and the hypotheses we investigated. Section 4 presents and discusses the results we obtained. Finally, Section 5 concludes the paper and summarizes our future work.
2. W2000 W2000 [1] is the latest evolution of HDM (Hypermedia Design Model, [4]). It extends the original proposal according to two main directions. Since Web applications are not read-only information repository anymore, roughly speaking, W2000 lets the user specify operations to add, delete, and modify stored data. Moreover, the whole extended notation comes with a UML-like ([3]) concrete syntax to better emphasize the similarities with object-oriented languages and supply users with a standard way to design their models. In this paper, we do not use its newer modeling features, but we use W2000 as specification tool for conventional Web sites. According to this use, W2000 comprises three main models1 : • The Information model specifies the contents (data) available to the user (hyperbase) and how the user can access it (access structures). • The Navigation model rearranges the contents into chunks suitable for letting the user navigate through them and supplies the links among these elements. • The Presentation model organizes the outcome from the navigation design into pages and links that are visible to the user. Entities, the key element of the hyperbase, render data of interest as conceptual aggregations. They can be single entities, that is, ad-hoc singleton information elements, or entity types, which define templates in the same way classes do for objects. For example, if we think of an e-library, a 1 In
this paper we comply with the OMG jargon, where a model defines a view on the whole specification.
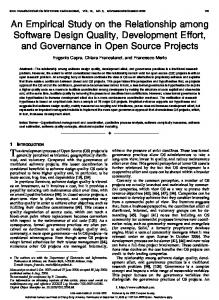
typical single entity is the one that defines the information to be displayed in the first page to present the site; book and author would be other obvious entity types (Figure 1(a)). Entities, the key element of the hyperbase, render data of interest as conceptual aggregations. They can be single entities, that is, ad-hoc singleton information elements, or entity types, which define templates in the same way classes do for objects. For example, if we think of an e-library, a typical single entity is the one that defines the information to be displayed in the first page to present the site; book and author would be other obvious entity types (Figure 1(a)). Entities can be organized in generalization hierarchies and are specified through sets of components, which are pure organizational devices for grouping the contents of an entity into meaningful chunks. Components can further be decomposed in sub-components, but the actual contents can be associated with leaf nodes only. The result is a part-of hierarchy with an entity as root. In the example in Figure 1(a), a book could be defined through two components: one for the editorial information (title, author, publisher, price), and one for the summary. The contents of (leaf) components is specified in terms of slots, i.e., the attributes that define the primitive information elements. Again, the slots of Editorial Info components could be: title, author name, publisher name, number of pages, publication year, price, but also the thumbnail picture of the book and maybe a small picture of the author. Slots are not shown when we think of in-the-large specifications, since we define here only the overall structures of our models, but must be specified in in-the-small specifications2 . Slots are grouped in segments to foresee how the contents will be ”consumed” by the user. For example a visual segment could comprise all those slots that must be displayed each time a book is presented in a single page. Notice that different slots could be used in different circumstances. The relationships among entities are specified through semantic associations. They connect two entities to create the ”infrastructure” for a possible navigation path, which has to be further specified in the navigation model. For example, a semantic association could be defined between author and book to trace who wrote what (Figure 1(a)). This means also that it will be possible to navigate from the page of a given author to the list of all his or her books. Semantic associations have also proper, local, information, called association centers, which contain data to specify how to represent both single target elements, in a concise way, and the whole group of target elements that relate to the same source. For example, the center of the previous semantic association would contain all slots (preview segment) to render a single book in the page that lists all the 2 A similar distinction between in-the-large and in-the-small specifications applies to all W2000 models. Roughly we can say that the former identify the structure while the latter add low-level details.
Book
Author
Summary Editorial Info
(a) Hyperbase Model
byTopicNode
Edit Info Node
Author Info Node
Summary Node
(c) Navigation Model Book Page Logo
byTopic Center Book
BooksByTopic
Book Section
Summary Unit
(b) Access structure Model
Ed Info Unit
(d) Presentation Model
Figure 1. Excerpts of a simple W2000 model
Figure 1. Excerpts of a simple W2000 model
they could be organized by topic (the collection booksByTopic of Figure 1(b)) to browse through all available books ordered topic. Otherwise, they books written by an author, but alsobyinformation to characcould be organized by publisher, leading to the terize the page itself as a whole, say a brief introduction to collection booksByPublisher, or there could be a the author’s collection work. booksByAuthor to list all books according to the alphabetical order of their authors. Each collection Access structures are defined by organizing entities in has a center, which, similarly to association centers, collections, i.e., sets of information objects. A collection defines how to concisely represent the elements in the provides thecollection user with a way to explore (once more, we couldthe useapplication’s the preview contents. For example, besides accessing books by navsegment associated with the collection’s contents). model reshapes the elements in the igating fromThe theNavigation page dedicated to the author, they could to specify booksByTopic the actual information be organizedprevious by topicmodel (the collection of Figinformation is organized in atomic units, ure 1(b)) to chunks. browseThe through all available books ordered by called nodes: They do not define new contents, but topic. Otherwise, they could be organized by association, publisher, come from entity components, semantic leading to the booksByPublisher, could andcollection collection centers. They contain or the there slots associatedbooksByAuthor with the information they render. The be a collection to listelements all books according to simplest approach that components, associationhas centhe alphabetical order of theiris authors. Each collection a ters and collection centers become nodes, but more center, which, similarly to association centers, defines how sophisticated navigation models could require a finer to conciselygranularity; represent thus the elements the collection (once informationin elements could be renmore, we could the preview segment associated with the dereduse through several nodes. nodes are linked through a directed accessibility collection’s Two contents). relationship to specify that the user can navigate from The Navigation model the Inelements in the prethe source to thereshapes target node. our e-library (Figure
vious model to specify the actual information chunks. The information is organized in atomic units, called nodes: They do not define new contents, but come from entity components, semantic association, and collection centers. They contain the slots associated with the information elements they render. The simplest approach is that components, association centers and collection centers become nodes, but more sophisticated navigation models could require a finer granularity; thus information elements could be rendered through several nodes.
1(c)), we could define a byTopic Node to render the collection; it would become the starting point to move to the books by are means of Edit Info Nodes. From these Two nodes linked through a directed accessibility renodes, we could browse to the author info (Author Info lationship to specify that the user can navigate from the Node) and the summary (Summary Node). source to the target node. In our e-library (Figure 1(c)), Nodes exist in the context of a navigation cluster that we could define a byTopicNode to render the collection; groups nodes and accessibility relationships to foster andwould facilitate the navigation amongpoint data (nodes). it become the starting to moveFor to the books example, clusters originate different by meansdifferent of EditInfoNodes. Fromfrom these nodes, we could collections of the same elements. The next element, browse to the author info (AuthorInfoNode) and the sumand thus the instance of the accessibility relationship mary (SummaryNode). that should be traversed, could be different if books Nodes in the of aClusters navigation were orderedexist by author or context by publisher. can be cluster that nested and can be characterized according to groups nodes andfurther accessibility relationships to foster and the kind of the information they among render: data (nodes). For example, facilitate navigation • Structural Clusters consist from of all the nodes derived different clusters originate different collections of the from entity components; same elements. The next element, and thus the instance of • Semantic Clusters comprise all nodes that come the accessibility relationship that should be traversed, could from sources, targets and centers of semantic assobe different ciations; if books were ordered by author or by publisher. Clusters can be nestedcomprise and canallbenodes further ac• Collection Clusters thatcharacterized come from to members andof centers of collections; cording the kind information they render: In the simplest case, we could skip the presentation • Structural clusters consist of all the nodes derived model and use the navigation model for this purpose. from entity components; The underlying assumption is that the application has
• Semantic clusters comprise all nodes that come from sources, targets and centers of semantic associations; • Collection clusters comprise all nodes that come from members and centers of collections; In the simplest case, we could skip the presentation model and use the navigation model for this purpose. The underlying assumption is that the application has been conceived for a single and specific channel and the
identity is the mapping function between navigation and presentation. If we wanted a more sophisticated presentation model, presentation units are the smallest granules at this level. They can either come from nodes or add new contents that is defined at presentation level only for aesthetic/communication purposes. For example, the logo of the e-library does not need to be defined at the information level; it could simply be defined here. A section is a set of presentation units derived from nodes that belong to the same cluster. A page groups sections, even if they are not semantically related, from which it inherits links and navigation features. Presentation units, sections, and pages can either be singleton ad-hoc elements or define types that can be instantiated as many times as necessary. These elements can also be sources or targets of presentation links, that is, a connection between two presentation elements to enable the navigation between them. According to the aforementioned concepts, we can further classify the links in a page as: • Focus links to remain in the same page, but moving the page focus from a unit to another; • Intra-page links to navigate between instances of the same page type; • Page links to navigate between instances of different page types. Figure 1(d) gives an excerpt of the pages for the elibrary: Books are rendered to users through pages (BookPage) that comprise the library logo – added in this model – and a section with all information about books. The section itself contains the editorial information (EdInfoUnit) and the summary (SummaryUnit).
3
Experimental Setting
The experiment documented in this paper was carried out at the Politecnico di Milano with students attending a class on how to design and implement advanced Web applications. They were taught to design their applications with W2000 and then implement them with the many available technologies. Since they were completely new to W2000, the experiment was not only aimed at measuring the design effort, but also – implicitly – the learning curve for W2000. The experiment started with assigning the projects to the students. Roughly, all students were asked to work on the same project, that is, a hypothetical e-commerce application; what changed from project to project was the application domain: books, CDs, groceries, etc. After reading the requirements, which were written in an informal style, we asked the students to fill out a questionnaire to:
• Acquire information on their general proficiency in computer-science-related college courses, • Acquire information on their expertise on Web technologies and design methods, and • Make them estimate the overall design effort, trying to split it according to the main models required by W2000. We asked them also to fill a second questionnaire while completing their homework to report the actual effort spent in the different phases/models), list the tools they used3 , and self-evaluate the quality of their work.
4
Results
Our experimental study is an exploratory one, rather than a confirmatory one. We investigated a number of experimental hypotheses that seemed likely to be true based on our beliefs and knowledge about the W2000 notation, the subjects’ skills, and the steps of the design process used. Our main goals were related to discovering • Which of these hypotheses were supported by empirical evidence in the context of our study and deserve further investigations; • Which were not, and should therefore be either revisited (there might have been some reason why these hypotheses were not true in our experimental setting), or not investigated any longer (their likelihood is so small that they are probably not true in general). We believe that it would be much too early to carry out a confirmatory study. As explained in the Introduction, the body of knowledge available in the literature about the effort related to developing Web applications, and especially the design phase, is very limited. Therefore, we report on both the hypotheses that our study confirmed and the hypotheses that were not supported by our study, so that our study can be taken as a starting point for future experimental activities. As a first step in each of our data analyses, we checked the data points and we removed those that appeared to be corrupted, or clearly incorrect, or for which there was missing information, e.g., either the value of the independent variable or the value of the dependent variable was missing. As a second step in each data analysis, we carried out a very careful outlier analysis, i.e., we removed those few data points that were much too ”far” from the others. This is a standard data analysis activity: it is carried out to 3 It must be noticed that currently W2000 is not supported by any special-purpose modeling tool. Users are free to use what they prefer, but this could highly impact the quality and spent effort.
remove those few points that may unduly bias the results. The removal of outliers is absolutely necessary especially in exploratory studies like the one documented in this paper because of the current stage of quantitative knowledge on Web applications. We now report on the experimental hypotheses we checked in our study and the results we obtained. The hypotheses we describe below are the so-called ”alternative hypotheses” in the test of hypotheses. For brevity’s sake, we do not report the so-called ”null hypotheses,” which can be obtained as the logical negation of the alternative hypotheses. The presentation of our experimental results is organized as follows: • Rationale and illustration of our hypotheses, • Experimental results, • Discussion. Our data analyses can be classified in two categories: (1) analyses related to the comparisons of distributions and (2) analyses related to correlations between random variables. 1. When comparing two distributions, we use the following statistics to illustrate the results: • N , the number of data points of the distribution, • M , the median of the distribution, • n, the mean value of the distribution,
• σ, the standard deviations of the regression coefficients; • p, which is the statistical significance of each independent variable X in the OLS model: given an independent variable X, its p-value provides an idea of the probability that X has an impact on the dependent variable Y by chance, so the smaller the value of the p-value, the more likely that X really has an impact on Y ; it is usual to consider statistically significant the impact on Y of those independent variables X for which p < 0.05, i.e., there is less than 5% probability that they have an impact on Y by chance. We now report on the hypotheses we studied. However, in our study, we had to exclude the effort related to the presentation part, since few respondents provided data for the actual presentation effort. At any rate, as explained in Section 2, a presentation model is not always needed, unless a sophisticated kind of presentation is required. Thus, this exclusion may not have exceedingly biased our results.
Actual Information Effort vs. Actual Navigation Effort: distributions Rationale We wanted to identify the model that takes the largest amount of time to be designed in general and for each respondent. Thus, we checked the following hypothesis.
• σ, the standard deviation of the distribution,
• R2 , which measures the goodness-of-fit of the model as the percentage of variance that is explained by the model;
Hypothesis 1 The median of the actual effort related to the information model (ActInfoEff ) is higher than the median of the actual effort related to the navigation model (ActNavEff ). In this data analysis and the following ones on the comparison of distributions, we used the median and not the mean because we wanted to use statistics that were less sensitive to possible data approximations in the data provided by the students. As a consequence, we stayed on the safe side, and we used statistical tests (known as ”nonparametric” tests) that do not depend on any specific hypotheses on the data distributions. These tests are less powerful than those (known as ”parametric” tests) that we could have used with the means of the distributions, i.e., it is less likely to show that a hypothesis is statistically significant with a non-parametric test than with a parametric test. At any rate, we would like to note that all of the following results would have been obtained by stating the hypotheses in terms of the means and by using parametric tests.
• E, the estimates of the regression coefficients, one for each independent variable X in the model plus one for the intercept;
Results The following table summarizes the statistics of our results. We used 49 data points, since we had 49 re-
• p, the statistical significance (p-value) of the hypothesis according to which the median of one of the distributions is greater than the median of the other distribution. 2. We used Ordinary Least Squares (OLS) to find out possible correlations among independent and dependent variables. The following statistics are used to illustrate the experimental results on correlations: • N , the number of data points used to build the model; N changes from model to model because a different number of outliers are excluded from different models; this number provides an idea of the statistical basis on which our results are based;
would have been obtained by stating the hypotheses in terms of the means and by using parametric tests. Results Table 1 contains the statistics of our results. We used 49 data points, since we had 49 respondents for both ActInfoEff and ActNavEff. All the actual estimated spondents for both ActInfoEff and ActNavEff. All and the actual effort data data represent work work hours.hours. and estimated effort represent
Variables VariablesN ActInfoEff ActInfoEff 49 ActNavEff ActNavEff
NM
15 8
49
Mm 18.4 15 8 10.4
σ m 10.2 18.4 10.4 6.7
σp
p
10.2 6.7
< 0.0001