An End-User-Responsive Sensor Network Architecture for Hazardous Weather Detection, Prediction and Response Jim Kurose1,2, Eric Lyons1, David McLaughlin1,3, David Pepyne1, Brenda Philips1, David Westbrook1, and Michael Zink1,2 1
Center for Collaborative Adaptive Sensing of the Atmosphere 2 Department of Computer Science 3 Department of Electrical and Computer Engineering University of Massachusetts Amherst MA 10003 USA {
[email protected],
[email protected],
[email protected],
[email protected],
[email protected],
[email protected],
[email protected]}
Abstract. We present an architecture for a class of systems that perform distributed, collaborative, adaptive sensing (DCAS) of the atmosphere. Since the goal of these DCAS systems is to sense the atmosphere when and where the user needs are greatest, end-users naturally play the central role in determining how system resources (sensor targeting, computation, communication) are deployed. We describe the meteorological command and control components that lie at the heart of our testbed DCAS system, and provide timing measurements of component execution times. We then present a utility-based framework that determines how multiple end-user preferences are combined with policy considerations into utility functions that are used to allocate system resources in a manner that dynamically optimizes overall system performance. We also discuss open challenges in the networking and control of such enduser-driven systems. Keywords: Sensor networks, collaborative adaptive atmospheric sensing, enduser utility.
1 Introduction Over the past twenty years, the use of networked computing systems has evolved from being primarily general/multi-purpose in nature to often being highly specialized and highly mission-specific. Perhaps nowhere is this trend clearer than in the case of sensor networks [DDAS 2006, Chong 2003, Estrin 2002] – a combined sensing, communication, and computing infrastructure designed to measure, monitor, predict, and (in some cases) control a particular environment or process. Such missionspecific computing naturally implies an increased emphasis on the end-user – the raison d’etre for the system in the first place – and on tailoring and optimizing system operation to meet end-user-defined, application-specific goals. Although it is thus K. Cho and P. Jacquet (Eds.): AINTEC 2006, LNCS 4311, pp. 1 – 15, 2006. © Springer-Verlag Berlin Heidelberg 2006
2
J. Kurose et al.
important to engineer sensor network systems to meet these specific end-user needs and application scenarios, it is also important to avoid a highly-specialized “stovepipe” design that is difficult to evolve for use in new (or changed) application scenarios or end-user/application requirements. In this paper, we describe the software architecture for a sensor network system consisting of a relatively small number (tens) of low-power X-band radars that detect and predict hazardous weather via distributed, collaborative, adaptive sensing (DCAS) of the lowest few kilometers of the earth’s atmosphere. The architecture finds use in a variety of application scenarios including hazardous wind (e.g., tornado) and precipitation sensing, in both resource-rich and resource-challenged environments. Distributed refers to the use of a number of small radars, spaced close enough to “see” close to the ground in spite of the Earth’s curvature and avoid resolution degradation caused by radar beam spreading. Collaborative operation refers to the coordination (when advantageous) of the beams from multiple radars to view the same region in the atmosphere, thus achieving greater sensitivity, precision, and resolution than possible with a single radar. Adaptive refers to the ability of these radars and their associated computing and communications infrastructure to dynamically reconfigure in response to changing weather conditions and end-user needs. As part of our activities in the NSF Engineering Research Center for Collaborative Adaptive Sensing of the Atmosphere (CASA) [McLaughlin 2005, CASA 2006a], we have instantiated the DCAS paradigm in an operational testbed for hazardous wind sensing in southwestern Oklahoma, and have several additional DCAS systems under development [Donovan 2005b]. The goal of these DCAS systems is to sense the atmosphere when and where the user needs are greatest. Thus, user requirements naturally play the central role in determining how system resources (sensor targeting, computation, communication) are deployed at any given point in time. Our DCAS systems adopt a utility-based framework in which multiple end-user preferences are combined with policy considerations into utility functions that are used to allocate system resources in a manner that dynamically optimizes overall system performance. In this paper, we described the software architecture of our DCAS systems, focusing on the driving role of end-user considerations in system design and operation. We also discuss open challenges in the networking and control of such end-user-driven systems. The remainder of this paper is structured as follows. In section 2, we overview the DCAS software architecture, highlighting the crucial role played by the end users. In section 3, we discuss how end-user preferences and policy considerations are mapped to the utility functions that then determine how system resources are allocated. We discuss our experiences with initial end-user evaluations, and how these experiences have led to changes in our utility functions. In section 4 we discuss several open challenges in the networking area, focusing on those that arise from end-user considerations. Section 5 concludes this paper.
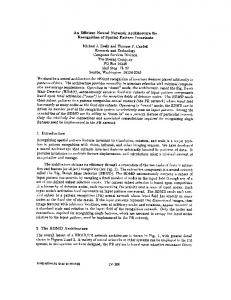
2 Overview of DCAS Software Architecture Figure 1 shows the overall software architecture of the meteorological command and control (MC&C) components that lie at the heart (or perhaps more appropriately, the
An End-User-Responsive Sensor Network Architecture
3
Fig. 1. Software architecture for meteorological command and control (MC&C)
“brains”) of our DCAS system. The operational version of the MC&C is currently centralized, but we are currently implementing a distributed version of the MC&C as well. The main system control loop divides into loosely-coupled upper and lower halves. In the upper loop, data is ingested from the remote radars, meteorological features are identified in the data, and higher-level meteorological features (e.g., wind rotation, wind shear and rotational divergence, areas of high precipitation) are posted on a feature repository, from which they (and the underlying radar data) are made available to end users. The shaded ovals in the feature-detection portion of the MC&C are the individual detection algorithms that detect specific features in the data. These modules are connected together by an event-based broadcast publication/subscribe mechanism known as a linear buffer [Hondl 2003] that notifies downstream modules when data or events are available for processing. The feature repository is a blackboard-like module [Jaganathan 1989] that allows data to be asynchronously written (posted) and read. The lower half of the control loop uses the posted features and end-user preferences and policy to identify areas of meteorological interest in the radars’ footprints (task generation) and then optimizes the configuration of each radar (i.e., the location and width of the sector within its footprint to be scanned), as discussed in detail in Section 3. The system operates on a 30-second “heartbeat,” with the upper control loop in Figure 1 (data ingest and feature detection) proceeding asynchronously from the lower control loop (generation of radar commands for the next 30-second heartbeat). During each heartbeat, data is ingested and processed in streaming mode. Δ seconds before the end of each heartbeat (a value of Δ equal to approximately 4 seconds is currently used in our testbed), command generation components begin their computation to determine how to best target the radars for the next 30-second heartbeat based on data currently posted in the feature repository. This temporal
4
J. Kurose et al.
decoupling of the upper and lower halves of the control loop avoids stalling the lower half of the control loop in the presence of late-arriving data (e.g., due to unanticipated network and processing delays elsewhere in the system). Thus, while latearriving data may affect the quality of the computed control (since the targeting decision is based on older data), it will not delay the generation of radar targeting commands. A heartbeat of 30 seconds was chosen given the coverage of each radar (a radius of approximately 30km), Fig. 2. Radar siting in southwestern OK, showing the timescale at which dual-Doppler regions meteorological features evolve, and the operating characteristics of the mechanically-scanned radars currently in our testbed. The value of Δ will clearly play an important role in how well the radar network is able to sense the environment. The smaller the value of Δ, the more recent the data that will be used to re-target the radars. We report on the measured runtimes of various system components below that indicate that a value of Δ of approximately 4 seconds is appropriate in our operational system. We have completed an initial four-radar testbed that covers a 7,000 square km region in southwestern Oklahoma, a region that receives an average of four tornado warnings and 53 thunderstorm warnings per year. Figure 2 shows the radar locations, including their dual Doppler (overlap) regions. Data is streamed from each of the four radars at up to 1 Mbps, over a pre-provisioned network with adequate capacity to handle this peak rate, to a central site where the MC&C operates. (Thus, in this resource-rich initial testbed, network concerns such as routing and congestion control are not of significant concern; we discuss networking challenges in resource-poor DCAS system in Section 4). The MC&C itself executes on a 3-node (3.2 GHz Intel CPU, 1 GB RAM) cluster with 4 TB of storage; the cluster can be easily scaled by adding additional processors if additional computing or storage resources are needed. The end-users of this testbed are the National Weather Service (NWS) Forecast Office in Norman, OK, a group of emergency managers who have jurisdictional authority within and upstream of the testbed area, several private sector entities, and CASA’s science researchers themselves. Given the soft-real-time nature of this system, it is crucial that the execution times of the various software components shown in Figure 1 fit well into the fundamental 30second heartbeat. Figure 3 shows the execution times of selected MC&C components: per-elevation execution times for data ingest, a peak echo detection algorithm, and task generation and optimization. These execution times were measured in our 4-node testbed during a period of time when several storm cells were moving through the testbed’s coverage area. The data ingest algorithm receives data in an elevation scan
An End-User-Responsive Sensor Network Architecture
5
from a radar (there may be several sequential elevation scans within one 30-second heartbeat), performs simple cleanup (thresholding) of the data, sequentially stores the reflectivity, wind-velocity and other data in separate files in a common format, and notifies the downstream detection modules of the availability of data via the broadcast pub/sub mechanism. The peak echo algorithm identifies the region of peak reflectivity within a radar’s footprint. Since the data ingest algorithm operates in a streaming manner, and since peak echo detection, task generation, and optimization components all execute in subsecond times, these execution times are relatively small with respect to the 30-second heartbeat interval. Execution times from other MC&C components (using emulated radar input data) have been report in [Zink 2005]. 4 0.7
3.5 0.6
3
seconds
seconds
0.5 0.4 0.3
2.5 2 1.5
0.2
1
0.1
0.5
0 0
20
40
60
80
100
120
0
140
0
iterations
10
20
30
40
50
iterations
(a)
(b)
300
runtime (msec)
250 Optimization
Task Generation
200 150 100 50 0 1
5
9 13 17 21 25 29 33 37 41 45 49 53 57 61 65 69 73 77 81 85 89 93 97 heartbeat
(c)
Fig. 3. Execution runtimes for (a) data ingest, (b) peak echo detection, and (c) task generation/ optimization
3 Responsiveness to End User Requirements Our discussion above has focussed on the overall DCAS software system architecture and software component runtimes within the 30-second heartbeat. We now turn our attention to the central aspect of DCAS control – determining where and how the radars should target their scans during a 30-second interval. This is the role of the task generation and optimization components of the MC&C and it is here that end-user considerations are of central concern. 3.1 The MC&C Equation In order to simplify our discussion below, we consider the “simpler” problem of determining only where the radars should focus their scanning, ignoring additional
6
J. Kurose et al.
considerations such as the most appropriate radar waveform to be employed, the pulse repetition frequency (PRF), and more. This simple setting will nonetheless allow us to illustrate the key end-user-related aspects of the MC&C. We define a radar configuration to be the set of sectors to be scanned by the radars during a 30-second interval. The MC&C takes a utility-based approach towards determining the optimal radar configuration for a particular interval, where (as we will see) utility is directly defined in terms of end-user requirements. Two sets of factors contribute to the utility of a particular radar configuration. The first set of factors is concerned with how well a particular portion of the atmosphere is sensed by a given radar configuration. The second set of factors is concerned with how important the scanned sectors are to the end users. The overall utility of a particular configuration combines these two considerations of “how well” and “how important.” Before specifying how utility is computed, let us first qualitatively discuss the factors that will come into consideration. The first set of factors is related to the quality of the data from the scanned sectors (“how well”): • Scan sector size. Each radar can be tasked to scan a sector with an arbitrary starting point and at any width from 60 degrees to 360 degrees during the 30second heartbeat. Scanning a smaller sector allows more sensing energy to be focussed into that sector, either by dwelling on each radial position for a longer period of time (than in the case of a wider scan) and hence obtaining more accurate estimates of sensed values [Donovan 2005a], or by scanning a larger number of elevations. The increased “quality” of sensed data within a narrowlyscanned sector must then be weighed against obtaining no data from those portions of the radar’s coverage that were not scanned during the heartbeat. • Coordination among radars. It is often advantageous to have two or more radars focus their scans on overlapping regions in the atmosphere, a so-called dual-Doppler region. One radar may be able to “see” that portion of the atmosphere better (e.g., due to less signal attenuation), and data from multiple radars allows for more accurate estimation of wind velocity vectors. Another benefit of radar coordination arises even when each meteorological feature is scanned by a single radar – when a particularly high utility feature can be scanned by more than one radar, the system can scan that feature with the radar that allows remaining radars to scan other meteorological features of next highest utility. The second set of factors is concerned with how important the scanned portions of the atmosphere are to the end-users: • Expressing the preferences of multiple end users. The initial end users in our Oklahoma testbed are (i) the National Weather Service (NWS) forecasters, both in the Norman, Oklahoma Forecast Office and in the NWS Warning Decision Training Branch which trains forecasters nationally, (ii) a group of emergency managers who have jurisdictional authority within and upstream of the test bed area, and (iii) CASA’s science researchers themselves. Different end users will derive different utility from a particular radar configuration. For example, an NWS forecast office may use 360 degree sweeps of DCAS radar data close to the ground to monitor the evolution of a storm to determine whether to issue a
An End-User-Responsive Sensor Network Architecture
7
tornado warning, while at the same time an emergency manager may require two collaborating radars to locate precisely the most intense part of a storm for public notification or for deploying weather spotters. A researcher initializing a numerical prediction model needs 360 degree scans at all elevations. Each of the end user groups must be able to express their relative preferences among different radar configurations, and these preferences must then be incorporated into system operation. • Policy: mediating among the conflicting scanning requests of different end users. The differing information requirements of different end users means that it may not be possible to satisfy the needs of all end users at the same time. If a given radar configuration is of particularly high utility to one group of users but of lower utility to another group of users, while a second configuration is of low utility to the first group of users but of high utility to the second group of users, the system must decide which of these two alternatives is preferable. That is, a policy mechanism must be defined for mediating among the conflicting scanning demands of different end-users. The above considerations give rise to the following optimization problem (which we refer to as the MC&C equation) that must be solved by the MC&C:
J=
∑U (t, k )Q(t, C )
max configurat ions , C
(1)
tasks , t
where: • t is the set of so-called tasks – meteorological features that are within the radars’ coverage areas and thus can potentially be scanned at time interval k. Examples of tasks include areas of wind rotation, areas of high reflectivity, and areas of wind shear. These tasks are created by the task-generation module shown in Figure 1, based on detected features posted in the feature repository. As we saw in Figure 3, the set of tasks in our testbed can be generated in less than a second by the task-generation module. • U(t,k) is the aggregate end-user utility of task t to the set of end users, and captures the “how important” aspect of utility. U(t,k) in turn is defined as: U (t , k ) =
∑w U g
g
(t , k )
groups , g
where g is the set of user groups, Ug(t,k) is the utility of task t at time interval k to user group g, and wg is the weight associated with user group g. In section 3.2 below, we discuss how Ug(t,k) is computed. wg is a value between 0 and 1, reflecting the relative priority of user group g with respect to other user groups. The values of wg are set by policy. Note that the architecture itself is policyneutral in that it does not prescribe values for wg but instead provides a mechanism for weighting the relative importance of different user groups. • Q(t,C) is the quality of the scanning of task t under radar configuration C, capturing the “how well” aspect of utility. Q(t,C) is a value between 0 and 1, with a value of 1 representing the highest quality possible. The details of the computation of Q(t,C) can be found in [Pepyne 2006]. We note here that for a particular task, t, the value of Q(t,C) (i) increases as the physical location
8
J. Kurose et al.
(center) of the task becomes closer to a radar (ii) increases as increasingly more of the physical extent of the task is covered by a radar in configuration C, and (iii) increases as function of the number of radars whose scans cover the task. Several comments are in order regarding the MC&C equation. First, note that the form of the MC&C equation involves a sum over all tasks, where the utility of each task has a quality component, Q(t,C) (reflecting “how well” the task is sensed by the radars in a particular configuration) and an end-user utility component, U(t,k) (reflecting how important that task is to the end users). The overall utility of a given task is the product of these two components. Rather than taking the product of these two components, an alternate approach would be to allow end-user utility itself to depend on the quality component, i.e., to define task utility under configuration C in the form U(t,k,Q(t,C)), rather than U(t,k)Q(t,C) as in Equation 1. This alternative formulation would have resulted in a significantly more complex optimization problem, since end-user utility would be a function of the scan quality of the configuration. Our separation of “how well” and “how important” into two independent considerations represents an architectural decision to separate lowerlevel, radar-specific, sensing considerations from higher-level end-user considerations. This also illustrates one way in which we have avoided building a stovepipe system. If a new set of radars, with new operating characteristics were to be used, we need only change Q(t,C). On the other hand, with a task utility of the form U(t,k,Q(t,C)), we would have to redefine end-user utility as well – a difficult and time-consuming task that requires numerous interactions with the end users, as we will see in Section 3.2. We emphasize, however, that both task quality and task importance are taken into account in the end-user utility calculation (through their product). Second, we note that while it appears that the optimization is considering each 30second heartbeat as an independent optimization problem, this is actually not the case. As we will see in section 3.2, users have specified not only what tasks they want scanned, but also how often different types of tasks need to be scanned. As we will see, a typical end-user rule has the form: “If a meteorological phenomena of type X is detected, then scan it with Y radars (when possible) at least once every Z heartbeats.” To implement this capability we keep track of the time-since-last-scanned for each task. If the time-since-last-scanned is less than the user-defined interval between scans (Z heartbeats in the previous sentence), then the task has a base utility value. If the time-since-last-scanned is greater than the user-defined interval, we scale (increase) the utility value Ug(t,k) of task t at each heartbeat until the task is eventually scanned. At this point, the task’s utility value is set to its base value, and the scaling process begins again. With this simple scheme, we implicitly solve what is otherwise a complex multistage optimization problem. [Manfredi 2006] examines a non-myopic multistage optimization formulation of the MC&C optimization problem. 3.2 End-User Utility
Given the importance of end-users in our DCAS systems, a crucial challenge is to define the end-user utility functions, Ug(t,k), in a manner that is consistent with the
An End-User-Responsive Sensor Network Architecture
9
preferences and the decision making process of each user group g. In order to do so, we conducted in-depth interviews, discussions, and table-top experiments (using simulated DCAS data) with our end-user groups. Eliciting and understanding user preferences, and then defining user utility functions is an iterative process. We illustrate this below by discussing not only the current set of rules that define how utility is computed, but also an earlier set of rules that were ultimately judged inadequate by our end users. We elicited preferences for DCAS data from three groups of users: NWS forecasters, emergency managers in Oklahoma, and CASA researchers. We were faced with the challenge of asking users for their preferences for data from a system that has only recently become operational, and that presents a very new way of visualizing radar data with sector scanning, rapid data updates, and high resolution. Because of this challenge, our focus has been on obtaining qualitative information from a smaller group of experts who provided input based on their use of current radar data and their best determination of how DCAS data would provide additional benefits. Let us consider a specific user group, NWS forecasters (including the forecast Office in Norman, Oklahoma and the NWS Warning Decision Training Branch which trains NWS forecasters across the US), to demonstrate how preferences were elicited and how these preferences impacted the evolution of our system design. As background, a primary task of NWS forecasters is to issue severe weather warnings for thunderstorms, tornados, and high winds for counties under their jurisdictional authority with the goal of saving lives and property. Among other tasks, NWS forecasters interact with emergency managers leading up to and during a severe weather event to communicate their weather expertise. In order to make a warning decision, forecasters create a conceptual model of developing weather events based on multiple sources of information: WSR-88D radar data [NOAA 2006], ground truth reports from storm spotters and the media, potential location/impact of the weather, on-going mesoscale (regional) analysis of weather, staffing and intuition. By looking for specific signatures and trends in base wind velocity and reflectivity data, forecasters use radar data to increase or reduce their confidence in an existing or potential warning decision. They analyze radar data by creating a “mental movie” of an evolving event using the closest radar to the phenomena of interest. End User Policy, V0 and V1. The initial set of rules we developed to define userbased utility, End User Policy V0, focused on the relative importance of specific detected weather features, such as tornados, mesocyclones, storm cells, and hail cores. Each user group, such as NWS forecasters, was asked to rank the relative importance of these weather features. Each weather feature was then assigned a utility (“how important”) value Ug(t,k) that depended only on the type of task being scanned (but not on the time-since-last-scanned). We then conducted a table-top experiment, a case study using a numerical storm simulation sampled at 3-kilometer spatial resolution, and showed it to the NWS-FO Norman to obtain feedback on End User Policy V0. We learned that the NWS warning decision process focused more on analyzing areas of uncertainty at regular intervals than on evaluating specific weather features, such as a mesocyclone. Based on this feedback, the following modifications were made to create End User Policy V1:
10
J. Kurose et al.
• Incorporation of interval-based scanning. User preferences for adaptive scanning are now expressed in terms of timed intervals (e.g., scan a severe storm at all elevations every 2.5 minutes) as well as the detection of weather features. At this stage, the NWS is more interested in scanning areas of interest at regular intervals, rather than in looking at specific weather features such as a mesocyclone. • Expansion of the definition of a storm cell. The definition of a storm’s extent by our weather-feature detection algorithms was judged to be too narrow for use by forecasters. In End User Policy V0, a storm cell was identified as an area of high reflectivity and therefore storm cell scans did not include the boundaries of the storm. We learned, however, that NWS forecasters are interested in looking at these boundaries (reflectivity gradients), in areas of lower reflectivity, to look for cues of how a storm may evolve or where new storms may develop. The stormcell detection algorithm in End User Policy V1, now includes areas of low reflectivity. • Introducing contiguous scans. Visualization and scanning strategies must address continuity of data so forecasters can create a “mental movie” of an evolving event. Version 0 produced sector scans that were too “jumpy” from one scan to the next and interrupted this mental movie. A second table-top experiment was conducted, again using a numerical storm simulation to obtain feedback on Version 1 of the policy. This version was acceptable to the expert group NWS forecasters. The next crucial step will be to obtain user feedback on the rules when actual data is generated from the Oklahoma Test bed. The End User Policy V1 rules are shown below in Table 1. There are rules for three user groups (NWS, researchers, and emergency response managers) and one default user group that requests that the lowest two elevation scans be performed at least once every 5 minutes. Of particular note in Table 1 are the columns labeled “Rule trigger” and “Sampling interval.” Some tasks are instantiated (triggered) only Table 1. End User Policy Rules, V1 Rules
Rule trigger
NWS N1 time N2 storm Researcher R1 rotation R2 reflectivity R2 velocity R3 time EMs E1 time E2 reflectivity over AOI E3 velocity over AOI OS O1 time
Sector Selection
Elevations
# radars
Contig.
Sampling interval
360 task size
lowest full volume
1 1
Yes Yes
1 / min 1 / 2.5 min
task size task size task size 360
full volume lowest two lowest two all 7 every 15 min
2+ 1 2+ 1
Yes Yes Yes No
1 / 30 sec 1 / min 1/ min 1/ 5 min
360 task size
lowest lowest
1 1
Yes Yes
1 / min 1 / min
task size
lowest
2+
Yes
1/ 2.5 min
360
lowest two
1
No
1 / 5 min
An End-User-Responsive Sensor Network Architecture
11
when a particular feature (storm, rotation, reflectivity, velocity) is detected in the coverage area, while other tasks (360 degree surveillance scans at one or more elevations) are triggered periodically. The sampling interval indicates the time-sincelast-scanned value discussed above. 3.3 Quantifying the Benefits of DCAS Versus Sit-and-Spin
Given the utility function in Equation 1, we can quantitatively evaluate the benefit of DCAS operation of radars, using overall system utility as our performance metric of interest. Our baseline for comparison is the traditional “sit-and-spin” (or surveillance) mode of operation in which each radar continuously performs 360 degree scans, independent of the meteorological features present in the coverage area. Because we can not operate DCAS and sit-and-spin meteorological sensing networks side-by-side over the same weather scenario, we have used an emulation environment (referred to as an observing system simulation experiment, OSSE, in the radar meteorological community [Lord 1997]) to quantify the utility gain realized by a DCAS system. The OSSE system consists of a simulation of the evolution of weather within a volume of the atmosphere over time, coupled with a radar emulator that computes the data produced by a simulated radar pointing its beam along a particular radial in the simulated atmosphere at a particular point in time. In this OSSE experiment, the 130km by 130km domain covered by our Oklahoma testbed was emulated at a grid resolution of 100m. A movie showing emulated storms passing through this coverage area during the OSSE emulation can be found at [CASA 2006b]. 1.4
1.2
utility
1
DCAS scan
0.8
sit-and-spin scan
0.6
0.4
0.2
0 1
8
15
22
29
36
43
50
57
64
71
78
85
92
99 106 113
time (heartbeat)
Fig. 4. Utility of DCAS scanning versus sit-and spin for an emulated OSSE experiment
Figure 4 shows the higher utility achieved under the optimal DCAS scan strategy versus the utility achieved under a sit-and-spin mode of operation for this OSSE scenario. While the initial results of Figure 4 are indeed encouraging, a fundamental question still remains – to what extent does the increased utility, as computed using the quantitative formulation in Section 3.2, result in an increased ability of the system’s end users to better detect, predict, understand, and respond to severe whether
12
J. Kurose et al.
events. The answer to this crucial question can only be answered once end users have the opportunity to view and use actual data from the test bed in their decision making. CASA is also planning to investigate alternate methods of eliciting and aggregating multiple user utilities, the value of DCAS data to users, and incorporation of socioeconomic variables into the End User Policy formulation using decision sciences methodologies.
4 Networking Challenges Ahead In previous sections, we have focussed on the overall DCAS software architecture and the crucial role played by end users. In this section we identify a number of networking challenges in resource-constrained DCAS systems. In most cases, the challenges we identify again arise as a result of the central role of end user. We note that our discussion below is selective rather than exhaustive, reflecting our own views on promising areas for research. To make our discussion concrete, we will consider an experimental “off the grid” DCAS testbed currently being developed for the western portion of Puerto Rico [Donovan 2005b]. The system consists of modified low-power 24-inch, 4kW marine magnetron radars (with a power consumption of 34W) connected via an 802.11 mesh network with (non-steerable) directional antennas. The system is resourceconstrained in that (i) all energy consumed must be harvested via solar panels and stored in batteries [Kansal 2004], (ii) communication link bandwidth may vary with changing meteorological conditions. In such a system, scarce resources – now including not only sensing resources (as in Section 3.1) but also power and network bandwidth – should be allocated to optimize an overall end-user defined utility function, in a manner similar to Equation 1. The principal challenge here is to develop distributed utility-maximizing routing, congestion control, and packet scheduling mechanisms that achieve a balance of energy expenditure among sensing (operating the radars), communication, and computation. This balance needs to be achieved not just locally at an individual node, but systematically, since sensor network nodes must interact and collaborate with each other to perform the sensor network’s task. We have recently developed a distributed algorithm for optimal joint allocation of energy between sensing and communication at each node to maximize the overall aggregate amount of information received at a central site for an off-the-grid meteorological sensing network [Zhang 2006]. A distributed gradient-based algorithm iteratively adjusts the per-node amount of energy allocated between sensing (gathering meteorological data) and communication (rate control, and routing) to reach the system-wide optimum. While we believe this work is an important first step, it must be extended in several directions. First, as noted in section 3 above, the ultimate goal should not be to deliver a maximum amount of data to a central site, but rather to deliver data that results in maximal system utility, in the sense of Equation 1. This is a subtle, but important difference. Also, with limited communication capabilities, it will likely be important to distribute the detection, task generation, and optimization capabilities of the MC&C.
An End-User-Responsive Sensor Network Architecture
13
We have argued above that application-specific, end-user concerns must play a crucial role in system optimization. This view naturally encompasses the notion of application-specific congestion control, including both packet-discard policies at intermediate nodes and source rate control. [Banka 2006a, Banka 2006b] presents a packet marking/deletion scheme for meteorological sensing networks. [Zhang 2006] addresses the problem of jointly optimizing source sensing and rate control (subject to power constraints), but with the goal of maximizing throughput rather than maximizing utility. Finally, we believe that techniques for networked distributed control that can deal with the delay, loss and other impairments attendant with networked control is an important area for research. [Liberatore 2006] has recently investigated the importance of predictable timing in networked control of sensors, developing buffering/playout mechanisms similar to those used for packetized audio or video to provide predictable sampling and application of control. In [Malouch 2006], we have studied the effects of different packet-scheduling mechanisms (aggregate FCFS of both radar data and control commands versus priority for control traffic) within the network. Our aim was to understand when it is (and when it is not) advantageous to separate the forwarding of control and data traffic in a meteorological sensing application. Our results show that while the separate handling of control and data results in a decrease in the round-trip control-loop delay, and a consequent increase in the number of reflectivity samples examined during each pass through the control loop in Figure 1, the gain in reflectivity estimate accuracy is relatively small, except at very high loads; we find a similar result for the performance of a meteorological tracking application as well. We show, however, that because sensing accuracy both improves and degrades slowly in the number of sensed values obtained, the system is robust in that it can still perform well in the case of severe overload, but only in the case that control messages receive priority and remain unaffected by data overload.
5 Conclusion In this paper, we have presented an architecture for a class of systems that perform distributed, collaborative, adaptive sensing (DCAS) of the atmosphere. Since the goal of these DCAS systems is to sense the atmosphere when and where the user needs are greatest, user requirements naturally play the central role in determining how system resources (sensor targeting, computation, communication) are deployed within such systems. We described the software components of the meteorological command and control (MC&C) software that lie at the heart of our testbed DCAS system, and provided timing measurements of component execution times. We then presented a utility-based framework that determines how multiple end-user preferences are combined with policy considerations into utility functions that are used to allocate system resources in a manner that dynamically optimizes overall system performance. We also discussed open challenges in the networking and control of such end-userdriven systems. We believe that emerging DCAS systems represent a step forward in the evolution of computing systems from being primarily general/multi-purpose in nature to often
14
J. Kurose et al.
being highly specialized and highly mission-specific. Such mission-specific computing naturally implies an increased emphasis on the end-user, and on tailoring and optimizing system operation to meet end-user, application-specific goals. It is our hope that the lessons learned in our development of DCAS systems – particularly with respect to our emphasis on end users - will provide a foundation for the understanding and further development of future user-centric sense-and-response systems. Acknowledgments. This work was supported in part by the National Science Foundation under grant EEC-0313747.
References [Banka 2006a] P. Lee, T. Banka, A.P. Jayasumana, and V. Chandrasekar, "Content-based Packet Marking for Application-Aware Processing in Overlay Networks,", 2006 IEEE Intl. Conf. on Local Computer Networks, Tampa, FL, Nov. 2006 [Banka 2006b] T. Banka, P. Lee, A.P. Jayasumana, J. Kurose, “An Architecture and a Programming Interface for Application-Aware Data Dissemination Using Overlay Networks,” submitted. [CASA 2006a] http://www.casa.umass.edu [CASA 2006b] Corner OSEE, http://gaia.cs.umass.edu/casa/cornerOSSE.mpg [Chong 2003] C. Chong; S. Kumar, "Sensor networks: Evolution, opportunities, and challenges," Proc. IEEE, August 2003. [DDAS 2006] Dynamic Data Driven Application Systems Workshop 2006, http://www.nsf.gov/cise/cns/dddas/2006_Workshop/ [Donovan 2005a] B. Donovan and D. J. McLaughlin, “Improved radar sensitivity through limited sector scanning: The DCAS approach,” Proc. of AMS Radar Meteorology, 2005. [Donovan 2005b] B. Donovan, D. J. McLaughlin, J. Kurose, V. Chandrasekar, "Principles and Design Considerations for Short-Range Energy Balanced Radar Networks", Proc. IGARSS05, Seoul, Republic of Korea. [Estrin 2002] D. Estrin, D. Culler, and K. Pister, "Connecting the Physical World with Pervasive Networks," IEEE Pervasive Computing, 1,1 (Jan.-March 2002). [Hondl 2003] K. Hondl, “Capabilities and Components of the Warning Decision and Support System – Integrated Information (WDSS-II), Proc. American Meteorological Society Annual Meeting, Jan. 2003, (Long Beach). [Jaganathan 1989] V. Jaganathan, R. Dodhiawala, L. Baum, Blackboard Architectures, Applications. Academic Press, 1989. [Kansal 2004] A. Kansal, D. Potter, and M. B. Srivastava, “Performance aware tasking for environmentally powered sensor networks,” Proc. ACM SIGMETRICS, 2004. [Liberatore 2006] V. Liberatore, “Integrated Play-Back, Sensing, and Networked Control, Proc. 2006 IEEE Infocom. [Lord 1997] Lord, S. J., E. Kalnay, R. Daley, G. D. Emmitt, and R. Atlas, 1997: Using OSSEs in the design of the future generation of integrated observing systems. Preprints, First Symp. Integrated Observation Systems, Amer. Meteor. Soc., 45–47. [Manfredi 2006] V. Manfredi et al., “A Comparison of Myopic and Non-Myopic Scanning Strategies in a DCAS Meteorological Sensing Network, in preparation. [Malouch 2006] N. Malouch, V. Manfredi, J. Kurose, C. Zhang, “On the Value of Separation of Control and Data in a Distributed Meteorological Sensing Network,” submitted.
An End-User-Responsive Sensor Network Architecture
15
[McLaughlin 2005] D. McLaughlin, V. Chandrasekar, K. Droegemeier, S. Frasier, J. Kurose, F. Junyent, B. Philips, S. Cruz-Pol, and J. Colom, “Distributed Collaborative Adaptive Sensing (DCAS) for Improved Detection, Understanding, and Prediction of Atmospheric Hazards,” 9th Symp. on Integrated Observing and Assimilation Systems for the Atmosphere, Oceans, and Land Surface, , 2005, San Diego, CA, American Meteorological Society. [NOAA 2006] National Oceanic and Atmospheric Administration, “Radar Resources,” http://www.ncdc.noaa.gov/oa/radar/radarresources.html [Pepyne 2006] D. Pepyne et al., “Defining and Optimizing Utility in NetRad, a Collaborative Adaptive Sensor Network for Hazardous Weather Detection,” CASA Technical Report. [Zhang 2006] C. Zhang, J. Kurose, Y. Liu, D. Towsley, M. Zink, “A Distributed Algorithm for Joint Sensing and Routing in Wireless Networks with Non-Steerable Directional Antennas,” IEEE Int. Conference on Network Protocols, Oct. 2006. [Zink 2005] M. Zink, D. Westbrook, S. Abdallah, B. Horling, V. Lakamraju, E. Lyons, V. Manfredi, J. Kurose, and K. Hondl, “Meteorological command and control: An end-to-end architecture for a hazardous weather detection sensor network,” ACM Mobisys Workshop on End-end Sense-and-Response Systems, 2005.