uated directly to extract useful properties related to languages. Table 1: Tonal ... Croatia, Bosnia & Herzegovina. Serbian ... Languages exhibiting tone properties.
An entropy-based approach for comparing prosodic properties in tonal and pitch accent languages Raymond W. M. Ng1 , Cheung-Chi Leung2 , Tan Lee1 , Bin Ma2 , Haizhou Li2,3 1
Department of Electronic Engineering, the Chinese University of Hong Kong, Hong Kong 2 Institute for Infocomm Research, Singapore 3 Department of Computer Science and Statistics, University of Eastern Finland, Finland {wmng,tanlee}@ee.cuhk.edu.hk, {ccleung,mabin,hli}@i2r.a-star.edu.sg
Abstract Our previous work shows strong prosodic characteristics are present in tonal and pitch accent languages leading to better performance in detecting these languages. This study uses an entropy-based approach to analyze prosodic features for effective modeling. 17 tonal or pitch accent languages, including a number of under-resourced languages in Africa, are studied. Prosodic trigrams are rated as either strong, moderate or weak according to the language-specific information they contain. The three-level rating helps to find the most efficient prosodic trigrams for language recognition. The feature inventory is reduced by 80% while performance degradation is acceptable. Important prosodic attributes found by analysis reflect the linguistic facts in different languages in nice manners. With this analysis method, selection to an expanded prosodic feature inventory can be done to explore better performance in detecting non-tonal languages. Index Terms: Language recognition, entropy, tonal languages, pitch accent languages, under-resourced languages
1. Introduction In a typical task of spoken language recognition, an automatic system decides whether a hypothesized language is present in the designated spoken utterance [1]. In related researches, relatively less attention has been given to the use of prosodic information, although prosodic features have been proved to be useful in several studies [2][3][4]. In our previous work, we used a set of prosodic features with different normalization methods for spoken language recognition [5]. On top of a phonotactic baseline system, we found prosodic features provide more obvious improvements in recognizing tonal languages [2]. It is unclear how recognition of tonal languages actually benefits from prosodic features. If there is a feature rating scheme, effective prosodic features can be found. Feature dimension can be reduced and recognition performance may be further improved. Understanding the prosodic characteristics of tonal languages is important in many aspects. Besides language, dialect or speaker style identification, it can enhance the quality and naturalness of synthetic speech [6]. It can also enrich the understanding to different languages. Because many tonal languages are under-resourced for corpus linguistic studies [6], relevant research efforts are sporadic. A large corpus consisting of radio programmes in different languages is made available in 2009 [1]. It is used in this study to infer some universal knowledge on the prosodic characteristics of different tonal languages. In this study, the surface forms of prosodic features are evaluated directly to extract useful properties related to languages.
Table 1: Tonal and pitch accent languages in this study Continent Language Family
Language (Abbreviation)
Africa
Kinyarwanda/ Kirundi (KNKR) Ndebele (NDEB) Shona (SHON) Hausa (HAUS) Oromo (OROM) Somali (SOMA)
Bantu
Chadic Cushitic Europe
Asia∗
∗ The
South Slavic Bosnian (BOSN) Croatian (CROA) Serbian (SERB) Cantonese (CANT) Mandarin (MAND) Tibetan (TIBE) Burmese (BURM) Laotian (LAOT) Thai (THAI) Vietnamese (VIET) Korean (KORE)
Area spoken Rwanda, Brundi Zimbabwe Zimbabwe, Mozambique Niger, northern Nigeria Ethiopia Somalia Bosnia & Herzegovina, Kosovo Croatia, Bosnia & Herzegovina Serbia, Montenegro, Bosnia & Herzegovina Southern China China, Taiwan, Singapore Tibet Burma Laos Thailand Vietnam Korean
language classification of many Asian languages are debated and thus they are not included.
Analyses in this approach are often done automatically, thus they are practical and technical for large amount of data [4][7]. Apart from direct and automatic modeling on the surface forms, comparisons among different languages in theoretical frameworks also yield useful knowledge regarding tones and accents [8][9][10][11]. Perceptual studies belong to another approach, which draw conclusions on the prosodic characteristics of languages detected by human [12]. In the following, an entropy-based metric evaluates the surface forms of prosodic features in different languages. An introduction of target languages is given in Section 2. Section 3 describes the extraction from raw data to prosodic attributes and prosodic trigrams. They are evaluated and rated with the entropy-based metric introduced in Section 4. The rating scheme is applied in a language recognition test in Section 5. In Section 6 some prosodic properties of languages are elaborated.
2. Languages exhibiting tone properties Tonal languages are those in which an indication of pitch enters into the lexical realization of at least some morphemes [8]. Typical examples of tonal languages in east Asia are Cantonese, Laotian, Mandarin, Thai, Tibetan and Vietnamese. In subSaharan Africa, many languages are tonal [9]. For instance, the Bantu languages of Ndebele and Shona, and the Cushitic languages of Somali and Oromo. Bosnian, Croatian, Serbian and some dialects of Korean fall under the somewhat elusive type of pitch accent languages, in which some pitch related properties serve a lexical function [10]. Both tonal and pitch accent languages will be investigated in this study. There are 17 such
languages (Table 1), including a number of languages that are less studied or under-resourced. The automatic analyses in this study are mostly statistical tests. By looking at the distributions in different prosodic classes, which are biased to different languages, prosodic properties of languages can be inferred. While we will make reference to linguistic facts, it is not our intention to try to prove or disprove these facts for two reasons. First, the statistical data on surface prosodic representations does not bring us to the underlying forms for theoretic arguments. Second, this study puts more emphasis on the cross-lingual comparison in particular prosodic features. The detailed prosodic structure in a language or a language type will not be discussed.
3. Data and prosodic features The corpus used in this experiment comes from the Voice of America (VOA) narrowband (telephone bandwidth) radio broadcast programme collection, which comes as a training data set in NIST language recognition evaluation (LRE) 2009 [1]. A front-end speech / music segmentation is carried out to remove non-speech components. To eliminate noisy data to the greatest extent, a visual inspection to the waveform of all data is carried out to remove the music segments failed to be detected automatically. Some English teaching programmes, which have atypical speech rhythms, are also detected manually and discarded. At least 100 minutes of speech, divided into short segments of 30 seconds, are secured for every language. 3.1. Prosodic attributes Because many prosodic attributes are syllable-based, automatic syllabification is carried out to obtain pseudosyllables in speech. We follow an approach of peak-picking syllabification [2], which makes use of the intensity peak to obtain the location of a syllable nucleus, as well as a contour measurement for F0 and intensity for every pseudo-syllable. Prosodic properties in F0, intensity and duration are derived from the F0 contours, the intensity contours and the temporal separations between pseudosyllables. In previous studies, we came up with tens of prosodic attributes. These attributes fall into five types: F0, intensity, nuclei separation, residual F0 and F0 gradient but differ in measurements and normalization methods. In the following, one typical measurement and normalization method will be chosen for each feature type to form five attributes for latter discussion. A comprehensive description of prosodic attributes can be found in [2] and [5]. F0 attribute is the frame-based measurement at a pseudosyllabic nucleus. An F0 attribute is normalized by mean subtraction, using all measurement points on the contour of the current syllable, the left and the right syllable. This kind of normalized feature is referred to as unbiased (UB) features hereinafter. Intensity attribute is also frame-based measurement at a pseudosyllabic nucleus. An intensity attribute is first normalized by the UB approach, then divided by the standard deviation derived from the three-syllable normalization window. This kind of normalized feature is referred to as Z-normalized (Z) features. Nuclei separation attribute is the separation between consecutively detected pseudosyllabic nuclei. Those separations across utterance breaks are removed. Normalization follows the UB approach. A longer normalization window is used. Its length is approximately 30 seconds, which is actually the length of a training file from one single speaker. For F0, intensity and nuclei separation, the above UB and Z features with the spec-
ified length of normalization windows are the optimal normalization methods among many as tested in [5]. Residual F0 attribute is an indication to the local fluctuation of syllable F0 with respect to the utterance intonation. A phrase curve is obtained from the linear regression performed on the F0 measurements of all syllables in an utterance. The attribute represents the deviation of nucleus F0 measurement from the phrase curve. F0 gradient is obtained by doing regression to the pseudosyllabic F0 contour in the first order. Normalization is not necessary for these two attributes. 3.2. Prosodic trigrams Prosodic attributes do not need very fine resolutions. Each of the above attributes is quantized into six discrete levels. Trigrams of prosodic attributes model the dynamic prosodic variations and encode more langauge-related information [3]. As a result, for each attribute there are 6 × 6 × 6 = 216 trigrams. Table 2 enumerates some unigram and trigram notations to be used hereinafter. Table 2: Notations for unigrams and selected trigrams Unigram notation: 1 2 Meaning: Very low Low
3 4 5 Mid low Mid high High
Trigram notation: 6-1-6 Meaning: Very high-Very low-Very high
6 Very high
2-2-4 Low-Low-Mid high
4. Rating prosodic trigrams The analysis of prosodic characteristics of different languages follows a statistical approach. A prosodic attribute is modeled by 63 prosodic trigrams. In certain prosodic trigrams we can often find an unbalanced distribution of languages. These prosodic trigrams carry language-specific information. Entropy, a fundamental tool in information theory, can be used to find these special prosodic trigrams [13]. Suppose we focus only on one of the target languages, l. The full data set is divided into two partitions: the true part l which belongs to language l and the imposter part ¬l which does not. Let f denote a prosodic trigram. To decide whether f carries significant information about l, we calculate the entropy. h(l|f ) = −P (l|f ) log P (l|f ) − P (¬l|f ) log (P (¬l|f )) (1) With the least information, assume training data are language balanced in 17 target languages, f , l are independent, the probability for finding language l in any prosodic trigram f is equal 1 (i.e P (l|f ) = P (l) = 17 ). If a prosodic trigram f is absent 1 and vice versa in a language l, h(l|f ) will be smaller than 17 1 if f is predominant in l. Let 17 here be the expected entropy. In our implementation, a training data set is used to derive the probability terms in Eq.(1). The values of expected entropy are derived separately for different target languages and different prosodic trigrams. Following the ratio of P (l) to P (¬l), we create 500 sets of randomly mutated langauge labels s1 , ... ,s500 . The expected entropy is given by E[h(s|f )], which is the average of h(s1 |f ), h(s2 |f ) up to h(s500 |f ). According to the amount of deviation of h(l|f ) from the expected entropy, the effectiveness of a prosodic class in detecting Table 3: Prosodic trigrams with different effectiveness |h(l|f ) − E[h(s|f )]| ∗
Weak Moderate < 0.7σ ∈ [0.7σ, 1.4σ]
Strong > 1.4σ
E[h(s|f )] is the expected entropy, σ is the standard deviation of h(s|f )
the language can be rated. Table 3 shows the three levels proposed to represent this derived effectiveness. The quantization thresholds 0.7σ and 1.4σ are chosen such that the three classes are almost evenly populated.
5. Language recognition experiments The three types of prosodic trigrams (strong, moderate and weak as shown in Table 3) are tested in a standard NIST task of language recognition evaluation (LRE). The task is language detection in which one determines whether a hypothesized language is spoken in the test utterances [1]. Speech data comes from the Voice of America radio programmes in 17 target languages. There are at least 90 training utterances and 80-100 testing utterances, each 30 seconds long, in every target language. Speaker diarization is performed on the training and testing speech to make sure no speaker overlap between the two sets. The speaker diarization algorithm depends on BIC hierarchical clustering on speakers [14]. Then, the training set is made language balanced. It is used to obtain the entropy-based rating of prosodic trigrams from 16 prosodic attributes. Apart from the five prosodic attributes introduced in Section 3.1, eleven more attributes are incorporated. They include variants of F0 regression, F0 span of pseudosyllables. Intensity regression and intensity span are also extracted similarly to their F0 counterparts. Two extra durational attributes are also used. Readers are referred to [5] for a detailed discussion of the attributes. After the prosodic trigrams are rated, four test conditions are applied to the training-testing data. Condition 1, 2, 3 refer to using weak, moderate and strong trigrams respectively. In these conditions, a fixed number of 700 trigrams are used. Condition 4 utilizes the full set of available features, consisting of 16 attributes×216 trigrams= 3456 prosodic trigrams. Trigrams in condition 1, 2, 3 are language specific, while those in condition 4 are not. Vector space model on the N-gram distributions of different trigrams achieves language recognition of 17 languages [2].
EER (%)
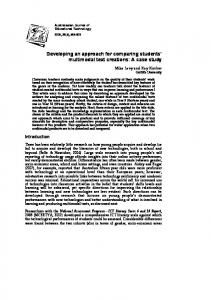
Figure 1 is a bar chart illustrating the equal error rates (EER) of detecting every target language, as well as an overall error for the four conditions. It is observed that condition 3 (strong trigrams) behaves consistently better than condition 2 (moderate trigrams). Condition 1 (weak trigrams) performs the worst. An 80% dimension reduction is achieved by condition 3 (700 trigrams) compared with condition 4 (3456 tirgrams). The difference in EER between the two conditions is about 2%. Condition 4
Condition 3
Condition 2
(All trigrams)
(Strong trigrams)
(Moderate trigrams) (Weak trigrams)
Condition 1
In this section we look into the strong prosodic trigrams labeled by the entropy-based rating. Particularly we focus on the five prosodic attributes described in Section 3.1. In calculating the entropy-based metric, the number of pseudosyllables are balanced to around 14000 in each language. Entropy measurements are calculated with Eq.(1). There are 18360 entropy-based metrics from 17 target languages, five prosodic attributes, each having 216 prosodic trigrams. They have to be analyzed systematically. The entropybased metrics for 216 trigrams of a prosodic attribute are integrated. Among the three types of trigrams (Table 3), only strong trigrams are considered. If the occurrences of all strong trigrams (conditioned by attribute and language) sum to more than 50% of the total number of pseudosyllables, this prosodic attribute is considered important. Table 4 shows the important prosodic attributes specific to the 17 tonal languages. Table 5 enumerates a small number of strong trigrams in every important prosodic attribute. The trigram notation is illustrated in Table 2. It should be noted that due to the effect of normalization, the “high” and “low” properties sometimes differ from the absolute levels of the measured attributes. Table 4: Important attributes] F0 (UB) Residual F0 F0 gradient Nuclei sep (UB) Intensity (z)
KNKR NDEB SHON HAUS OROM SOMA BOSN CROA SERB X X X X X X X X X X X X X X
F0 (UB) Residual F0 F0 gradient Nuclei sep (UB) Intensity (z)
CANT MAND TIBE BURM LAOT X X X X X X X X X X X X
]
THAI
VIET KORE X X X X
Important attributes contain > 50% of prosodic trigrams which are strong
Table 5: List of frequent [rare]] trigrams Prosodic attribute F0 (UB)
Target language
Tibetan Cantonese Mandarin Serbian Bosnian Residual F0 Tibetan Cantonese Mandarin Vietnamese F0 gradient Cantonese Mandarin Vietnamese Laotian Nuclei sep (UB) Kinyarwanda / Kirundi Korean Tibetan Serbian ∗ Assume equal ] Most statistics
Class Occurrence notation frequency
Class Occurrence notation frequency
1-6-1 1-6-1 6-1-6 4-4-4 4-4-3 1-6-1 1-6-1 6-1-6 6-1-6 1-1-1 1-1-1 1-6-1 [6-5-6] 1-1-1 1-1-1 3-3-3 4-4-4
6-1-6 6-1-6 1-6-1 [2-1-1] [6-6-6] 6-1-6 6-1-6 1-6-1 1-6-1 1-6-1 1-6-1 1-1-1
4.55% 3.38% 5.67% [0.03%]] [0.02%]] 5.84% 4.33% 6.80% 4.75% 2.82% 3.72% 2.32%
2-1-1 2-1-1 4-4-4 5-5-5
1.10% 1.16% 1.76% 1.75%
5.48% 4.85% 6.02% 1.63% 1.37% 6.65% 6.34% 7.59% 5.13% 2.93% 4.47% 2.79% [0.02%]] 1.24% 1.21% 1.92% 2.05%
1 quantization, the expected occurrence frequency for each trigram 216 < 0.5%. above belong to frequent trigrams, rare trigrams are square-bracketed [...]
28.91
6.1. F0 19.15 10.98 8.7
ALL
KORE VIET THAI LAOT BURM TIBE MAND CANT SERB CROA BOSN SOMA OROM HAUS SHON NDEB KNKR
35 30 25 20 15 10 5 0
6. Important prosodic attributes
Figure 1: EER of language recognition with different trigrams
Due to the similar nature, F0 (UB) and residual F0 will be considered together as an indication to H or L tones. As shown in Table 4, both F0 attributes are efficient in representing Cantonese and Mandarin. Table 5 shows the abundance of very high / very low tones in these languages. It is known that both Cantonese and Mandarin have a rich tonal inventory [11]. The presence of tones in the high / low region of F0 is believed to bring about such distribution bias. Other languages which demonstrate similar F0 statistics include Tibetan and Vietnamese (The proportion of strong trigrams for F0 (UB) in Vietnamese is
49.9%). Serbian and Bosnian, which are vaguely classified as pitch accent languages [10], have low occurrences of extreme (very high / very low) tones, and low occurrences of F0 jump across syllables. The predominance of “flat tone sequences” in these languages makes them stand out in Table 4. Oromo is the only African language with important F0 attributes. A relatively low occurrence of extreme tones are noted. It should be noted that F0 is normalized and the notation is a relative quantity. Also, the “high / low” class resides in a scale drawn from a pool of multi-lingual data. Thus our notation of “high / low” is somehow different from the conventional ones generally perceived in the context of a single language. 6.2. F0 gradient The F0 gradient attribute is the first-order regression coefficient of the pseudosyllabic contour. “Low” and “high” represent falling and rising contours respectively. In the data, consecutive falling and falling-rising sequences are common in Cantonese, Mandarin and Vietnamese. In Laotian, rising tones are fairly rare and all frequent trigrams consist of “low / very low” classes. Two Cushitic languages, Oromo and Somali, demonstrate relatively low occurrences of steeply falling tones.
long”. For the three Bantu languages, the ratio of “very long” penult syllables at phrase-final is 16.98%, 16.33% and 17.23% respectively. The higher proportion of “very long” syllables is attributed to the presence of penult stress in these languages.
7. Conclusion This paper presents an entropy-based approach for comparing the prosodic properties in tonal and pitch accent languages. Selection of strong prosodic trigrams helps to reduce the feature dimension in language recognition significantly, with acceptable degradation in performance. The language-specific strong prosodic trigrams are enumerated. Some of them are found to correlate the linguistic facts in different languages in nice manners. For instance, the rich tonal inventory in Asian languages and the penult stress in Bantu languages can both be traced in data analysis. It demonstrates an approach which enhances the language recognition performance and the understanding to languages at the same time. The analysis method proposed in this paper allows further expansion and selection of feature sets towards performance improvements in a general detection problem, such as langauge detection to non-tonal languages.
8. References
6.3. Duration Durational attributes are found to be representative to Kinyarwanda / Kirundi, Korean, Tibetan and Serbian. In these languages, steady rhythmic patterns are observed (Table 5). Recall the normalization scheme in Section 3, nuclei separation (UB) represents the relative speaking rate at the current pseudosyllable relative to a long-term average. Thus, the representative durational classes are the relatively fast and steady trigrams in Korean and Kinyarwanda / Kirundi, the moderate and steady trigrams in Tibetan, and the slow and steady trigrams in Serbian.
[1]
The 2009 NIST language recognition evaluation results. [Online]. Available: http://www.itl.nist.gov/iad/ mig/tests/lre/2009/lre09 eval results
[2]
R.W.M. Ng et al., “Prosodic attribute model for spoken language identification”, submitted to ICASSP 2010
[3]
J.-L. Rouas, “Automatic prosodic variations modeling for language and dialect discrimination,” IEEE Trans. Audio, Speech, and Language Processing, vol. 15, no. 6, pp. 1904-1911, 2007.
[4]
F. Biadsy and J. Hirschberg, “Using prosody and phonotactics in arabic dialect identification”, in Proc. Interspeech, pp. 208-211, 2009.
6.4. Intensity
[5]
R.W.M. Ng et al., “Analysis and selection of prosodic features for language identification,” in Proc. IALP, 2009.
[6]
D. Hirst, “Automatic analysis of prosody for multi-lingual speech corpora”, in E. Keller et al. (eds.) Improvements in speech synthesis, pp. 320-327, 2001.
[7]
E. Shriberg and A. Stolcke, “Direct modeling of prosody: an overview of applications in automatic speech processing”, in Proc. Speech Prosody, pp. 575-582, 2004.
[8]
Hyman, L. M., “Word-prosodic typology”, Phonology, 23: 225257, 2006.
[9]
Downing, L. J., “What african languages tell us about accent typology”, ZAS Papers in Linguistics, 37:101-136, 2004.
Intensity attributes are found to be representative to seven languages. In Serbian, Burmese and the two Bantu languages of Ndebele and Shona, the z-normalized intensity attribute varies little, predominated by the “low” and “mid low” types. In Tibetan, Bosnian and Vietnamese, higher occurrences of the “high” and “very high” types are noticed. Many languagespecific properties related to intensity are syntagmatic. Nevertheless, the attribute extraction scheme in this paper mainly models in the pseudosyllabic level. Further studies on this line are necessary. 6.5. Linguistic property of stress The linguistic property of stress is often represented by intensity or duration. It often follows that “one and only one” primary stress occurs in a lexical word [8]. An absence of stress in a syllable is not uncommon. Linguistic patterns like this could also be visualized from the statistical distribution of prosodic attributes. For example, in Bantu languages (including Kinyarwanda / Kirundi, Ndebele and Shona), the penultimate syllable of the word is most likely stressed. The most commonly reported phonetic correlate of penult stress is vowel lengthening, while the lengthening is the most noticeable when words are in phrase-final position [9]. We look at the nuclei separation (UB) attribute in all penultimate syllables before utterance breaks, and compare the relative abundance of the very long syllables. Across 17 languages, on the average 13.39% ± 1.92% of the penult syllables at phrase-final belong to the type “very
[10] S. Inkelas and D. Zec, “Serbo-Croatian pitch accent: the interaction of tone, stress, and intonation,” Language, vol. 64, no. 2, pp. 227-248, 1988. [11] M. Yip, “Tone in east asian languages,” in The Handbook of Phonological Theory, pp. 476-494. [12] F. Ramus and J. Mehler, “Language identification with suprasegmental cues: A study based on speech resynthesis”, in J. Acous. Soc. Ame., 105(1), pp. 512-521, 1999. [13] R. Battiti, “Using mutual information for selecting features in supervised neural net learning,” IEEE Trans. Neural Networks, vol. 5, no. 4, pp. 537-550, 1994. [14] X. Zhu et al. “Combining speaker identification and BIC for speaker diarization,” in Proc. Interspeech, pp. 2441-2444, 2005.