An Evaluation of Computer Based Color Vision Deficiency Test: Egypt as a study case Noura A. Semary
Hatem M. Marey
Faculty of Computers and Information Menofia University- Shebin El-Kom – Egypt Scientific Research Group in Egypt (SRGE) member http://egyptscience.net/
[email protected]
Ophthalmology department-Faculty of Medicine Menofia University- Shebin El-Kom - Egypt
[email protected]
Abstract— Color vision deficiency (CVD) refers to the inability to distinguish different dominant colors. CVD is an inherited defect that causes a damage or functionality weakness in one or more of color receptors in human eyes. There are a lot of well-known traditional clinical tests for CVD diagnosis. One of these tests is the Ishihara plates. In this paper, an evaluation study of using computerized diagnosis system compared to the traditional plates. In this study, 267 volunteers have been checked using both traditional ishihara plates and a computer system and LCD monitors. The study shows an identical diagnosis results which indicates that the new technologies can replace the traditional clinical tests or can be used for screening purpose in hard testing conditions. Keywords— Color Blindness, Color Vision Deficiency, CVD, Ishihara, Deutranopia, Protanopia, Tritanopia
I. INTRODUCTION Color vision is provided by three types of photoreceptors; sensitive to short (blue), medium (green), and long (red) wavelengths of the visible spectrum [1]. Color vision deficiency (CVD) could be congenital or acquired; the acquired form reflects a problem that occurred anywhere along the visual pathway from the photoreceptors to the cortex [2]. Congenital color deficiency exists due to a genetic disorder where the color deficient person could miss one or some pigments. The most common color anomalies happen due to the replacement of one class of color pigment by the class already represented in other cones. Congenital color deficiency could reach 6% - 10% of the male population [3]. There are four types of CVD: 1. Rod- Monochromacy (total color blindness): is also called Achromatopsia. Where, all color pigments are not functioning. People who suffer from rod monochromacy have no cones in their eyes and therefore, have no perception of color. Achromats who suffer from congenital achromatopsia perceive black, white, and shades of grey while those who suffer from acquired achromatopsia see in shades of grey because they can perceive the absence of color (having formerly had color vision). An achromat's vision is better at low-light levels because vision comes entirely from rods. 2. Cone-Monochromacy: where the subject has only one type of cone which may be those for red, green or blue color vision. There are three types of cone monochromacy named
according to the type of cone functioning. Those people have normal vision in daylight and low-light levels but cannot distinguish totally different colors. They could see only shades of only one color. 3. Dichromacy: where there is only one color pigment is defected. In this case the subject sees only shades of two colors. The most well-known types of dichromatopsia are: • Protanopia; where the long-wavelength receptor (Lcone) has been defected. In this case, the subject couldn’t see the shades of red and cyan as well. • Deutranopia; where the medium-wavelength receptor (M-cone) has been defected. In this case, the subject couldn’t see the shades of green and magenta as well. • Tritanopia; where the short-wavelength receptor (Scone) has been defected. In this case, the subject couldn’t see the shades of blue and yellow as well. Deutranopia and Protanopia are called red-green deficiency. Red-Green deficiency is the most common disorder in CVD cases. 4. Anomalous trichromacy: where there are three classes of cone pigments, but the peak sensitivity wavelengths of two of these classes lie closer together. Depending on the type of shifted cone, anomalous trichromacy is divided into protanomalous (having a shifted L cone), deuteranomalous (having a shifted M cone), and tritanomalous (having a shifted S cone) trichromacy. The protanomalous and deuteranomalous trichromats are X-chromosome-linked, genetic, anomalous trichromats, while the tritanomalous trichromats are mostly acquired. Up to 8% of the world’s male population exhibits a type of CVD. This is made up of 1% red-blind (protanope) and 1.1% green-blind (deuteranope) dichromats and of 1% redinsensitive (protanomolous) and 4.9% green-insensitive (deuteranomolous) trichromats. Only 0.4% of women have any sort of color vision deficiency. More than 80% of CVD subjects have one form of anomalous trichromacy, which demonstrates a milder and variable severity than those with dichromacy [4]. Due to abnormal cone characteristics, people with CVD may have great difficulty with color discrimination what affects
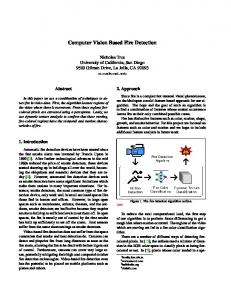
their social life and careers [5]. Figures 1 shows an example of a color image in normal, monochromat, tritanope, deuteranope, and protanope vision respectively.
Figure 2. Ishihara Color Vision Test Plates Brands
(a)
(b)
(c)
(d)
(e) 1
Figure 1. CVD simulation by Vischeck ; (a) Original color image, (b) Monocromacy vision, (c) Tritanopia vision, (d) Deutranopia vision and (e) Protanopia vision.
Different methods are used for diagnosing color vision deficiency including; Anomaloscope, arrangement tests, and Pseudoisochromatic plates which are the most popular and easy applicable screening test [4]. Different test books have significant variations, and the pigment technology, and age of the test could affect the result of the test [6]. Ishihara color test is the test most often used to diagnose type I, and II red green deficiencies. The characteristics of the responses may change with the severity of the defect [7]. The so-called Ishihara Color Test was first designed by Dr. Shinobu Ishihara and published in 1917 [8]. There are 3 common brands comes in 14, 24 and 38 plates (Figure 2). Each brand divided into two types of plates; numerical and graphical plates. The plates have a size of 12 × 12 cm2; each contains a circle filled with dots of random size and color, all having the same space between them. The sequence of the presented plates is fixed by the numbering. The first type of plates are numerical ones where there is a number written inside each circle with different colors (Figure 3 – left column). Normal color vision (NCV) peoples can extract the hidden number easily while CVD subjects couldn’t see the numbers at all or see exact wrong numbers according to their deficiency type and degree. A subject is classified as color deficient if less than or equal to 13 plates out of 21 numerical plates of 38-plates brand are detected incorrectly [8]. The other type designed for non-verbal subjects or peoples couldn’t read English numbers. This type of plates has a path (or more) connecting two points. The subject is asked to track this path by his finger. (Figure 3 - right column). 1
(a)
http://www.vischeck.com/ CVD online simulator and photoshop plugin.
(b)
(c)
(d)
(e)
(f) Figure 3. Ishihara CVD test Plates
Each brand consists of five types of plates [9]; •
Introductory plate– which is used for explaining the testing process, with pattern visible to everyone (e.g. Figure 3.a).
•
Transformation plate – with combination of two patterns –one readable to people with normal color vision, while the other being readable only to color blind (e.g. for figure 3.b, peoples with normal color vision should see number 8, while most CVD people should see 3),
•
Vanishing figure - with pattern easily read by people with normal color vision but unreadable for people with color vision impairment (e.g. Figure 3.d).
•
Hidden digit (Reverse plate) – with pattern readable only to color defectives (e.g. for figure 3.e, CVD peoples could read the number 5 which is not seen by normal vision people).
•
Qualitatively diagnostic - vanishing plate that also permits differentiation between protans and deutans. (e.g. in figure 3.f, deutan humans could see only 2 while protan humans could see only 6).
There are many different sets of pseudoisochromatic plates developed based on Ishihara's work, although they are not as widespread as the original [8]. The awareness about this type of disorder is very small especially in developing countries. The objective of this research is to evaluate the usage of computer systems for CVD screening. This study is depending only on ishihara plates screening, since it’s still the most common pseudoisochromatic test. This paper is organized after the introductory section as follows; a brief survey on related works will be presented in section 2. Section 3 covers the methodology of research experiment. Results will be discussed in section 4. Section 5 concludes this research. II.
LITERATURE REVIEW
Testing different visual functions such as; visual acuity, stereo vision, visual field, and color vision by means of computer software had been used. [10-14] Different tests had been used for screening of color vision deficiency, Cavanagh et al [12] mentioned that at least two approaches are accepted to detect color anomaly, Ishihara plates and the American optical pseudoisochromatic plates. Long and tuck [15] mentioned that other methods can be used, such as Nagelanomaloscope or the fransworth-Munsell 100Hue test. Pseudoisochromatic plates are the most popular and easily applicable for screening of color vision deficiency [4]. Several experiments [16-19] have shown a high reliability of Ishihara test to detect red green color deficiencies; however the printing technology, and the age of the test could affect the end result of the test 6.
Integration of tests of human sensory functions to computer can improve the quality of the results, reduces the required resources, and decrease the time to analyze the results [20, 21]. Since 80’s, there are many trials for simulating the ordinary clinical color vision tests [12, 22-28]. There have been a number of attempts to develop methods of color testing based on computer software. Pardo et al. [22-23] have presented a system of characterizing red–green color vision anomalies by simulating the Pickford–Nicholson type anomaloscope on a CRT monitor. In 2004 authors compared three different TFTLCD monitors for validating the usage LCD monitors in color vision research and diagnosis [24]. Also, Toufeeq [25] in 2004 has described an inexpensive computer based test for detection of color defect, also, Miyahara et al. [26] developed a computerized system to diagnose red green color defects using cathode ray tubes (CRT) screen. In 2007, Kuchenbecker et al. [27] has developed a German-language web-based color vision test with 25 pseudoisochromatic color plates based on the color plates of Velhagen and Broschmann and of Ishihara. As well as for Ishihara, Kapoor et al. [28], in 2013, have developed a computerized color vision testing as a replacement for Martin Lantern test These entire computer based tests for examination of color vision deficiency used CRT screens, with some technical restrictions, that not all perceivable colors can be adequately presented on a CRT monitor [29]. Derefeld and Hedin [30] investigated the spectral emission of colors on CRT monitors, and showed that certain shades of orange yellow and blue green colors cannot be represented on a monitor using CRT technology, this lead to the assumption that the spectral emission of Ishihara plates on a CRT monitor will be different from the spectral emission of the reflected day light on the paper plates. The aim of this work is to prove the ability of using computer systems with new display technologies for color vision screening. Although there are a lot of free screening sites on the web, there is no site or software considers the exact instructions of the clinical test. And there is no analytical study of their accuracy or validity. III. METHODOLOGY AND VOLUNTEERS A prospective non randomized non controlled study was conducted in the period from January 2012 to June 2013, where 267 volunteers from the Menofia University Campus students, staff members and workers were examined for red green color vision deficiency. Announcements were made using posters in different places of the campus besides electronic announcement in different internet social groups. The announcements highlight the aim of this screening test, how, and where the volunteer would be examined. A. Collection of volunteers’ data The Volunteers were asked to fill a registration form containing personal information; age, gender, residence, telephone number, history of previous CVD examination. Volunteers’ personal information besides their test results for both paper-based and computer-based tests were documented in a spread sheet.
B. Paper-based Ishihara test When performing a color vision test, the examiner had ensured that the subject is wearing the vision aids that he/she is normally required to wear, e.g. clear spectacles or contact lenses. Tinted lenses were not permitted since they alter color vision. The examiner also has been screened, assessed and classified as having normal color vision prior to testing others. A full CVD test has been performed using the first 21 numerical plates of Ishihara 38-plates brand. As noted in the instruction sheet of this brand [8], examinations were done in ordinary day light, with no direct sun exposure, plates were held 75 cm from the volunteer and tilted so that the plane of the paper is at right angle to the line of vision, the numerals seen on the plates were stated within 3 seconds, and recorded by the examiner. C. Computer-based Ishihara test The first 21 plates of a brand new Ishihara color vision deficiency examination plates were scanned using HP Deskjet 1050 J410 all in one scanner with 600 dpi resolution, and color adjustment enabled. The test program has been written in Matlab code and converted to an executable program. The test has been performed on Acer Veriton M 290 PC (Intel Core i3 Processor, 4GB-Ram). The test stars when the volunteer pushes the Start button of the first GUI screen, where the first plate appears to the volunteer with the instructions of using the test. After submitting the first answer (all cases should answer it correctly), next plate is displayed one after another for 3 seconds only (as stated in ishihara test instruction sheet [8])after which the image disappears and he records the numeral in the dedicated place, then he switches to the next plate. Figure 4 shows a screenshot of the program. At the end of the 21 plates, the program summarizes the test presenting which answer is correct and which is not, final score and the final diagnosis decision according to the instructions sheet.
temperature 6500 ° K, Color intensities of red, green, and blue respectively to 50%. Set in the "Control Panel" mode "true color" and "16 million colors". This target can be used to judge whether your monitor is adjusted for best viewing Set contrast to maximum and the brightness so that you can identify by black 11 degrees in the graphics in figure 5.a and 7 degrees (2 of white, 3 for gray and 2 for black) as in figure 5.b. Also, you should see red, green and blue graphics in figure 6 each of 2 different colors. If this is not the case, your settings are not correct, or your monitor is not suitable for accurate color reproduction.
(a)
(b) Figure 5. Contrast / Brigtness screen adjustment test
Figure 6. Color screen adjustment test
E. Statistical analysis . Validation of screening tests for CVD had been approached by Cochrone and Holland [31] in 1971, which was guided by simplicity, acceptance, and reliability of the procedure. This validation was mainly focused on analysis of sensitivity, and specificity of the test [13]. Sensitivity, Specificity, Positive predictive value, negative predictive value, and accuracy were calculated to the answers of the computerbased test using the paper-based Ishihara results as a reference. Sensitivity is defined as the proportion of volunteers classified as having CVD among those with Ishihara plates proven CVD. While specificity is the proportion of volunteers classified as not having CVD among those in whom the disease was excluded by Ishihara plates. Consider FPA to refer to false positive answers while FNA is for false negative answers, screening inefficiency (SI) for each plate, used by Crone [13], measures the quality of the discriminating ability of the each plate,
Figure 4. Computer-Based Ishihara Test
D. Screen Adjustment The test has been performed on Acer Professional 24" Widescreen LCD Monitor with 1920 x 1080 Full HD resolution. To achieve an approximate accurate color reproduction, the following screen adjustments were made; the monitor was kept half an hour in operation at a dark room. Monitor resolution was set to max. Color calibration process has been performed to insure the quality of the presented colors on the screen (The calibration process can be reached from the control panel.). The sufficient specs for this test are: Color
(1) Student t test was used to calculate the statistical difference between numerical variables, while the Chi square test was used for categorical variables. The analysis and statistics of this work has been performed using SPSS software program version 16 IV. RESULTS AND DISCUSSION The study included 267 volunteer, 240 males (89.9%), and 27 females (10.1%) with an age range from 19 to 23 years, with a mean 20.7 years, and standard deviation 1.34 years.
Volunteers were diagnosed as normal if they were able to read 17 or more plates correctly, and diagnosed as RG-CVD if they were able to read 13 or less plates correctly.
246
No difference
0
150
150
Number of correct answers more in the computer based test
1
12 11 20
13 12 21
6 3 3
12
15
2
19
21
3
3
1
21 20 21 20 21 20 21 13 21
20 19 19 18 18 17 17 8 16
51 33 21 3 3 3 12 3 3
54
Total
Using the computer based test, also 21 volunteers were diagnosed as RG-CVD, and all were males, with a percent 8.75% of male participants, and 243 volunteers were diagnosed as normal, and three volunteers answered 16 plates correctly, so they were not classified as RG-CVD nor normal, no female volunteers were diagnosed as having RG-CVD as shown in Table 2.
Number of correct answers more in the paper based test
2 3
TABLE II. Diagnosis RD-CVD
Not diagnosed Normal
RESULTS OF COMPUTER BASED TEST. Plates answered correctly
6 8 12 13 16 17 18 19 20 21
Number of volunteers 3 3 3 12 3 15 6 24 57 141
4 5
Total 21
3 243
The same number of volunteers were diagnosed as red green CVD by both tests, with 100% sensitivity of the computer based test compared to the paper based test, and 243 volunteers were diagnosed as normal in computer based test, when compared to the 246 volunteers diagnosed as normal by the paper based test gave a 98.78% specificity for the computer based test. Table 3 shows that the results of the computer based test was the same as that of the paper based test in 150 volunteers, where all volunteers answered the same number of plates in a correct way. In 102 volunteers the numbers of correct plates answered by the volunteers were more in paper based test than in computer based test, where; in 54 volunteers there were one more correct answer, in 24 volunteers there were 2 more correct answers, in 6 volunteers there were 3 more correct answers, in 12 volunteer there were 4 more correct answers, and in 6 volunteer there were 5 more correct answers, however these differences in the number of correct answers did not affect the end result of the computer based test whether the volunteer is a RG-CVD or not (Table 3).
Total number
21
Number of volunteers
3 3 3 9 3 3 18 225
Correct answers in computer based test
Normal
Number of volunteers
Correct answers in paper based test
RG-CVD
Type of difference
RESULTS OF PAPER BASED TEST.
Plates answered correctly 4 6 8 10 13 19 20 21
DIFFERENCE BETWEEN BOTH TESTS REGARDING THE NUMBER OF CORRECT ANSWER IN EACH TEST. Number of two test difference
Diagnosis
TABLE III.
Two test difference
TABLE I.
In 15 volunteers, the number of correct plates answered were more in computer based test, out of them; twelve participants answered 1 more correct plate, and 3 participants answered 2 more correct plates, these differences in the number of correct answers did not affect the end result of the computer based test whether the volunteer is a RG-CVD or not (Table 3).
Number of volunteers
Using the paper based test, twenty one volunteers were diagnosed as having RG-CVD, all were males, with a percent 8.75 % of male participants, and 246 volunteers were diagnosed as normal, no female volunteers were diagnosed as RG-CVD as shown in Table 1.
102
24 6 12 6
The mean and the standard deviation of the screening inefficiency for the paper and the computer based test was 0.04±0.02, and 0.05±0.02 respectively with no significant difference between both tests (P=0.092) (Table 4). TABLE IV. DIFFERENCE BETWEEN BOTH TESTS REGARDING THE SCREENING INEFFICIENCY, THE CATEGORIZATION INTO NORMAL OR RG-CVD, AND THE TOTAL NUMBER OF ANSWERS IN EACH TEST. Variance Screening inefficiency Categorization into Total number of answers
Mean
Paper based test 0.04
Computer based test 0.05
STD Normal RG-CVD Correct Wrong
0.02 247 21 5376 231
0.02 243 21 5310 297
P value 0.092 0.0912 0.004
Comparing the results of both tests according to categorization into normal, and RG-CVD, we found that the same number of volunteers were diagnosed as RG-CVD, and 247 volunteer were diagnosed as normal by the paper test and only 243 were diagnosed as normal with the computer based test, without significant difference between both tests (P=0.912) as shown in Table 4. Comparing all answers to the whole set of plates, the paper based test resulted in 5376 correct answers , and 231 false answers , and in the computer based test there were 5310 correct answers, and 297 wrong answers with a significant difference between both tests (P=0.04) (Table 4).
V. DISCUSSION AND CONCLUSION In this study, the prevalence of RG-CVD was 8.75 % of male participants, no female participants were diagnosed, both in the paper based test, and in the computer based test, which is very close to the predictable value in the world [4]. Computer based test gave 100% sensitivity and 98.78% specificity, which makes the use of the computer based test convenient for screening RG-CVD without losing any positive cases, or misdiagnosing negative cases as RG-CVD, there were three cases that fall in the zone between normal, and RG-CVD, where volunteers did not fulfill the criteria to be normal, or RG-CVD with the computer based test. Comparing the number of volunteers diagnosed as normal or RG-CVD by both test, resulted in statistically insignificant difference, this adds to the reliability of the computer based test, so, it can be used in screening of RG-CVD. Comparing the total correct and wrong answers in both tests resulted in a significant difference, however this did not affect the reliability of the computer based test, as the total number of correct and wrong answers did not diagnose RG-CVD from normal, where it depends on the number of correct and wrong answers in all plates for each participant. Some plates are better detectable than others, this assumption was confirmed by Heskett and Hovis [32], where they found that plate number 7 is the one most misread by participants, also in this study, plates number 9, and 10 were the most misread (21 mistake in each test), followed by plates 5,7,11, and 18 were the second most misread (15 mistakes in one test, and 18 mistake in the other test), for that, screening inefficiency was calculated for each plate independently, and the mean and the standard deviation for all plates were calculated, and compared, which resulted in statistically insignificant difference between the mean value for all plates in both tests, so both tests can be used for screening of RG-CVD without significant difference in the mean result of the discriminating ability of these plates. REFERENCES [1]
[2] [3] [4] [5] [6]
[7] [8] [9]
A. Stockman, L. T. Sharpe, “Spectral Sensitivities of the Middle- and Long-wavelength Sensitive Cones Derived from Measurements in Observers of Known Genotype” Vision Research, vol. 40, pp. 1711 – 1737, 2000. M. Marre, “Investigation of acquired color vision deficiencies” Colour, vol. 73, pp. 99-136, 1973 M. Neitz, J. Neitz, “Molecular Genetics of Color Vision and Color Vision Defects” Arch Ophthalm vol. 118, pp. 691 – 700, 2000 D. McIntyre, Color Blindness: Causes and Effects, Dalton Publishing, Chester, UK, 2002 B. L Cole, “Assessment of inherited colour vision defects in clinical practice” Clinical and Experimental Optometry vol.90 no.3 May 2007. D. Y. Lee, M. Honson, “Chromatic Variation of Ishihara Diagnostic Plates”, Color Research and Application Supplement vol. 28 no.4 pp. 267 – 276, 2003. J. Birch Diagnosis of Defective Color Vision. Butterworth-Heinemann, Edinburgh. 2003 S. Ishihara M.d. “The series of plates designed for colour deficiency” instruction sheet. 1917. J. T. Yates, M.F. Heikens, “Colour Vision Testing – Methodologies: Update and Review”, in: Menu J.-P., Ivan D. (eds.), RTO technical report 16. Operational Colour Vision in the Modern Aviation
[10]
[11]
[12]
[13] [14] [15] [16] [17]
[18] [19]
[20]
[21]
[22] [23]
[24]
[25] [26]
[27]
[28]
[29] [30] [31] [32]
Environment, Research And Technology Organization / North Atlantic Treaty Organization, Neuilly-sur-Seine, pp. 21-37, 2001. G. Arden, K. Gunduz, S. Perry, “ Color vision testing with a computer graphics system: preliminary results” Doc Ophthalmol vol. 69, pp.167– 174, 1988. M. Bach, C. Schmitt, M. Kromeier, G. Kommerell, “The Freiburg Stereoacuity Test: automatic measurement of stereo threshold” Graefes Arch Clin Exp Ophthalmol vol. 239, pp. 562–566, 2001. P. Cavanagh, D. Maurer, T. Lewis, D.A.I. MacLoad, G. Mather, “Computer-generated screening test for color blindness”, Color Res. Appl. vol. 11 , pp. 63-66, 1986. R. Crone, “Qunatitative diagnosis of defictive color vision” Am. J. Ophthalmol. vol. 51 , pp. 298–305, 1961. B. Edsel, J. A. Parker, L. A. Emerton, “Computerized color vision testing” Can J Ophthalmol vol. 29, pp.125–128, 1994. M.L. Long, J.P. Tuck, “Colour vision screening and viewing conditions: the problem of diagnosis”, Nars. Res. vol. 35 no. 1, pp. 52-55, 1986. J. Birch, “Efficiency of the Ishihara test for identifying red–green colour deficiency”, Opthal. Physiol. Opt. vol. 17, no. 5, pp. 403–408, 1997. J. Perales, E. Hita, “Influence of some factors ion non-typical responces to three tests of colour vision in children.” Colour Vision Deficiencies, Documenta Ophthalmologica Proceedings Series vol. 39, pp 211-219 1984. A. Chapanis, “A comparative study of five tests of colour vision” , J. Optom. Soc. Am. vol.38, pp.626-649, 1984. M. Mäntyjäri, T. Karppa, P. Karvonen, H. Markkanen, T. Myöhänen, “Comparison of six color vision tests for occupational screening”, Int. Arch. Occup. Environ. Health. vol. 58, pp. 53–59, 1986. H. Krueger, “Der Betriebsarzt im Spannumgsfeld zwischen Arbeitsplatzbegehumgund spezieller arbeitsmedizinischer Vorsorgeuntersuchung aus der Sicht eines Arbeitsphysiologen”, Zbl. Arbeitsmedizin vol. 41 , pp. 361–368, 1991. M. Menozzi, “Der personal computer im einsatz beim screening visueller funktionen” , Klin. Monatsbl. Augenheillkd vol. 206 no.5, pp. 405–407, 1995. P.J Pardo, A.L Pérez, M.I Suero “A new colour vision test in a PC-based screening system” Displays, vol. 21 pp. 203–206, 2000. P.J Pardo, A.L Pérez, M.I Suero, “Characterization of dichromat and trichromat observers using a PC-based anomaloscope”, Displays, vol. 22, no. 5, pp. 165-168, November 2001. P.J. Pardo, A.L. Pérez, M.I. Suero, “Validity of TFT-LCD displays for colour vision deficiency research and diagnosis”, Displays, vol. 25,no. 4, pp 159-163, November 2004. A. Toufeeq, “Specifying colours for color vision testing using computer graphics” Eye.vol. 18, pp.1001-1005, 2004 E. Miyahara, J. Pokorny, VC. Smith, et al., “Computerized color vision test based upon postreceptoral channel sensitivities.” Vis Neurosci. vol. 1, no. 3, pp. 465- 469, 2004. J. Kuchenbecker , F. W. Röhl , A. Wesselburg , J. Bernarding, W. Behrens-Baumann “Validity of a web-based color vision test for screening examinations of color vision”, Ophthalmologe, vol. 104, no. 1, pp. 47–53, 2007. G. Kapoor, D.P. Vats, J.K.S. Parihar ,” Development of computerized color vision testing as a replacement for Martin Lantern”. Medical Journal Armed Forces India, vol. 69, no. 1, pp. 11-15, 1 January 2013. J. Walraven,”Color basics for the display designer”, Color in Electronic Displays, Plenum Press, New York, pp. 3–38, 1992. G. Derefeldt, C.E. Hedin, “Visualisation of VDU colors by means of the CIELUV color space”, Displays vol. 10, no. 3, pp.125–128, 1989. A.L. Cochrane, W.W. Holland, “Validation of screening procedures”, Br. Med. Bull. vol. 27, no. 1, pp. 3-8, 1971. M.K. Haskett, J.K. Hovis, ”Comparison of the standard pseudoisochromatic plates to the Ishihara color vision test”, Am. J. Optorm. Physiol. Opt. vol. 64, no. 3, pp. 211-216, 1987.