officer with the Royal Australian Air Force in both squadron and ...... No. of. Coupons. FL3,FL4,FL5. 2.87. 0.08. -24.05. 0.18. 0.9659. 9. Analysis was also ...
An Evaluation of the Effective Block Approach Using P-3C and F-111 Crack Growth Data (U) C. Wallbrink, R. Amaratunga, W. Hu, P. Jackson and D. Mongru Air Vehicles Division Defence Science and Technology Organisation DSTO-TR-2195 ABSTRACT Recently an effective block approach has been proposed to address the experimentally observed growth rates of fatigue cracks at critical locations on F/A-18 airframes. In this approach, each program of spectrum load is treated as an equivalent constant amplitude cycle, and the baseline crack growth rate data are obtained using a similar spectrum load of interest. A procedure was devised to allow the use of the model parameters obtained under one load spectrum to predict the crack growth under a different load spectrum. In this study, we critically evaluate the capability of the effective block approach, using data obtained for the F-111 and P-3C coupon test programs, to gauge its general applicability to other aircraft operated by the Royal Australian Air Force. The data used in the evaluation encompasses different load spectra, different materials and different crack configurations. This investigation has found that the effective block approach was able to model fatigue crack growth in 2024-T851 aluminium under the F-111 flight spectra examined, but it could not produce an acceptable estimation of the total crack growth life for the P-3C spectra studied. It was, however, able to produce reasonable predictions of fatigue crack growth in a chosen interval of crack length. This report provides an independent evaluation and guidance for the application of the effective block approach.
RELEASE LIMITATION Approved for public release
Published by Air Vehicles Division DSTO Defence Science and Technology Organisation 506 Lorimer St Fishermans Bend, Victoria 3207 Australia Telephone: (03) 9626 7000 Fax: (03) 9626 7999 © Commonwealth of Australia 2008 AR-013-294 September 2008
APPROVED FOR PUBLIC RELEASE
An Evaluation of the Effective Block Approach Using P-3C and F-111 Crack Growth Data
Executive Summary One of the objectives of the Defence Science and Technology Organisation (DSTO) is to evaluate and report on a number of non-traditional crack growth estimation methods, including the method known as the “effective block approach (EBA)”. The EBA treats each program of spectrum load as an equivalent constant amplitude cycle and the baseline crack growth rate data are obtained using a similar spectrum load of interest. Predictions of crack growth under an untested spectrum are achieved by estimating the relative severity of the untested spectrum to a tested spectrum and then using the relative severity to modify the EBA crack growth parameters. This approach has been shown to effectively predict crack growth in materials and spectra used on the F/A-18. It has been suggested that the EBA may be applicable to other aircraft, including the P-3C and the F-111. In this study, we critically evaluate the capability of the EBA, using data obtained from different load spectra, different material and different crack configurations, to gauge its general applicability to other aircraft operated by the Royal Australian Air Force. Crack growth data obtained from P-3C coupon tests conducted by the National Aerospace Laboratory of the Netherlands, and F-111 coupon tests conducted by the Defence Science and Technology Organisation were used for the evaluation. The report addresses the determination of the model parameters and whether they are dependent on the stress level of the spectrum. It also investigated the soundness of the procedure used for transferring the model parameters from one spectrum to another; the performance of the model under the same spectrum and under different spectra. The present investigation has shown that the effective block approach was able to model fatigue crack growth in 2024-T851 aluminium under F-111 flight spectra. The application of the large loads in the cold proof load test does not appear to affect the technique’s ability to predict fatigue crack growth curves. The EBA was not able to produce accurate predictions of total crack growth life for the P-3C spectrum, however, predictions of fatigue crack growth in a chosen interval were reasonable. Importantly, the application of the EBA as a predictive tool hinges on the capability of a third-party tool, such as FASTRAN, to correctly predict the relative severity between the tested and an untested spectrum. Any inaccuracy or uncertainty in the predicted relative severity will directly affect the performance of the EBA. Transferability of the EBA-based predictions between different notch features has not been evaluated.
Authors
C. Wallbrink Air Vehicles Division Chris Wallbrink graduated in 2005 with a PhD from Monash University in the department of Mechanical Engineering. He then held the position of research fellow at Monash University till the end of 2006 where his research interests included, modelling of fatigue crack growth, infrared NDT technologies and fibre optic corrosion detection devices.
____________________
He has since joined the DSTO in 2007 in the Air Vehicles Division and in currently conducting research into methods for fatigue crack growth modelling and also airworthiness standards. ________________________________________________
R. Amaratunga Air Vehicles Division
____________________
Mr Amaratunga graduated in 1997 with a Bachelor of Engineering (Aeronautical) from the University of Sydney. Since commencing employment at the then Aeronautical and Maritime Research Laboratory in 1998, Mr Amaratunga has worked in the fields of aircraft structural integrity, risk and reliability assessment of fixed wing aircraft, and Air6000 cost and capability. Mr Amaratunga's experience ranges from repair design, probabilistic assessment of aircraft, to configuration comparison between high performance fighter aircraft. ________________________________________________
W. Hu Air Vehicles Division Weiping Hu joined DSTO in 1998 as a research scientist. He is currently a senior research scientist leading the development of modelling capabilities for the analysis of structural integrity of aircraft structures.
____________________
After obtaining his PhD degree in 1993 at Dublin City University Ireland, he held various academic positions at Dublin City University, Monash University and Deakin University. His current research interests include fatigue crack growth in aircraft structures, constitutive models and plasticity, and numerical methods in engineering. ________________________________________________
P. Jackson Air Vehicles Division
____________________
Philip Jackson graduated form the Royal Melbourne Institute of Technology in 1981 with a Bachelor of Aeronautical Engineering (with Distinction). He spent the next 15 years as an engineering officer with the Royal Australian Air Force in both squadron and staff engineering posts specialising in aircraft structural integrity and fatigue management. In 1988 he completed a Masters of Science in Aerospace Vehicle Design at Cranfield Institute of Technology, UK and from 1991-94 was attached to the Canadian National Research Council, Ottawa, Canada as part of the F/A-18 International Follow-on Structural Test Project. He joined DSTO in 1997 and has been the technical and program lead for the DSTO contributions to international P-3 Service Life Assessment Program (SLAP). He is currently Head, Helicopter and Transport Aircraft Structral Integrity in the Aircraft Structures Branch of Air Vehicles Division as well as leading a divisional research effort on airworthiness and aircraft design standards. ________________________________________________
David Mongru Air Vehicles Division
____________________
Mr Mongru graduated from RMIT in 1990 with a Bachelor of Aerospace Engineering (Honours). He commenced work at DSTO in 1994 working on loads development and fatigue interpretation for the PC9 fatigue test. He joined IFOSTP in 1996 performing fatigue analysis of critical components on the aft fuselage of the F/A-18. In 2001 he commenced work on the P-3 SLAP. His primary functions included fatigue test interpretation and provison of technical support to the P-3 empennage test. He is currently working on the standards and lifing methodologies task. ________________________________________________
Contents 1. INTRODUCTION ............................................................................................................... 1 2. EFFECTIVE BLOCK APPROACH OVERVIEW............................................................ 2 2.1 The Concept of the Effective Block Approach .................................................... 2 2.1.1 Calculation of the Stress Intensity Factors at the Reference Stress..... 3 2.1.2 Calculation of the Crack Growth Rate.................................................... 4 2.1.3 Determination of the Crack Growth Constants C and m ..................... 5 2.2 The EBA as a predictive tool................................................................................... 5 2.2.1 The original method (fixed m approach) ............................................... 5 2.2.2 The variable- m approach......................................................................... 6 3. EVALUATION OF THE EBA USING P-3C COUPON DATA ................................... 8 3.1 National Aerospace Laboratory (NLR) coupon test data................................... 8 3.2 Representation of P-3C FSFT Coupon Data Using the EBA........................... 10 3.3 Crack Growth Prediction Using the EBA ........................................................... 12 3.3.1 Determining the initial flaw size ........................................................... 12 3.3.2 Evaluating the relative severity of RAAF and FSFT spectra ............. 14 3.3.3 Determining m2,E and C2,E for the RAAF spectrum ......................... 17
3.4
3.3.4 Prediction of crack growth under RAAF spectrum............................ 18 3.3.5 A comparison of inspection intervals ................................................... 20 Outer Wing Lower Panel/Cap Splice .................................................................. 21
4. THE EBA EVALUATION USING F-111 LITV COUPON DATA............................ 26 4.1 F-111 loads interpretation and truncation validation coupon test data........ 26 4.2 The EBA’s Ability to Model the F-111 LITV Coupon Test Data.................... 27 4.2.1 The EBA applied to the F-111 LITV coupon test data ........................ 27 4.2.2 The small scale yield (SSY) criterion applied to the LITV coupon test data .................................................................................................................... 29 4.3 Crack Growth Rate Predictions Using the EBA ................................................ 30 4.4 F-111 Fatigue Crack Growth Predictions Using the EBA ................................ 31 4.4.1 Estimating the effective initial flaw size............................................... 32 4.4.2 Crack growth predictions....................................................................... 36 5. DISCUSSION..................................................................................................................... 38 5.1 Representation of the Experimental Data by the EBA..................................... 38 5.2 Stress Level Sensitivity.......................................................................................... 39 5.3 Predictive Capability of the EBA ......................................................................... 40 5.3.1 Initial Flaw Size........................................................................................ 40 5.3.2 Model Parameter Transferability .......................................................... 41 6. CONCLUSION................................................................................................................... 43
7. REFERENCES..................................................................................................................... 45 APPENDIX A: PROGRAM
A STATISTICAL TREATMENT OF THE F-111 LITV COUPON TEST ...................................................................................................................... 47 A.1. The statistical treatment of linear regression lines.................. 47 A.2. Analysis of the F-WELD spectra at FASS 226 ........................... 49 A.3. Analysis of the discriminated F-WELD spectra at FASS 226 . 54
APPENDIX B:
CRITERION FOR DETERMINING SMALL SCALE YIELDING (SSY) ...................................................................................................................... 59
APPENDIX C: COMPARISON OF CRACK GROWTH RATE PARAMETERS EVALUATED USING THE EBA.......................................................................................... 61 C.1. FASTRAN analysis ........................................................................ 61 C.2. EBA crack growth rate predictions ............................................. 62 APPENDIX D: FASTRAN
F-111 CRACK GROWTH PREDICTIONS USING THE EBA AND ...................................................................................................................... 74
APPENDIX E: DATA
STATISTICAL ANALYSIS OF THE F/A-18 APOL COUPON TEST ...................................................................................................................... 82
DSTO-TR-2195
1. Introduction Recently an effective block approach (EBA) has been proposed to address the experimentally observed growth rates of fatigue cracks at critical locations on F/A-18 airframes (McDonald and Molent 2004; McDonald, Molent et al. 2006). It was claimed that the growth of these cracks in structures made of 7050 aluminium alloy could not be adequately predicted using classical models such as Paris law (Paris and Erdogan 1963) or the plasticity-induced crack closure models (Budiansky and Hutchinson 1978; Newman 1981), based on constant amplitude (CA) crack growth rates (CGR). Consequently, a new approach was proposed that treats each program (block) of spectrum load as an equivalent CA cycle. In essence, this approach treats all the spectrum loads as a crack-growth equivalent CA cycle, hence formally eliminating the complication of sequence effects in the linear elastic fracture mechanics (LEFM) approach. The CGR is expressed in a similar equation to that of the Paris law, with two model parameters to be determined: the crack growth coefficient and the Paris exponent, and they are determined by fitting the experimental data obtained from spectrum loading tests. However, since each spectrum is equivalent to a unique CA cycle, these model parameters are expected to be dependent on the spectrum, the peak stress, as well as the geometry and the material. A procedure was then devised to allow the use of the model parameters obtained under one load spectrum (the tested spectrum) to predict the crack growth under a different load spectrum (the untested spectrum). This procedure relies on the relative severity of these two spectra being determined using an independent third-party model or tool, which generally uses CA growth rates to predict the crack growth under spectrum loading. The EBA has been shown to produce crack growth curves that correlate well with the experimental results for the F/A-18 cases studied (McDonald, Molent et al. 2006). During the preparation of this document, concurrent investigations took place with relation to the EBA and its use with the F-111. The results of which have recently been published in DSTO-TR-2124 (Zhuang, Boykett et al. 2008). In this study, we critically evaluate the capability of the EBA, using data obtained from different load spectra, different material and different crack configurations, to gauge its general applicability to other aircraft operated by the Royal Australian Air Force (RAAF). Questions about the effectiveness of the EBA approach that we wish to address include the determination of the model parameters and whether they are dependent on stress level of the spectrum; the soundness of the procedure used to transfer the model parameters from one spectrum to another; the performance of the model under the same spectrum with different stress levels and under different spectra; and the length of the spectrum, relative to the total life of the structure. The evaluation was conducted using the experimental data obtained from fatigue-critical locations on P3-C transport aircraft and F-111 fighter aircraft.
1
DSTO-TR-2195
2. Effective Block Approach Overview In this section we detail the concept of the EBA and its numerical procedure of application. In doing so, we also hope to clarify the particular model to be evaluated in this report; correctly interpret the procedure devised to transfer the model parameter from one spectrum to another; and to set the scope of the evaluation to be carried out. It is worth pointing out that the concept of treating a spectrum as a CA cycle for crack growth modelling is not new. In particular, Gallager and Stalnaker (Gallagher 1976; Gallagher and Stalnaker 1978) developed a very similar model in 1970s, in which the CGR equation was defined as crack growth per flight and related to the maximum stress intensity factor in a Paris-type equation. The main difference between the EBA evaluated here and that of Gallager and Stalnaker is that the former proposed a procedure to apply the model parameters developed from a tested spectrum to other untested spectra. Apart from noting this difference, the terms effective block approach and its abbreviation both refer to the approach developed in McDonald, Molent et al. (2006).
2.1 The Concept of the Effective Block Approach In traditional crack growth modelling based on LEFM, the CGR is defined for each cycle. For example, the well-known Paris law is expressed as (Paris and Erdogan 1963):
da = C ΔK m , dN
(1)
where a is the crack length, N is the load cycle, ΔK is the stress intensity range. C and m are two material constants known as the coefficient and the exponent of Paris law, and they are determined by fitting the above equation to experimental data obtained under CA loading. Both the success and the limitation of the Paris law are well-known, and various attempts have been made to improve its performance under spectrum loading, by modelling the sequence effects using concepts such as plasticity-induced closure (Budiansky and Hutchinson 1978; Newman 1981). McDonald, Molent et al. (2006) show that neither the plain Paris law nor the crack closure model, as implemented in AFGROW (Harter 2004) and FASTRAN (Newman 1992), was able to adequately predict the crack growth behaviour of 7050 aluminium alloy subjected to the service load of the F/A-18 fighter planes. To make the matter worse, the predictions by these methods are generally non-conservative (McDonald, Molent et al. 2006). Consequently, EBA was proposed. In essence, the EBA treats all the spectrum loads as a crack-growth equivalent CA cycle; hence it formally eliminates the complication of sequence effects in the Paris law. Using a similar equation to that of Paris, the CGR for the EBA is expressed as:
a& =
2
da m = CK ref . dB
(2)
DSTO-TR-2195
Here K ref is a reference stress intensity factor specified later, and C and m are the model parameters. In this report B is a measurement of time and is used in the CGR da dB to signify that the CGR has been calculated based on spectrum blocks. The shorthand notation of CGR, a& , is introduced here for brevity; it does not signify a derivative with respect to real time. This notation will be used later for the discussion of the transfer of model parameters. All crack growth data are presented in terms of simulated flight hours for direct comparison. It should be noted that, in general, the model parameters in Eqn. (2) are numerically different from those defined in Eqn. (1). In equation 2, C and m depend not only on the material properties but also on the load spectrum applied and even the stress level of the same spectrum, and they are determined by fitting the equation to the experimental CGR data obtained under the load spectrum of interest. A question arises, then, as to how the EBA could be used as a predictive tool, if the model parameters have to be determined using the experimental CGR data obtained under the very same load spectrum for which the crack growth is to be predicted. The predictive capability of the approach, therefore, hinges on (1) whether the dependence of C and m on the load spectrum is so weak that they can be effectually treated as material constants; or if that is not the case, (2) whether the model parameters for an untested spectrum could be deduced from those obtained from a tested spectrum. (McDonald, Molent et al. 2006) proposed a procedure, based on the relative severity estimation obtained from a third-party tool, for transferring the model parameters determined using one spectrum to another, and it is detailed in Section 2.2. The focus of this report is to examine the soundness of this procedure, using experimental data obtained under F-111 and P3-C load spectra. The EBA requires the following information prior to an analysis: • Crack length as a function of time, or the number of cycles, or flight hours, or blocks of spectrum loading; • Full load history at the location of interest; • The reference stress to be used in the region of interest; • Relevant boundary correction factors in the region of interest (β factors). Provided that all the necessary data exist, the EBA can then be used to evaluate the model parameters C and m . The following three steps are used in the process: 1. Calculating the stress intensity factors at the reference stress; 2. Calculating the crack growth rate; 3. Determining the constants C and m .
2.1.1 Calculation of the Stress Intensity Factors at the Reference Stress The reference stress intensity factors are calculated using the following equation:
K ref = σ ref β π a ,
(3)
where K ref is the stress intensity factor at the reference stress σ ref , a is the crack length, and
β is the boundary correction factor. The maximum stress of a spectrum is usually selected as
the reference stress.
3
DSTO-TR-2195
2.1.2 Calculation of the Crack Growth Rate The CGR is evaluated at each crack length in the experimental data, using a “three-point” technique. Thus, the CGR is evaluated at each crack length by performing a linear regression of the logarithms of three consecutive crack lengths ai −1 , ai , ai +1 . Here the crack growth measurements ai −1 , ai , ai +1 are taken at the end or each spectrum block. The time interval between the beginning and end of the block is BT (the total spectrum block). The slope of this line is then used for the calculation of the CGR at ai . Figure 1 schematically shows how the d (ln( a )) , is related to the CGR through the following method works. The slope of the line, dBT equation:
da d (ln(a )) =a dBT dBT
(4)
This calculation is performed at every experimental data point. The subscript T indicates the use of the total spectrum block and the subscript S indicates the use of sub-blocks in the analysis.
Regression line BT
BT
ln(ai+1) ln(ai) ln(ai-1)
ln(aj+1) ln(aj) ln(aj-1)
BT Total Block BS Sub Block BS< BT
BS BS
B (Time) Figure 1: Evaluation of the crack growth rate per block
da defined using BT indicates the CGR has been evaluated using total blocks. This dBT da which is the CGR evaluated in terms of sub-blocks BS CGR should be equivalent to dBS
The CGR
4
DSTO-TR-2195
using the points a j −1 , a j , a j +1 . The equivalence of these CGRs is only true if the crack growth remains steady state (Gallagher 1976).
2.1.3 Determination of the Crack Growth Constants C and m The derived CGRs and the associated stress intensity factors are then plotted on a log-log scale. The slope of the straight line that best fits the data is determined from a linear ⎛ da ⎞ regression using the following equation; ln ⎜ ⎟ = ln ( C ) + m ln ( K ref ) . The slope represents the ⎝ dB ⎠ CGR exponent m , and the y -intercept, ln C , gives the CGR coefficient.
2.2 The EBA as a predictive tool There are two issues central to the capacity of the EBA to be used as a predictive tool, the initial crack size and a means to transfer the model parameters from a tested spectrum to an untested spectrum. In the following two sub-sections we describe the original procedure developed by McDonald (2005), and a modified procedure developed by Wallbrink and Hu (2008). The issue of initial crack size will be dealt with later.
2.2.1 The original method (fixed m approach) Once the model parameters are determined, the EBA can be used to “predict” the crack growth for the same geometry, same material subjected to the same spectrum loading. To apply the model to the same geometry, same material subjected to a different spectrum loading, the model parameters C and m for the new spectrum need to be determined. Obviously they should not be determined from experimental data as that will defeat the purpose of “prediction”. In order to make the EBA into a predictive tool, a numerical procedure was developed by McDonald (2005) by assuming that, for two similar but different spectra, the crack growth parameters determined from experiments and those obtained from a predictive tool such as AFGROW (Harter 2004) are proportional, although the raw crack growth results from the predictive tools may be inaccurate. It further assumes that m remains the same for both the tested and the untested spectrum. Based on these assumptions the following relationship is obtained. Thus,
C 2, E C1, E
=
C 2, P C1, P
(5)
Here the subscripts 1 (tested) and 2 (untested) represent spectra 1 and 2 and the subscripts P and E indicate terms obtained from a predictive tool and experiment respectively. Hence, C1,E has been determined from experimental data for spectrum 1, and C1,P and C2,P are calculated from a crack growth tool for spectrum 1 and 2. Then Eqn. (5) can be used to evaluate the CGR parameter C2,E for spectrum 2. The exponent m evaluated from the experimental data under spectrum 1 was directly transferred to the new spectrum, spectrum 2.
5
DSTO-TR-2195
2.2.2 The variable- m approach The initial implementation of the EBA assumed that the exponent m remained constant between spectra. In other words, experimental CGR obtained under spectrum 1 should have the same exponent m as CGR obtained under spectrum 2. Investigations with quantitative fractography (QF) data have shown that this assumption holds true for various spectra used with the F/A-18 (McDonald, Molent et al. 2006), but this may not be the case for all spectra. For instance, CA loading is a limiting case for variable amplitude loading, yet the CGR data obtained under CA loading typically give Paris exponent of between 2~4. Indeed, such an assumption is not necessary, as shown below. Implicit in the original assumption of equivalence of relative severity between the tested and the untested spectra is the following relationship:
a&2,E a&2,P = , a&1,E a&1,P
(6)
which reduces to Eqn. (5) if m is assumed constant (cf Eqn. (2)). Thus, Eqn. (6) is a more fundamental assumption, which asserts that the ratio of CGRs for two different spectra are correctly predicted by tools such as AFGROW, although the rates themselves may not be correct. Here, a& = da / dB as noted earlier. If this assumption is accepted, then Eqn. (6) may be used to determine the model parameters for a new untested spectrum, when experimental data exist for the same material under a tested spectrum. To do this, we substitute Eqn. (2) into Eqn. (6) to obtain: m
C2,E K ref2 ,E m
C1,E K ref1,E
m
=
C2,P K ref2 ,P m
C1,P K ref1,P
.
(7)
Rearranging Eqn. (7) and collecting terms, we get:
C2,E K ref2 ,E = m
C 2 ,P m −m +m C1,E K ref2 ,P 1,P 1,E C1,P
(8)
Since the above relationship holds true for any K ref ≠ 0 , it should also be true for K ref = 1 . Therefore,
C 2 ,E =
C 2 ,P C1,E C1,P
(9)
In Eqn. (9) the constants C1,E C2,E C1,P and C2,P are independent of K ref and thus we can substitute Eqn. (9) into Eqn. (8) to obtain:
C C 2 ,P m m −m + m C1,E K ref2 ,E = 2,P C1,E K ref2 ,P 1,P 1,E . C1,P C1,P
6
(10)
DSTO-TR-2195
or, upon cancelling common factors,
K ref2 ,E = K ref2 ,P m
m
− m1, P + m1, E
,
(11)
which gives:
m2,E = m2,P − m1,P + m1,E .
(12)
Thus, Eqn. (9) and Eqn. (12) provide a more general means for determining the CGR constants for an untested spectrum from the constants determined from a tested spectrum. This approach will be used, together with the initial implementation of the EBA, to assess the EBA’s applicability to P-3C and F-111 crack growth data sets. In summary, three variants of the methods for transferring the model parameters from a tested spectrum to an untested spectrum will be evaluated. They are:
• Method 1: m2,E = Constant = 2 This method sets the crack growth exponent equal to 2 for both spectra and uses Eqn. (5) to calculate the CGR coefficient C2,E . It essentially assumes a log-linear relationship between the crack growth and the simulated flight history. • Method 2: m2,E = m1,E This method is similar to method 1, but instead of setting m2,E = 2, m2,E is set equal to m1,E . The CGR coefficient C2,E is again calculated with Eqn. (5).
• Method 3: Variable-m This method uses Eqn. (12) to evaluate m2,E and uses Eqn. (5) to evaluate the constant CGR parameter C2,E . In the following sections, the EBA is evaluated using the experimental data available for F-111 and P3-C load spectra and geometries. Specifically, the following issues will be examined: 1. whether the EBA can adequately represent the experimental data, i.e., a. whether the CGRs under a spectrum can be adequately represented by Eqn. (2); b. whether C and m are independent of the reference stress of the spectrum; c. whether there is a limit on the level of stress for this independence; 2. the transferability of C and m between different spectra, i.e., a. whether the assumptions in Eqn. (9) and (12) are valid; b. what role is played by third-party crack growth tools such as AFGROW and CGAP (FASTRAN), an in-house crack growth analysis tool (Hu and Walker 2006); c. how to reconcile the view that these third-party tools do not give accurate predictions in terms of absolute values but their predictions of relative severity are acceptable.
7
DSTO-TR-2195
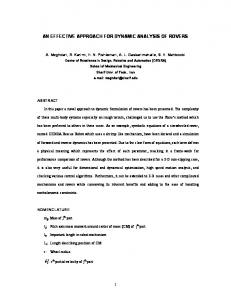
3. Evaluation of the EBA Using P-3C Coupon Data 3.1 National Aerospace Laboratory (NLR) coupon test data The data used for this part of the evaluation were obtained from a coupon test program conducted by the National Aerospace Laboratory (NLR) (Veul and Ubels 2003). The NLR coupon test program tested 72 coupons under 5 different spectra manufactured from 2.02 mm (0.08") thick 7075-T6 rolled sheet material. For the current work only two spectra were considered, the full scale fatigue test (FSFT) spectrum and the RAAF spectrum. The aim was to use the FSFT notched coupon crack growth data to predict the crack growth under the RAAF spectra using the EBA, and compare it to the actual RAAF notched coupon crack growth data. This approach mimicked the P-3 service life assessment program (SLAP) test interpretation logic whereby FSFT results were used to calculate lives under a RAAF P-3C spectrum (Teunisse, Phillips et al. 2006). The detailed material properties, coupon geometry and the loading spectra are given in Veul and Ubels (2003). The crack growth data were measured using the direct current potential drop (DCPD) method. Three coupons were tested under the FSFT spectrum, and four coupons were tested under the RAAF spectrum. Both spectra are a flight-by-flight non-repeating blocks of 15,000 hours. The crack growth data for the three coupons tested under the FSFT spectrum are presented in Figure 2, in which the crack length a was measured from the edge of the notch. The crack growth data has been plotted against simulated flight hours (SFH). The crack growth data represents less than two spectrum blocks.
8
DSTO-TR-2195
0.1 FSFT-FCA361-a (172.9 MPa) FSFT-FCA361-b (172.9 MPa) FSFT-FCA361-c (172.9 MPa)
0.01
a (m)
0.001
0.0001
0.00001
0.000001 100
1000
10000
100000
Simulated Flight Hours
Figure 2: FSFT Raw Coupon Data The DCPD measurements in Figure 2 indicate that the limits of the DCPD are potentially affecting the accuracy of measurements in the early stages of crack growth. The crack must grow to a size above the minimum operation limit of the system where the DCPD signal could detect the presence of a crack. The present data indicates that the crack must be greater than 0.254 mm to produce reliable measurements. 0.1 FSFT-FCA361-a (172.9MPa) FSFT-FCA361-b (172.9MPa) FSFT-FCA361-c (172.9MPa)
a (m)
0.01
0.001
0.0001 0
2000
4000
6000
8000
10000 12000 14000 16000 18000 20000
Simulated Flight Hours
Figure 3: FSFT Data with “Noise” Removed
9
DSTO-TR-2195
An attempt was made to remove the initial “anomalous” data in order to isolate the actual crack growth measurements. The clean up consisted of first removing the measurements regarded as noise, below the limits of detection of the DCPD system then removing all the points that result in a negative crack increment. The resulting data are shown in Figure 3. It is possible that in the process of removing anomalistic data, a number of legitimate points may have been removed. It is also possible that a number of anomalous data points have escaped the clean-up process. However, the majority of the data removed were from the period when crack length was below the limits of detection of the DCPD system. The remaining data were considered representative of the actual crack growth in the test coupons.
3.2 Representation of P-3C FSFT Coupon Data Using the EBA Figure 4 shows a plot of CGR versus the reference stress intensity factor for the FSFT spectrum, using Eqn. (2). In the calculation of the reference stress intensity factor, the boundary correction factor β was obtained from a 3D finite element analysis using energy methods (Gravina 2006), as shown in Figure 5. The σ ref used was the maximum stress in the FSFT spectrum which was 167.78 MPa (24.335 ksi). The crack size, a , was based on the measured coupon data. A linear regression of the experimental data gave m1, E = 1.36 and
C1, E = 9.71 × 10⁻⁹ . It is important to note that in order to apply the EBA to the P-3C spectrum, it was necessary to subdivide the total spectrum into smaller blocks (sub-blocks). This assumes the spectrum is “steady - state” (Gallagher 1976). The sub-blocks were based on the intervals of data acquisition used by the DCPD system. While this has been used to derive the EBA parameters, no attempt was made to compare the crack growth sub-block by sub-block. From Figure 4, it can be seen that Eqn. (2) gives a reasonable representation, with a coefficient of determination 1 of 0.8. Also in Figure 4 we see that the m1, E = 1.36 which is markedly different from the value of m = 2 obtained in the F/A-18 studies.
1
2
The coefficient of determination (R ) is the percentage of the variation that is explained by the model. It can be used to assess the degree of variability about a model of interest.
10
DSTO-TR-2195
0.00001
FSFT (a,b,c) Crack Growth Crack GrowthRate Rateda /dB (mm/block)
Power (FSFT (a,b,c))
0.000001
0.0000001
1.3637
y = 1E-08x 2 R = 0.801 0.00000001 10
100 Reference Stress Intensity Factor K ref (MPa m ) Kref
Figure 4: Crack growth rate vs K ref for FSFT coupon data
3.00
2.50
β
2.00
1.50
1.00
0.50
0.00 0
1
2
3
4
5
6
7
8
9
10
a (mm)
Figure 5: Coupon Beta Solution
11
DSTO-TR-2195
3.3 Crack Growth Prediction Using the EBA With the model parameters determined in the previous section, next we proceed to use them to predict crack growth. This includes “predicting” the crack growth under the same (FSFT) spectrum and under a different spectrum (RAAF), but before doing either, we need to determine what initial flaw size to use. We also need to determine the model parameters corresponding to the untested RAAF spectrum. These are discussed in the following three sub-sections.
3.3.1 Determining the initial flaw size If the initial flaw size is a0 and the final crack size is a f , which could be the critical crack size
acrit , then the crack growth life in terms of the number blocks is obtained by integrating (Eqn. 2), af
B=
1
∫ CK
aO
m ref
da
(13)
However, as noted in McDonald, Molent et al. (2006), the final life is “markedly influenced by the choice of a0 ”. A fundamental tenet of the EBA is that, for a particular material, the value of a0 is independent of the spectrum and the stress level. Moreover, the value of a0 will be consistent with the crack initiating microstructure or surface features observed by fractography. There will be, of course, some scatter associated with the estimated value of a0 , and from the aluminium 7050 coupons used for the F/A-18 in McDonald, Molent et al. (2006) a0 was typically between 0.1 and 0.01 mm (0.004 and 0.0004 inches). A significant proportion of the F/A-18 crack growth data displays a straight line trend on a log-linear scale, from which it is relatively easy to extrapolate back to time zero to estimate an initial flaw size (McDonald 2005). In the case of the P-3C coupon data, the determination of the initial flaw size was not as straightforward. As no quantitative fractography measurements were carried out, no direct measurements of the initial flaw size could be made. Further more, because valid crack growth data began at approximately 10000 hours, there is a long period in which the crack growth data were considered “anomalous” as the crack size was obviously below the DCPC detectable threshold. Nevertheless to estimate the initial flaw size we must extrapolate the crack growth curve back to time zero, disregarding these “anomalous” data. In McDonald (2005) the initial flaw size was estimated by back predicting the Paris equation using the EBA constants, but when this method was applied to the P-3C coupon data it failed to produce a meaningful estimate of the initial flaw size. Through subsequent internal DSTO discussions a recommendation was made, based on past experience with the F/A-18 and the apparent trend observed in the P-3C data, to exponentially back-extrapolate (a straight line on a log-linear plot) the raw crack growth data to time zero to estimate the initial flaw size. Another method that has been tried involved back-predicting the crack growth curve using FASTRAN.
12
DSTO-TR-2195
A backward-exponential extrapolation of coupon data under the FSFT spectrum shown in Figure 6 gave an approximate initial flaw size of 1.52 × 10⁻⁵ m. As a comparison, a backexponential extrapolation of the RAAF coupon data is also shown in Figure 6. Clearly, very different estimates of the initial flaw size are obtained for the RAAF data and the FSFT data. This result highlights a fundamental issue that will ultimately affect the EBA’s ability to consistently estimate the total life of a structure or at least for the P-3C spectra considered in this analysis. The present treatment of the problem produces an effective initial flaw size which appears to be dependent on the spectrum. If we are to accurately estimate the total life of a structure we will also need the ability to estimate the effective initial flaw size or modify the present methodology so that predictions can be made from an intrinsic flaw size independent of the spectrum applied.
1.0E-01 1.0E-02 1.0E-03
a (m)
1.0E-04 1.0E-05 1.0E-06
RAAF-fca361-a RAAF-fca361-c FSFT-fca361-a FSFT-fca361-c Expon. (RAAF-fca361-c) Expon. (RAAF-fca361-d) Expon. (FSFT-fca361-b)
1.0E-07 1.0E-08 1.0E-09 0
5000
RAAF-fca361-b RAAF-fca361-d FSFT-fca361-b Expon. (RAAF-fca361-b) Expon. (RAAF-fca361-a) Expon. (FSFT-fca361-a) Expon. (FSFT-fca361-c)
10000 15000 20000 25000 30000 35000 40000 45000 50000 Simulated Flight Hours
Figure 6: Exponential extrapolation to evaluate a0 FASTRAN was also used to estimate the initial flaw size by altering a0 to match the final life. Figure 7 shows the FASTRAN predicted curve and the coupon crack growth data for the FSFT coupons which gives an initial flaw size of 5.08 × 10⁻⁵ m. If we use FASTRAN to back-predict the RAAF crack growth data, a new initial flaw size of 2.54 × 10⁻⁵ m can be obtained as shown by point B in Figure 7. While the crack growth under each spectrum appears to be satisfactorily modelled above 0.5 mm, below this value the predictions would not be reliable. This difference in the estimated initial flaw size again
13
DSTO-TR-2195
highlights a problem associated with predicting the total life under another spectrum using existing crack growth software tools e.g. FASTRAN in this study.
1
0.1
FSFT-FCA361-a (172.9MPa)
RAAF-FCA361-a (167.9MPa)
FSFT-FCA361-b (172.9MPa)
RAAF-FCA361-b (167.9MPa)
FSFT-FCA361-c (172.9MPa)
RAAF-FCA361-c (167.9MPa)
FSFT FASTRAN Prediction
RAAF-FCA361-d (167.9MPa)
RAAF FASTRAN Prediction
a (m)
0.01
0.001
A 0.0001
B 0.00001 0
5000
10000 15000 20000 25000 30000 35000 40000 45000 50000 Simulated Flight Hours
Figure 7: Comparison of the RAAF FASTRAN using an initial flaw size of 0.025 mm to the FSFT FASTRAN prediction using an initial flaw size of 0.05 mm
3.3.2 Evaluating the relative severity of RAAF and FSFT spectra In order to determine the model parameters m2,E and C2,E for an untested spectrum from those of a tested spectrum, the EBA requires the relative severity of the two spectra. The EBA does not provide its own means of assessing relative severity; rather, it relies on third-party tools such as AFGROW or FASTRAN. For this analysis, the version of FASTRAN originally calibrated and used in the DSTO P-3 SLAP work (Teunisse, Phillips et al. 2006) was selected. Using FASTRAN, the crack growth curves were generated for the FSFT and the RAAF spectra, with an initial flaw size of 0.05 mm and using the beta function from Figure 5. Note that FASTRAN has significantly under predicted the final fatigue life for the RAAF spectrum, as seen in Figure 8.
14
DSTO-TR-2195
1.0000
0.1000
FSFT-FCA361-a (172.9MPa)
RAAF-FCA361-a (167.9MPa)
FSFT-FCA361-b (172.9MPa)
RAAF-FCA361-b (167.9MPa)
FSFT-FCA361-c (172.9MPa)
RAAF-FCA361-c (167.9MPa)
FSFT FASTRAN Prediction
RAAF-FCA361-d (167.9MPa)
RAAF FASTRAN Prediction
a (m)
0.0100
0.0010
0.0001
0.0000 0
5000
10000 15000 20000 25000 30000 35000 40000 45000 50000 Simulated Flight Hours
Figure 8: FASTRAN Predictions for FSFT and RAAF spectra, a0=0.05 mm The FASTRAN crack growth curves were then converted to rate data and thus allowed the Paris constants to be calculated using the method described in Section 2.2. Figure 9 shows the CGRs evaluated from the two FASTRAN predictions and the linear regressions. Clearly there is large scatter in the rate data, which was a result of the large number of points generated by FASTRAN, and more importantly the inherent variability in the cycle- by-cycle crack growth calculation due to the periodic calculation of the crack opening stress. In order to extract both a C and an m value with any confidence, the rate data was refined to maintain a regular sample spacing. This was accomplished via the use of Origin® 6.0. An interpolation curve was created using five-point averaging from which 150 equally spaced points were output and used to generate the curve in Figure 10
15
DSTO-TR-2195
Crack Growth growth Rate rate, da/dB (m/SFH) Crack
1.E-05
1.E-06
1.E-07
1.E-08 FASTRAN analysis (FSFT)
1.E-09
EBA Paris model (FSFT, FASTRAN analysis) FASTRAN analysis (RAAF) EBA Paris model (RAAF, FASTRAN analysis)
1.E-10 1
10 Reference ReferenceStress stressIntensity intensityFactor factor,KK (MPa (MPa√m) m) ref ref
100
Figure 9: Crack Growth Rate data for FASTRAN Runs without smoothing
Crack growth rate,Rate da/dB (m/SFH) Crack Growth
1.E-05
1.E-06
1.E-07
1.E-08 FASTRAN analysis (FSFT)
1.E-09
EBA Paris model (FSFT, FASTRAN analysis) FASTRAN analysis (RAAF) EBA Paris model (RAAF, FASTRAN analysis)
1.E-10 1
10 Reference Stress Intensity Factor Reference stress intensity factor, K refK (MPa m) ref (MPa√m)
Figure 10: Crack Growth Rate data for FASTRAN Runs with smoothing
16
100
DSTO-TR-2195
3.3.3 Determining m2,E and C2,E for the RAAF spectrum The CGR for the RAAF spectrum was predicted using the EBA parameters evaluated from FASTRAN and the FSFT coupon data (See section 3.2). The three methods described in Section 2.2 were each used to generate a prediction. The experimental and the predicted CGRs are plotted in Figure 11.
CrackGrowth growth Rate rate, da/dB (m/SFH) Crack
1.E-05
1.E-06
1.E-07
1.E-08
1.E-09
Coupon QF data (RAAF) EBA Paris model (RAAF, Coupon QF data) EBA - Method 1 m=2 EBA - Method m = m1,E 2 EBA - Method Variable 3- m
1.E-10 1
10 Reference m) ReferenceStress stressIntensity intensityFactor factor, KKref (MPa√m) ref (MPa
100
Figure 11: EBA prediction of the crack growth rate under the RAAF spectrum evaluated from the FSFT coupon crack growth data Coefficients of determination were evaluated for each of the predictions and are presented in Table 1. The results indicate that method 1, which involved setting m2,E = 2, provided the highest correlation. The least-square fit of the RAAF coupon data is presented as a comparison for the predictions. Table 1: EBA prediction of the crack growth rate parameters under the RAAF spectrum evaluated from the FSFT coupon crack growth data Method Least Squares fit EBA - Method 1: m = 2 EBA - Method 3: Variable - m EBA - Method 2: m = m1,E
m 1.966 2.000 1.793 1.362
C 9.052×10⁻¹⁰ 1.083×10⁻⁹ 3.021×10⁻⁹ 9.317×10⁻⁷
R2 0.7362 0.7093 0.5993 0.5100
17
DSTO-TR-2195
3.3.4 Prediction of crack growth under RAAF spectrum The EBA constants for the RAAF spectrum were then used to predict the crack growth. Crack growth curves corresponding to the variable-m, m2,E = m1,E and m2,E = 2 approaches are plotted in Figure 12 along with experimental data and the least squares fit. The initial crack size used in this plot is that obtained using exponential extrapolation of the FSFT crack growth curve, i.e. 1.52 × 10⁻⁵ m. Figure 13 shows the same results on a linear scale. Figure 14 and Figure 15 show a similar comparison between the experimental data and the FASTRAN prediction. 0.1
a (m)
0.01
0.001 RAAF-FCA361-a (167.9MPa) RAAF-FCA361-b (167.9MPa) RAAF-FCA361-c (167.9MPa) RAAF-FCA361-d (167.9MPa) Variable m- m Variable m m==mm1,E 1,E m= 2 m Least Squares
0.0001
0.00001 0
10000
20000
30000
40000
50000
60000
70000
Simulated Flight Hours -5
Figure 12: EBA prediction for the RAAF spectrum using an initial crack size of 1.52×10 m compared to the RAAF coupon data
18
DSTO-TR-2195
0.014
RAAF-FCA361-a (167.9MPa) RAAF-FCA361-b (167.9MPa) RAAF-FCA361-c (167.9MPa) RAAF-FCA361-d (167.9MPa) Variable m -m Variable = m1,E m1,E m= m m ==22 Least Squares
0.012 0.01
a (m)
0.008 0.006 0.004 0.002 0 0
10000
20000
30000
40000
50000
60000
70000
80000
Simulated Flight Hours -5
Figure 13: EBA prediction for the RAAF spectrum using an initial crack size of 1.52×10 m compared to the RAAF coupon data
0.1
a (m)
0.01
0.001
RAAF-FCA361-a (167.9MPa) RAAF-FCA361-b (167.9MPa) RAAF-FCA361-c (167.9MPa) RAAF-FCA361-d (167.9MPa) FASTRAN
0.0001
0.00001 0
50000
100000
150000
200000
Simulated Flight Hours -5
Figure 14: FASTRAN prediction for the RAAF spectrum using an initial crack size of 1.52×10 m compared to the RAAF coupon data
19
DSTO-TR-2195
0.014 0.012 0.01
a (m)
0.008 0.006 RAAF-FCA361-a (167.9MPa) RAAF-FCA361-b (167.9MPa) RAAF-FCA361-c (167.9MPa) RAAF-FCA361-d (167.9MPa) FASTRAN
0.004 0.002 0 0
50000
100000
150000
200000
Simulated Flight Hours -5
Figure 15: FASTRAN prediction for the RAAF spectrum using an initial crack size of 1.52×10 m compared to the RAAF coupon data Table 2: Comparison of total life Total life ( a f = 10 mm) (SFH) RAAF Coupon average EBA - Method 1: m = 2 EBA - Method 2: m = m1,E EBA - Method 3: Variable - m FASTRAN (RAAF spectrum)
Difference between the prediction and the RAAF coupon average (%)
40986 16312
60.2%
12261.5 11502.7 136288
70.1% 71.9% -232.5%
The predictions presented in Figure 12 to 15 demonstrate that in the case of the P-3C coupon data that both the EBA and FASTRAN solutions displayed poor correlation in terms of the crack growth curves below 0.5 mm and also in terms of the final life at a f = 10 mm.
3.3.5 A comparison of inspection intervals While the above analysis has compared the total crack growth life to a final crack length of a f = 10 mm, this section seeks to compare the inspection intervals calculated using both FASTRAN and the EBA. The previous analysis has shown that modelling the initial stages of crack growth has resulted in poor estimates of the total life. A comparison of the inspection interval will provide an indication to the quality of the prediction in the final stages of crack growth when the crack is of sufficient size to be detectable.
20
DSTO-TR-2195
The simulated flight hours between a crack first detected ( aNDI ) with a length of 1.27 mm (a typical bolt hole eddy current size (Teunisse, Phillips et al. 2006)) and a final crack length of 10 mm has been recorded in Table 3. The final crack length was chosen based on the typical final crack length observed for the coupons. The percentage difference between each of the predictive methods is compared to the RAAF coupon data. As can be seen in this table, predictions of the inspection interval appear to be far more reliable than predictions of total life. In this particular case the EBA produced better results than FASTRAN. Method 1 produced the best estimate of the inspection interval. Table 3: Comparison of total crack growth interval between 1.27 mm and 10 mm Life (1.27 mm – 10 mm) (SFH) RAAF Coupon average EBA - Method 1: m = 2 EBA - Method 2: m = m1,E EBA - Method 3: Variable - m FASTRAN (RAAF spectrum)
Difference between the prediction and the RAAF coupon average (%)
7444 7401
0.6%
7890 6647 6009
-6.0% 10.7% 19.3%
3.4 Outer Wing Lower Panel/Cap Splice Finally, we attempt to apply the EBA to predict the crack growth in a real aircraft structure subjected to the FSFT spectrum. Quantitative fractography has been conducted on a crack located in the outer wing lower panel/cap splice at a location designated WS 220. During the testing of the wing fuselage FSFT article, a crack was found after 16,785 hours of FSFT cycling in panel 1 at WS 220. This crack, designated FCA361-CDN-4, was in the fastener that is common to the front spar cap and panel 1 splice. The quantitative fractography conducted at the DSTO (Grummett and Goldsmith 2003), Figure 16, has been used here to examine the use of the EBA applied to a real problem. A loglinear extrapolation of the data was used to estimate an initial flaw size of 0.018 mm.
21
DSTO-TR-2195
100
FSFT (FASTRAN Prediction) DSTO FSFT QF Expon. (DSTO FSFT QF)
Crack Length, a (mm)
10
1
0.1
0.01
a
0.001 0
5,000
10,000
15,000
20,000
Simulated Flight Hours
Figure 16: Log-linear extrapolation and a FASTRAN back prediction of the quantitative fractography obtained from crack FCA361-PSS-4 The beta factors solution shown in Figure 17 was originally developed by Lockheed-Martin evolving a corner crack through to a through crack for the relevant location of interest. This solution has been used in the P-3 test interpretation report DSTO-TR-1929 (Teunisse, Phillips et al. 2006). 4 3.5 3
β
2.5 2 1.5 1 0.5 0 0
0.1
0.2
0.3
0.4 a (mm)
Figure 17: Outer wing lower panel/cap splice beta solution
22
0.5
0.6
0.7
DSTO-TR-2195
The EBA crack growth parameters were evaluated using the quantitative factography data from FCA361-PSS-4 as shown in Figure 18. 1.00E-04
Crack Growth Rate
da/dB
1.00E-05
1.00E-06
1.00E-07
FCA361-PSS-4 (197.8MPa) m=1.75 m=2.00 1.00E-08 10
100
Reference Stress Intensity Factor K ref (MPa m ) K refKref (MPa m )
Figure 18: Crack growth rate evaluated from the FCA361-PSS-4 quantitative fractography data Earlier work conducted by (Jackson and Amaratunga 2007) identified that a back prediction using the EBA in some cases produced unrealistic estimates of the initial flaw size. Following discussions (Zhuang and Molent 2007) advice was given to use log-linear back extrapolation to estimate the initial flaw size. In response to these discussions it was agreed that a log-linear back extrapolation produced reasonable estimates of the initial flaw size and should be used in conjunction with the EBA. If the exponent m is set to 2 and beta is kept constant we would expect to see a straight line on a log-linear scale in Figure 19. The EBA predictions presented in Figure 19 display significant curvature as the beta solution in Figure 18 is not constant and larger when the crack is small. The EBA constants evaluated from the FCA361-PSS-4 quantitative fractography data and the coupon data were used to predict the crack growth from an initial flaw of 0.018 mm. These predictions were then compared to the original FCA361-PSS-4 quantitative factography data in Figure 19.
23
DSTO-TR-2195
100
Crack Length, a (mm)
10
1
c
0.1
DSTO FSFT QF EBA prediction with m=1.75 EBA prediction with m=2.0 EBA prediction with C & m from coupon data FSFT (FASTRAN Prediction) Expon. (DSTO FSFT QF)
0.01
0.001 0
5,000
10,000 Simulated Flight Hours
15,000
20,000
Figure 19: EBA predictions of a crack with an initial flaw size of 0.018 mm located at WS 220 A comparison of the total predicted life and the total life of FCA361-PSS-4 is presented in Table 4. Here a substantial difference is noted between the experimental data and the EBA prediction. The differences noted in Table 4 increase if we use an estimate of the initial flaw size based on exponential back extrapolation. Table 4: Comparison of total life Total life (SFH a f = 17 mm) FSFT article EBA prediction with m = 1.75 EBA prediction with m = 2.00 EBA prediction with C and m evaluated from the coupon test data
Difference between the FSFT article and EBA predictions (%)
16785 8826 10026
47.4% 40.3%
11144
33.6%
If now we consider a crack growth interval instead of the total life we can peg the EBA predictions to the final crack length experimentally observed in Figure 19. Table 5 compares the crack growth interval between the first quantitative fractographic measurement at 13880 hours and the final quantitative factographic measurement at 16785 hours. As can be seen the results are slightly better for the EBA parameters predicted from the FCA361-PSS-4 data. However, there is significant uncertainty associated with these parameters due to the limited data set. A 95% confidence interval on the exponent m2,E indicates an uncertainty of ±2.13, which is significant in comparison with the estimated exponents. In terms of the crack growth
24
DSTO-TR-2195
interval between 5.7 mm and 17 mm the original P-3 SLAP FASTRAN prediction provides the best result. Table 5: Comparison of crack growth intervals between 5.7 mm and 17 mm Life (5.7 mm - 17 mm) (SFH) FSFT article EBA prediction with m = 1.75 EBA prediction with m = 2.00 EBA prediction with C and m evaluated from the coupon test data FASTRAN
Difference between the FSFT article and EBA predictions (%)
2905 3606 3642
-24.2% -25.4%
5279
-81.7%
3030
-4.3%
25
DSTO-TR-2195
4. The EBA Evaluation using F-111 LITV Coupon Data This section further evaluates the EBA using F-111 coupon data for coupons manufactured from 2024-T851 aluminium alloy. A similar procedure to the one used in the previous section is used here to examine whether the CGR could be represented by the EBA and whether the model parameters could be transferred to an untested spectrum. The effect of small scale yielding is also investigated.
4.1 F-111 loads interpretation and truncation validation coupon test data The recent loads interpretation and truncation validation (LITV) test program yielded quantitative fractographic data for several load spectra. A draft report (Diab and Goldsmith 2007) of the program was made available to aid the assessment of the EBA. On a critical assessment of the fractography data it became clear that the LITV program experienced technical difficulties during the test. These difficulties resulted in the rejection of the results from a significant number of coupons. While sufficient data were obtained for the primary objective of the LITV program, only a small amount of data is useful for the assessment of the EBA. Table 6 lists the data sets that were considered valid for the evaluation of the EBA, although these data have been rejected by the LITV program, on the basis that the old test controller used on these tests was not able to reach the nominal load. But assuming that the problem with the old controller was systematic, hence the error in the peak load achieved was systematic, these data would still be valid for the evaluation of the EBA. In the present analysis the reference stress is defined as the peak stress in the spectrum, as listed in Table 6, although it should be understood as nominal, given the technical difficulties experienced by the test controller. Table 6 Summary of experimental data rejected by LITV program, but included in EBA evaluation 2 Data set designation R4(FL3), R5(FL3) R6(FL4), R7(FL4), R8(FL4), W7(FL4) T1(FL5), T2(FL5), T3(FL5) T4(FL6), T4(FL6) U1(FL7), U2(FL7), U4(FL7) U5(FL8), U6(FL8), U7(FL8)
Reference stress 218.9MPa 240.7MPa 196.7MPa 218.9MPa 240.7MPa 196.7MPa
The coupons used in the LITV coupon test program were double edge notch tension specimens with a stress concentration factor of K tn = 2.5, to simulate a generic location on the 2
The F-111 data sets are designated as a combination of specimen ID plus load spectrum ID, e.g., R4(FL3) indicates that specimen “R4” subjected to spectrum FL3. Detailed description of the specimens and the spectra are given in (Diab and Goldsmith, 2007).
26
DSTO-TR-2195
lower skin surface of an F-111 wing. The coupons are identical to those used for the F-111 relative severity coupon test program, and further details are available in Ord (2004). For the calculation of the reference stress intensity factor, the boundary correction factors developed by (McDonald 2006) have been used here. This solution was obtained for a corner crack that transitions to a through-thickness crack. No attempt has been made to assess the validity or quality of this solution.
4.2 The EBA’s Ability to Model the F-111 LITV Coupon Test Data In order to evaluate the ability of the EBA to model the LITV data, it was desirable to have data at several load levels. This permitted the assessment of the EBA to model the data at a particular stress level and the examination of the effect of the peak stress of the spectrum on the model parameters. The selected LITV data were obtained from two spectra with three stress levels. The spectra considered are based on the F-WELD test spectrum at FASS 226 (Diab and Goldsmith 2007).
4.2.1 The EBA applied to the F-111 LITV coupon test data To examine the ability of the EBA to model the test data and establish the possible independence of the CGR parameters C and m on the applied reference stress, a comparison of CGR versus the reference stress intensity factor at several scaling stress levels was performed. A statistical analysis of the data has been conducted to examine the log-linearity of the crack growth data and can be found in Appendix A. The statistical analysis of the experimental data in Appendix A indicates that all the regression curves are essentially the same within experimental scatter. The results indicate that a linear regression of the data is a satisfactory approximation, supporting the Paris-type model used in the EBA. The analysis also demonstrates that within experimental uncertainty, increasing or decreasing the reference stress by 10% does not significantly alter the observed CGRs. The fatigue CGR data for FL3, FL4 and FL5 spectra have been plotted in Figure 20 along with prediction intervals (see Appendix A for an explanation of the “prediction interval”) associated with the regression analysis of these load spectra. This figure provides further confidence that one regression analysis is sufficient to predict CGRs for future measurements with 95% confidence.
27
DSTO-TR-2195
1.00E-05
R4 (FL3) (219.6MPa) R5 (FL3) (219.3MPa) FL4 Upper Bound FL3 Lower Bound R6 (FL4) (240.7MPa) R7 (FL4) (240.7MPa) R8 (FL4) (240.7MPa) W7 (FL4) (240.7MPa) FL4 Upper Bound FL4 Lower Bound T1 (FL5) (196.7MPa) T2 (FL5) (196.7MPa) T3 (FL5) (196.7MPa) FL5 Upper Bound FL5 Lower Bound
1.00E-06
Crack Growth Rate
da/dB
1.00E-07
1.00E-08
1.00E-09
1.00E-10 1
10
100
Reference StressKK Intensity Factor K ref (MPa m ) (MPa√m) refref(MPa m )
Figure 20: Prediction intervals (upper and lower limits) for FL3, FL4 and FL5 crack growth rate data sets Accepting that increasing or decreasing the applied reference stress by 10% does not affect the CGR parameters C and m then pooling all the data allows us to reduce the error in C and m to yield more representative estimates for C and m . The results are presented in Table 7. Table 7. Pooled Crack Growth Constants for the F-WELD test spectra Spectra
m
FL3,FL4,FL5
2.87
Uncertainty in m 0.08
ln(C) -24.05
Uncertainty in ln(C) 0.18
R2 0.9659
No. of Coupons 9
Analysis was also conducted for the FL6, FL7 and FL8 spectra. The fatigue CGR data for FL6, FL7 and FL8 spectra have been plotted in Figure 21 along with prediction intervals associated with the regression analysis of these load spectra. Despite the different slope of the regression through the FL6 data, reasonable agreement between all three data sets can be observed in the region of 1< K ref