An evidence-based predictive tool for motivating engagement, completion, and success in freshmen engineering students Achela K. Fernando Unitec Institute of Technology, Auckland, New Zealand
[email protected] Peter Mellalieu Unitec Institute of Technology, Auckland, New Zealand
[email protected] Abstract: In general, teachers deploy several methods to encourage their students to engage early with their learning during their course of study. These methods include: presentation of previous years’ pass/fail rates; feedback from previous students; and anecdotal evidence suggesting that active engagement, punctuality in attending lectures, and good performance in interim assessments will contribute to success. We postulate that engineering students will be more inclined to improve their behaviour if they are provided with quantitative evidence that adopting certain behaviours will enhance success and improve course grades. Furthermore, we postulate that students will embrace a conceptual and logical tool that allows them to take control of the course outcome they seek. A tool based on these principles has already been accepted and used enthusiastically by some students in another department at Unitec(Mellalieu, 2011). Inspired by the success of this approach, we have conducted a data mining analysis of previous students’ class attendance and assessment performance records to develop a similar tool for a freshman course within an undergraduate engineering programme at the same institution. The model underpinning the tool demonstrates empirically that better attendance in lectures and higher performance in interim summative assessments are associated with higher final examination results. Furthermore, the tool enables the lecturer to achieve early detection of ‘at risk’ and struggling students who may not achieve successful course completion without a significant intervention by the teacher, and/or change in behaviour by the student. At Unitec, a conscious effort is made to attract to engineering education students from communities whose participation hitherto has been low. Identifying and following up those who may be experiencing difficulties is crucial for their retention and maintaining diversity. All New Zealand tertiary institutes are now increasing their focus on successful completions (outputs) rather than the number of enrolments (inputs). The tool described is one useful approach to providing necessary and timely additional support to students at risk of failing to complete.
Introduction Tertiary institutes are focussing increased attention on identifying which students are likely to succeed - or fail - in their tertiary studies. Historically, academics have been keen to identify the ‘bright young things’ they view as prospects for recruiting to postgraduate courses. Less attention has been paid to those students who fall by the wayside since there have been plenty of ambitious and talented students to take their place. More recently, institutions have been obliged to pay attention to identifying those students ‘at risk’ of failure and conducting remedial interventions. For instance, Culver (Culver, 2011a, 2011b) reports on the services provided by the Noel-Levitz consultancy for improving institutional retention in North America. He argues that the business case for active and early management of student retention is compelling. New Zealand tertiary institutes are beginning to use approaches for success and retention similar to Proceedings of the 2011 AAEE Conf, Fremantle, Western Australia, Copyright © Fernando and Mellalieu, 2011
312
those adopted by North American institutions. The driver for the New Zealand initiative is that government funding for higher education is being redirected towards a focus on outputs (such as course completions) rather than inputs (student enrolments); government funding is given to completions of academic programmes rather than simply student enrolments (MoE, 2010). It is noteworthy that in New Zealand about one-half of tertiary education funding is allocated through grants and loans to students, and institutional funding. Concurrently, another policy focus has been to recruit students from non-traditional demographic sectors into higher education. Furthermore, there are also significant funds and support made available for students from non-traditional backgrounds but with matching expectations to succeed. Unitec is a tertiary education institute with a specific mandate for trades training, technology-based undergraduate degrees and diplomas. In the Department of Civil Engineering, first year courses such as Mathematics and Fluid Mechanics that rely on proficient numeracy skills experience relatively higher failure and dropout rates ranging from 40-50%. Several factors are presumed to contribute to this lack of success: • The need for teaching delivery efficiencies has led to larger combined classes of students enrolled in different programmes with diverse prior learning experiences and learning capabilities; • New Zealand's increasing need for engineers and engineering technologists in the medium to long term future has compelled tertiary institutes to encourage participation of students from underrepresented demographics who are still adapting to the challenges of studying the 'new' study areas; and • An apparent decrease in the numeracy and literacy skills of new entrants. For instance, a recent study reports that around 40% of adult New Zealanders have literacy and numeracy skills “below a level needed to use and understand the increasingly difficult texts and tasks that characterise a knowledge society and information economy” as stated by Coolbear and Schöllmann (Whatman, Potter, & Boyd, 2011). Several years' experience teaching Fluid Mechanics to first year students suggested anecdotally an association between students' attendance in lectures, participation in class exercises, performance in intermediate assessments, and their final achievements in the examination. Consequently, several methods were deployed to convince and motivate each new student cohort of the benefits of early engagement to their learning. These methods included: presentation of previous years’ pass/fail rates; feedback from previous students; and anecdotal evidence suggesting that active engagement, punctuality in attending lectures, and good performance in interim assessments would all contribute to success. However, we suspect that engineering students might be more inclined to adopt success oriented behaviour if they are provided with quantitative evidence that their behavioural change can lead to success and improved course grades. Furthermore, students may embrace a conceptual and logical tool that allows them to take control of the course outcome they seek. A tool based on these principles has already been accepted and used enthusiastically by some students in the Business School of Unitec (Mellalieu, 2011). As a preliminary step to building such a tool, this paper identifies and establishes explicit, quantitative patterns between student behaviour and the outcomes achieved. Next, how a tool might be presented to students studying Fluid Mechanics is illustrated. Finally, how the tool developed could be extended to include additional data to provide early warning of 'at risk' students is presented. The benefits of the tool, not only to the lecturer, and the students but also to the management are discussed. As stated by Ambrose et. al. ((2010)) when considering ways that our students’ goals influence their learning behaviours it should be born in mind that students’ goals for themselves may differ from our goals for them.
Method This study drew on data collected for a total of 56 students enrolled in Fluid Mechanics in 2010. The data included, for each student, the enrolled programme, attendance in 10 lectures, marks for three summative assessments (counted as coursework), and a mark for the final examination. Table 1 below presents the characteristics of the programmes, number of lectures and tutorials (on left), and assessments (on right). Proceedings of the 2011 AAEE Conf, Fremantle, Western Australia, Copyright © Fernando and Mellalieu, 2011
313
Table 1: Characteristics of the programme
Diploma students (DIP) BEngTech Degree students (DEG) Total students Lectures & tutorials (L1, L2,L3, etc)
Number
Assessment
Nature
30 26 56 10
Assignment Test Lab Report Examination
Open book Closed book Open book Closed book
Course weight 15 20 15 50
The analysis sought answers to questions of value to the lecturer, students and institute’s management: 1. Is the attendance in lectures in the early stages critical to the examination outcome? If affirmative then it provides one good early indicator for the lecturer to identify at-risk students. 2. Is overall attendance in lectures critical to the examination outcome? If affirmative then it provides evidence-based quantifiable proof and a tool for student motivation. 3. Do students in different programmes perform differently? If affirmative then it suggests that the differences in prior learning in the two programmes play a significant role and further reflection is needed before management combines these two groups in the future. 4. Is attendance of students who have more advanced prior learning important to success? If positive then it further confirms (2) above and can be a motivational outcome for students. 5. Is the performance in early open book uncontrolled assessment (the first assessment) indicative of the performance at the final examination? If affirmative this gives the lecturer a second opportunity to identify at-risk students fairly early in the semester. The outcome is valuable for the lecturer as well as managers to put in place supportive mechanisms. 6. Is the performance in the Test (closed book) indicative of the performance at the final examination? If affirmative, it confirms the view that the outcome of a closed book assignment is a good judge of the result likely from an examination, a useful information for the lecturer and management. 7. Do the data suggest a revival in student performance following a closed book assessment event? If affirmative, for lecturers it confirms the need for at least one closed book event in the coursework component that provides a simulation of examination conditions. For students it provides an opportunity to appreciate the need for adequate preparation for an examination. An exploratory data analysis approach was used to identify and explore the foregoing hypotheses using the WEKA® data mining workbench software (Bouckaert et al., 2010; Hall et al., 2009; UoW(MachineLearningGroup), 2011). The exercise included uploading the relevant data from the sample of 56 students and eliciting models that 'best' represented the relationship between the inputs (contributing factors) and output (exam mark). In this context, the 'best' models were chosen on the basis of parsimony in the number of variables used and statistical measures (such as standard error). Using the identified relationships, a specific predictive decision support tool assembled in the form of a series of Microsoft Excel® spread sheets was developed to be used by the lecturer, students and management.
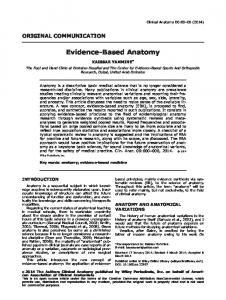
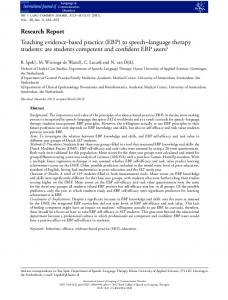
Results The results obtained from the data mining process and the elements of the predictive tool developed using those results are presented below in relation to the questions above. The predictive tool was a simple, easy to use Excel workbook containing worksheets for each predictive component. Attendance in lectures (Early Detection worksheet) The rules extracted for the set of data provided to the WEKA® Explorer analysis suggested a positive correlation between the attendance in the first four lectures (L1, L2, L3, L4) and the expected mark in the final examination. It also suggested that the enrolled programme (degree or diploma) was significant in the prediction of the exam mark. For illustrative purposes, the Expression Tree (REP Tree) output obtained from WEKA® Explorer shown in Figure 1 illustrates the dependence of the exam mark on early attendance and enrolled programme. The early detection tool generated with this expression tree (shown in Figure 2) provides a useful instrument for the lecturer as well as the student.
Proceedings of the 2011 AAEE Conf, Fremantle, Western Australia, Copyright © Fernando and Mellalieu, 2011
314
Expected Exam mark (67) Number of fits (12)
Variance(145)
Figure 1: The REP Tree from WEKA®
Figure 2: The “Early detection” tool
Figure 3b: The “Attendance” motivator tool
Figure 3a: The “Attendance” motivator tool
Figure 4a: The “Assignment to Exam” tool Figure 4b: The “Assignment to Exam” tool (for assignment mark of 12) (for assignment mark of 4)
Figure 5a: The “Assignment to Exam” tool (for assignment mark of 12)
Figure 6a: The “Test to Exam” tool (Test 5.5)
Figure 5b: The “Assignment to Exam” tool (for perfect assignment mark )
Figure 6b: The “Test to Exam” tool (Test 11.9)
Figure 6c: The “Test to Exam” tool (Test 12) Figure 7: The “Course work to Exam” tool Proceedings of the 2011 AAEE Conf, Fremantle, Western Australia, Copyright © Fernando and Mellalieu, 2011
315
Overall attendance in lectures (Attendance worksheet) It is reported that the most important factors in deciding whether to attend a lecture or not are the quality and clarity of the lectures, followed by conflicting deadlines for other classes, the lecturer’s use of relevant examples, and the lecturer’s ability to engage and entertain the students (Clay & Breslow, March/April 2006). Evidence illustrating a clear positive correlation between attendance in lectures and the final exam mark as shown in Figure 3a can be an effective motivator and an input into students’ time-management. Moreover, the ability to “play” with the tool allows students to explore quantitatively the possible detrimental effects of absenteeism (Figure 3b). Forecasting exam mark from uncontrolled assessment (Assignment to Exam tool) The correlation between the assignment mark and the expected examination mark is positive but weak implying a low sensitivity at the low range and a high sensitivity towards near-perfect mark in this open book assignment. A change in the assignment mark from 4 to 12 makes no difference to the expected exam mark (Figure 4a &b) whereas a greater variation can be expected for high assignment mark (12-15) as seen in Figures 5a&b. It also implies that a mark as high as 12 in this assignment does not automatically forecast a high examination mark and that there is no room for complacency. Forecasting exam mark from closed book assessment (Test to Exam tool) The relationship between the test mark and the exam mark supports the view that the test conditions and student performance mirrors the exam reasonably well. In this case, these assessments are both closed book. The highest and average test marks are 92.5% and 45.8% respectively (18.5/20, and 9.16/20) while those for the exam are 93.3% and 53.1% respectively. As illustrated Figures 6a-c, there are three clusters of test marks that lead to three distinctive outcomes: